Embed Size (px)
Citation preview

1
IMPACT EVALUATION OF FISHERY IMPACT EVALUATION OF FISHERY CONSERVATION POLICIES IN THE PHILIPPINESCONSERVATION POLICIES IN THE PHILIPPINES
Maria Rebecca A. Campos, Ph.D.Maria Rebecca A. Campos, Ph.D.
Economy and Environment Program for Southeast Economy and Environment Program for Southeast Asia (EEPSEA)Asia (EEPSEA)
andandSoutheast Asia Regional Center for Graduate Southeast Asia Regional Center for Graduate Study and Research in Agriculture (SEARCA)Study and Research in Agriculture (SEARCA)
2
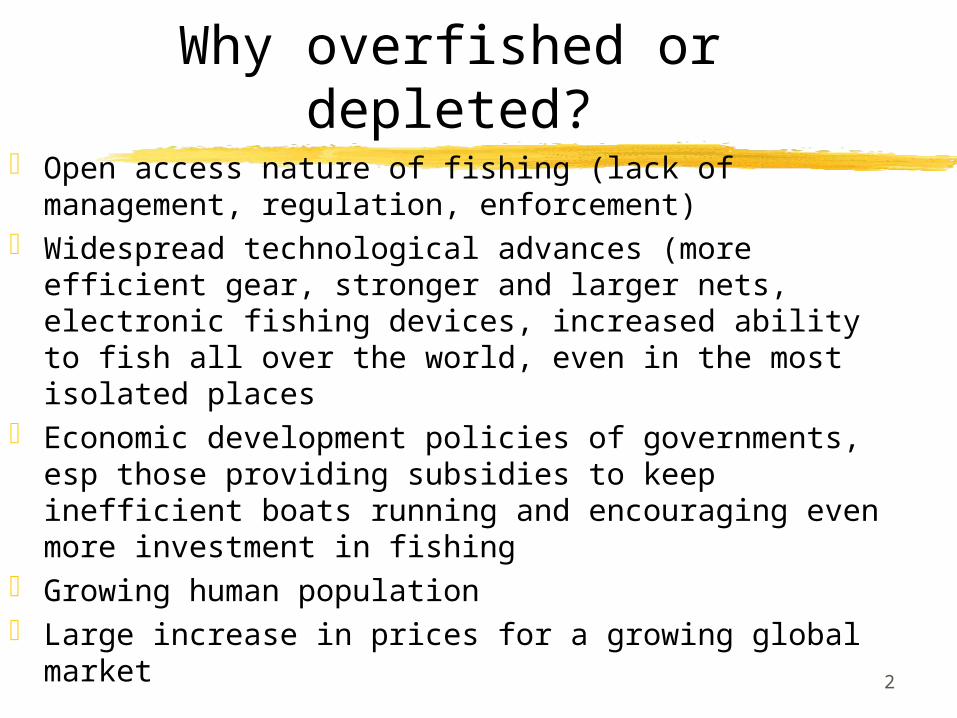
Why overfished or depleted? Open access nature of fishing (lack of management,
regulation, enforcement) Widespread technological advances (more efficient
gear, stronger and larger nets, electronic fishing devices, increased ability to fish all over the world, even in the most isolated places
Economic development policies of governments, esp those providing subsidies to keep inefficient boats running and encouraging even more investment in fishing
Growing human population Large increase in prices for a growing global market
3
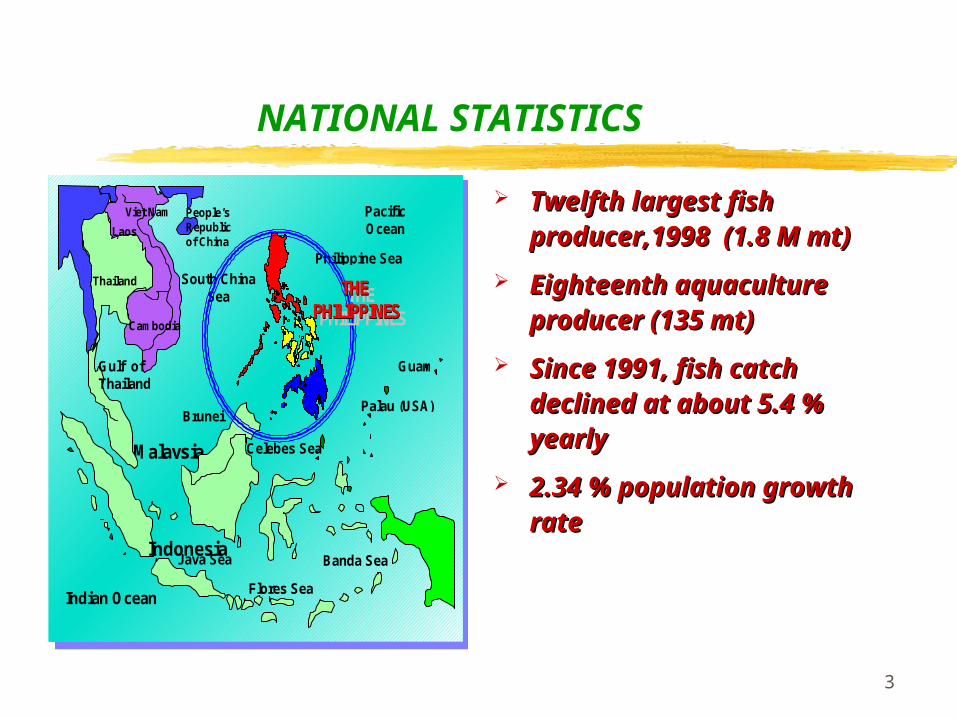
NATIONAL STATISTICS
Twelfth largest fish Twelfth largest fish producer,1998 (1.8 M mt)producer,1998 (1.8 M mt)
Eighteenth aquaculture Eighteenth aquaculture producer (135 mt)producer (135 mt)
Since 1991, fish catch Since 1991, fish catch declined at about 5.4 % declined at about 5.4 % yearly yearly
2.34 % population growth 2.34 % population growth raterate
Thailand
Malaysia
Palau (USA)Brunei
Guam
Philippine Sea
South ChinaSea
Java Sea Banda Sea
Flores SeaIndian Ocean
Indonesia
Gulf ofThailand
Viet Nam
Cambodia
Laos
THEPHILIPPINES
THETHEPHILIPPINESPHILIPPINES
PacificOcean
Celebes Sea
People’sRepublicof China
4
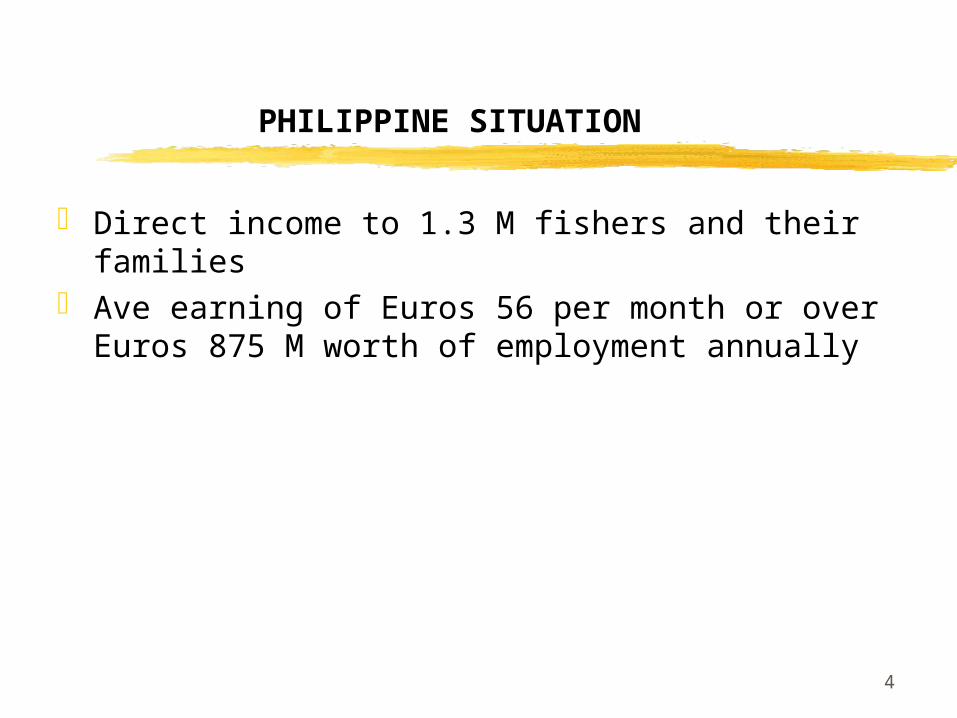
PHILIPPINE SITUATION
Direct income to 1.3 M fishers and their families Ave earning of Euros 56 per month or over Euros
875 M worth of employment annually
5
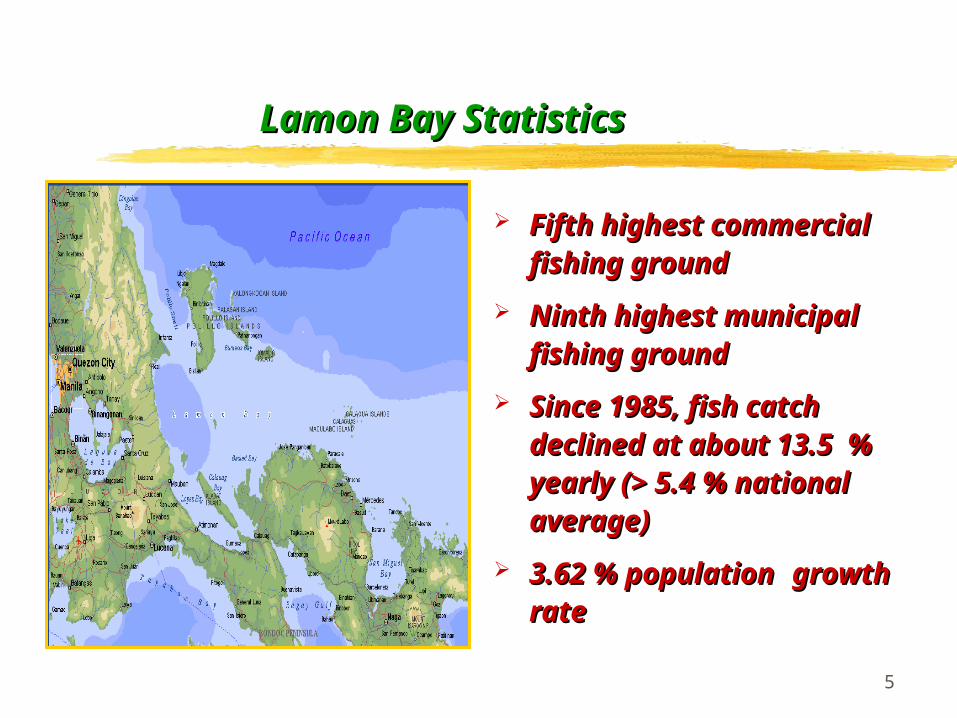
Lamon Bay StatisticsLamon Bay Statistics
Fifth highest commercial Fifth highest commercial fishing ground fishing ground
Ninth highest municipal Ninth highest municipal fishing groundfishing ground
Since 1985, fish catch Since 1985, fish catch declined at about 13.5 % declined at about 13.5 % yearly (> 5.4 % national yearly (> 5.4 % national average)average)
3.62 % population3.62 % population growth growth raterate
6
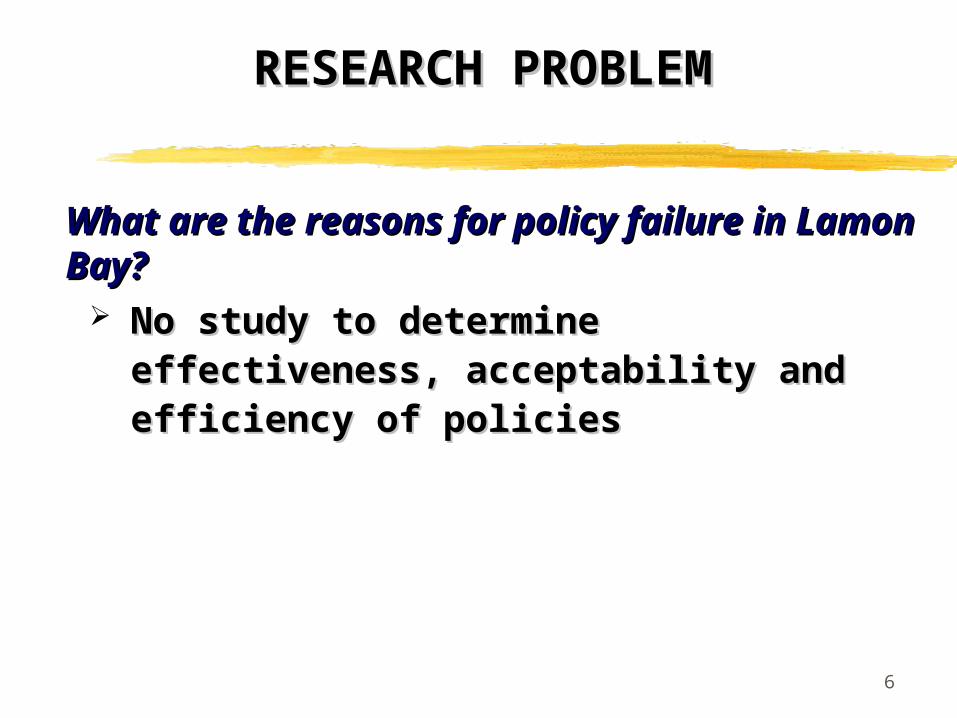
RESEARCH PROBLEMRESEARCH PROBLEM
What are the reasons for policy failure in Lamon What are the reasons for policy failure in Lamon Bay?Bay?
No study to determine effectiveness, No study to determine effectiveness, acceptability and efficiency of policiesacceptability and efficiency of policies
7
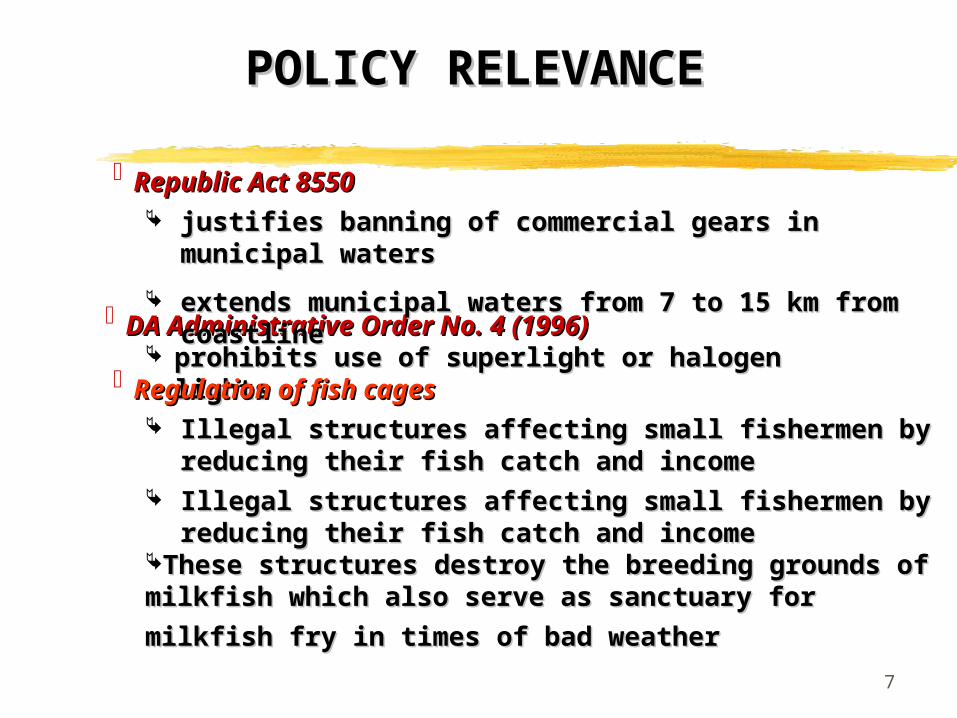
POLICY RELEVANCEPOLICY RELEVANCE
Republic Act 8550Republic Act 8550
DA Administrative Order No. 4 (1996)DA Administrative Order No. 4 (1996)
justifies banning of commercial gears in municipal watersjustifies banning of commercial gears in municipal waters
extends municipal waters from 7 to 15 km from coastlineextends municipal waters from 7 to 15 km from coastline
prohibits use of superlight or halogen lights prohibits use of superlight or halogen lights Regulation of fish cagesRegulation of fish cages
Illegal structures affecting small fishermen by reducing their Illegal structures affecting small fishermen by reducing their fish catch and income fish catch and income
Illegal structures affecting small fishermen by reducing their Illegal structures affecting small fishermen by reducing their fish catch and income fish catch and income
These structures destroy the breeding grounds of milkfish These structures destroy the breeding grounds of milkfish which also serve as sanctuary for milkfish fry in times of bad which also serve as sanctuary for milkfish fry in times of bad
weatherweather

8
POLICY RELEVANCEPOLICY RELEVANCE
Ban on electric shinersBan on electric shiners
These are fishing boats equipped with 200 to 1,000 watts These are fishing boats equipped with 200 to 1,000 watts incandescent lights powered by a dynamo incandescent lights powered by a dynamo
Prohibited in municipal waters because the light also Prohibited in municipal waters because the light also
attracts smaller fish that are not yet harvestableattracts smaller fish that are not yet harvestable Allowed if for research purposes onlyAllowed if for research purposes only
9
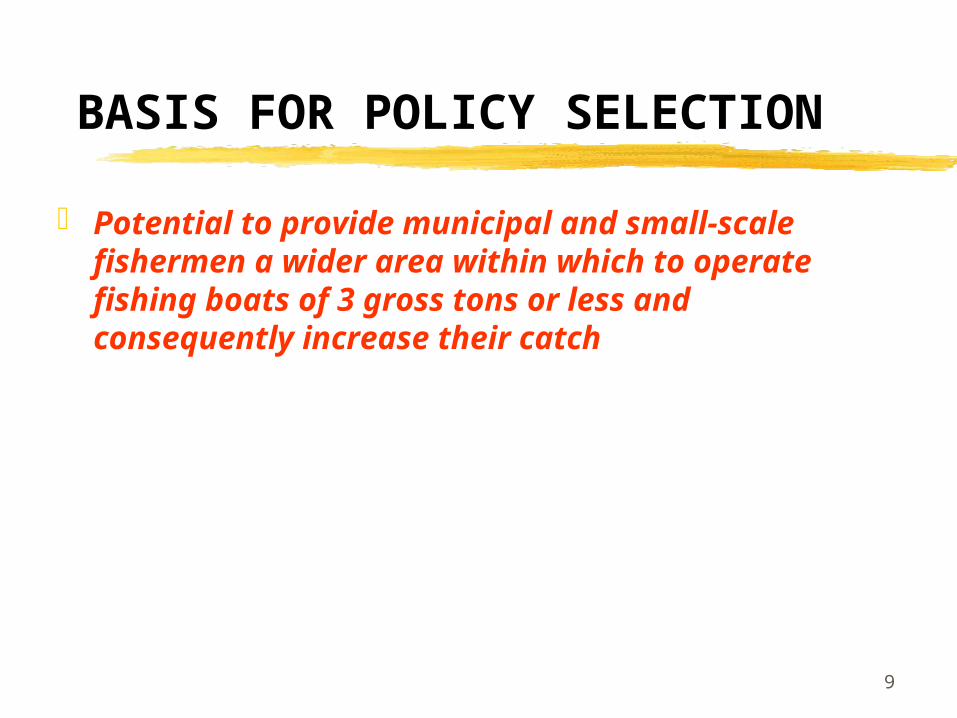
BASIS FOR POLICY SELECTION
Potential to provide municipal and small-scale fishermen a wider area within which to operate fishing boats of 3 gross tons or less and consequently increase their catch
10
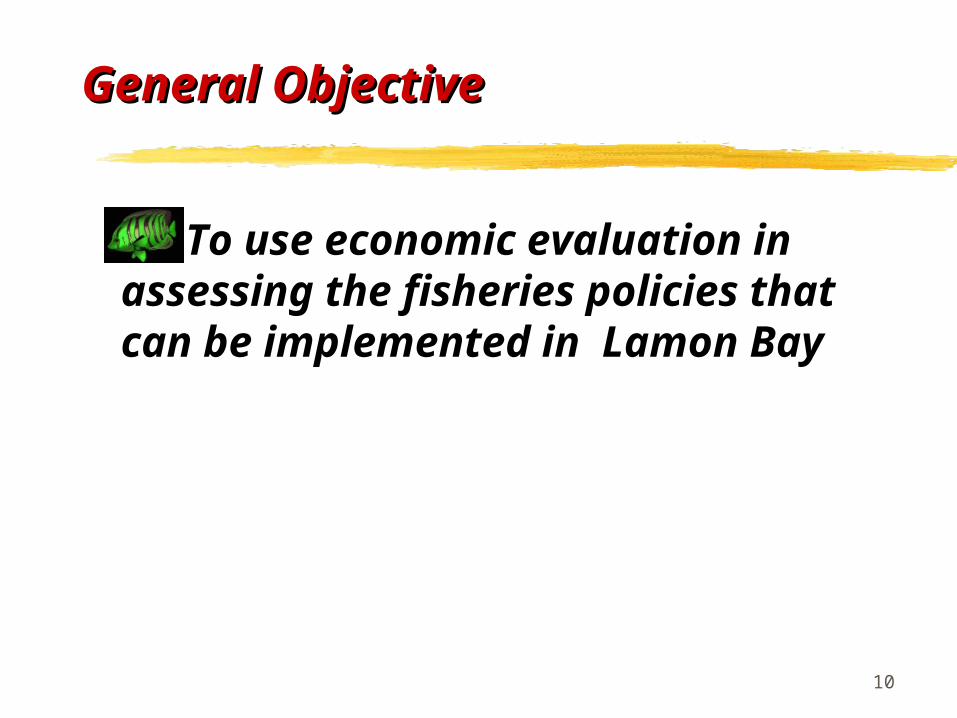
General ObjectiveGeneral Objective
To use economic evaluation in assessing the fisheries policies that can be implemented in Lamon Bay
11
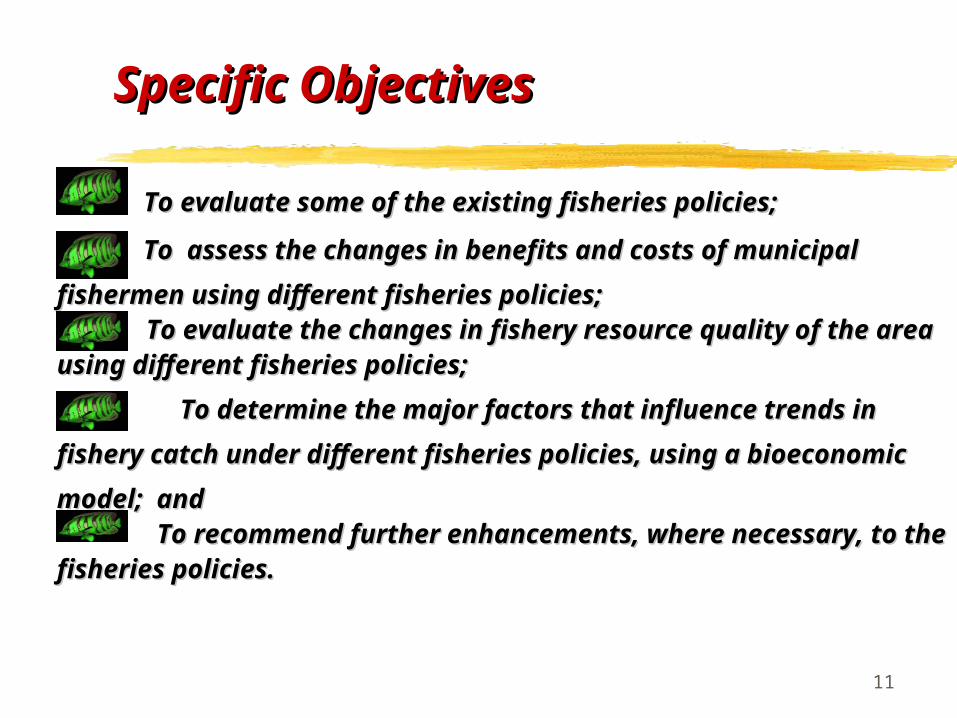
Specific ObjectivesSpecific Objectives
To evaluate some of the existing fisheries policies; To evaluate some of the existing fisheries policies;
To assess the changes in benefits and costs of municipal To assess the changes in benefits and costs of municipal
fishermen using different fisheries policies; fishermen using different fisheries policies; To evaluate the changes in fishery resource quality of the area To evaluate the changes in fishery resource quality of the area using different fisheries policies;using different fisheries policies;
To determine the major factors that influence trends in To determine the major factors that influence trends in
fishery catch under different fisheries policies, using a bioeconomic fishery catch under different fisheries policies, using a bioeconomic
model; andmodel; and To recommend further enhancements, where necessary, to To recommend further enhancements, where necessary, to
the fisheries policies. the fisheries policies.
12
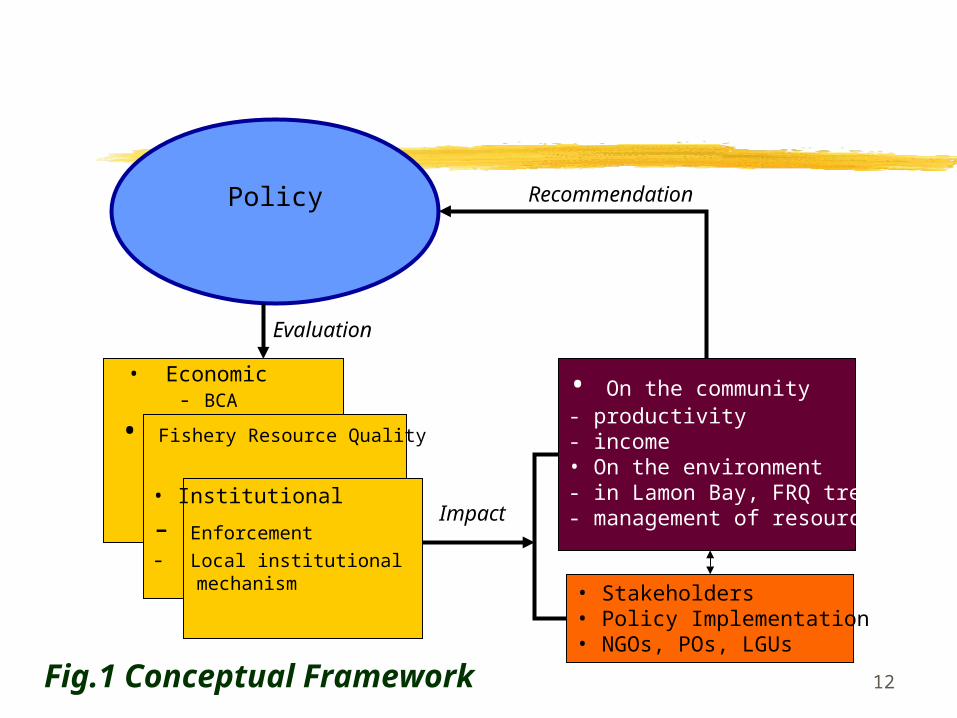
Policy
• Economic - BCA
• On the community- productivity- income• On the environment- in Lamon Bay, FRQ trends- management of resources
Recommendation
Impact
Evaluation
• Fishery Resource Quality
• Institutional
- Enforcement
- Local institutional mechanism • Stakeholders
• Policy Implementation• NGOs, POs, LGUs
Fig.1 Conceptual Framework

13
METHODOLOGY
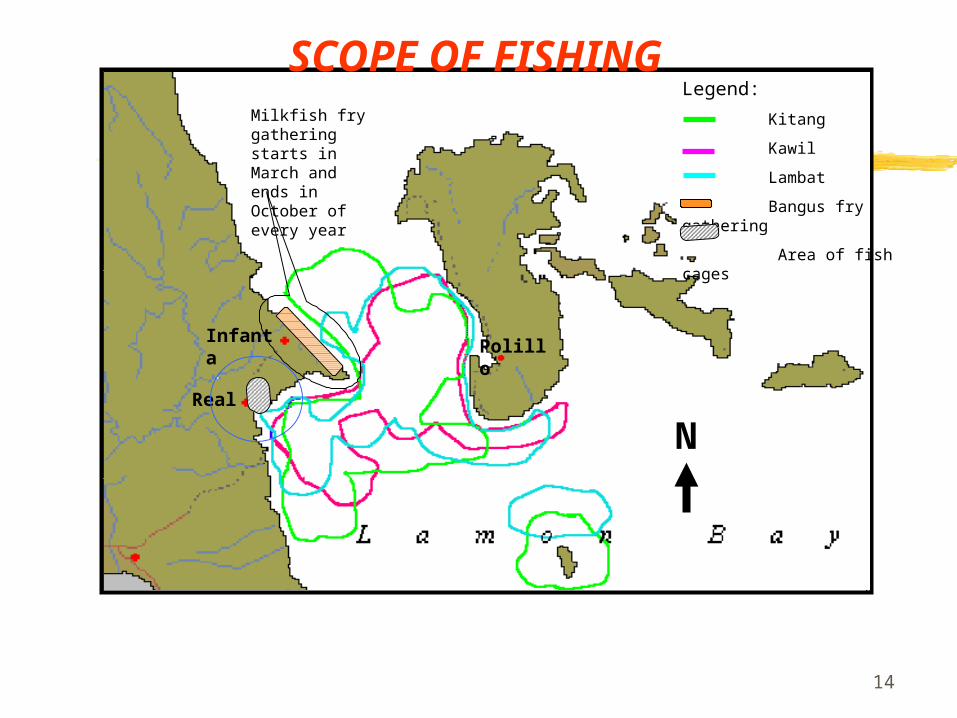
scope of fishingscope of fishing
identified 3 fishing methods used: hook and line, identified 3 fishing methods used: hook and line,
multiple hooks, and gill net (fish catch, length and multiple hooks, and gill net (fish catch, length and
exploitation rates, CPUE)exploitation rates, CPUE)
investigated current fisheries policies (effectivity investigated current fisheries policies (effectivity
and efficiency)and efficiency)
survey of 450 fisherfolksurvey of 450 fisherfolk
interview of local leaders and stakeholdersinterview of local leaders and stakeholders
bioeconomic modellingbioeconomic modelling
Benefit Cost AnalysisBenefit Cost Analysis
14
Infanta
Real
Polillo
N
Milkfish fry gathering starts in March and ends in October of every year
Legend:
Kitang
Kawil
Lambat
Bangus fry gathering
Area of fish cages
SCOPE OF FISHING
15
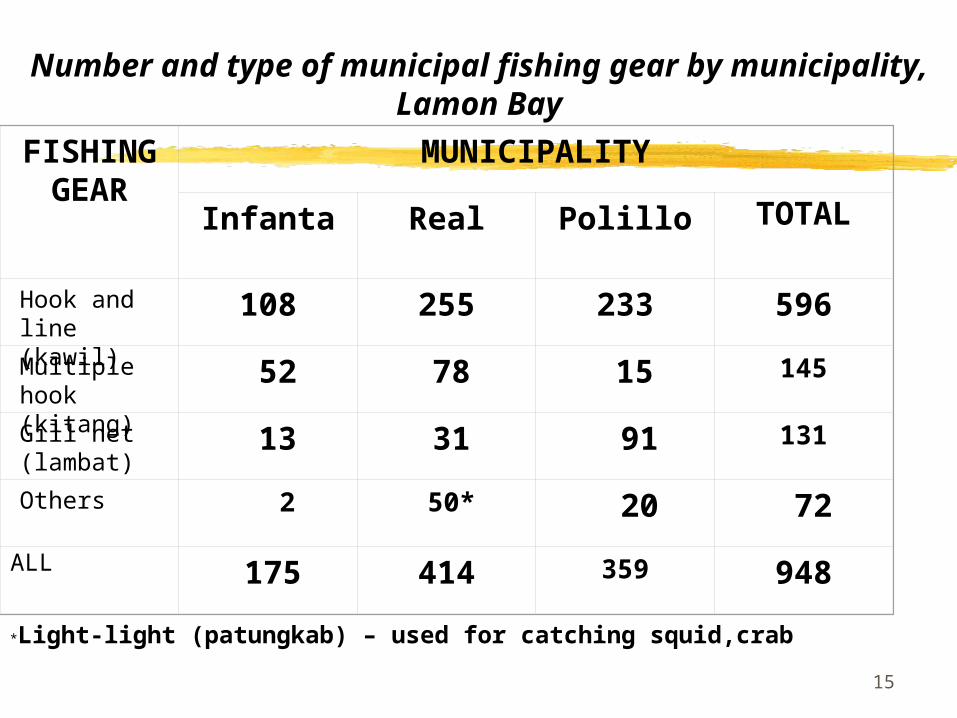
Number and type of municipal fishing gear by municipality, Lamon Bay
FISHING GEAR
MUNICIPALITY
Infanta
Real Polillo TOTAL
Hook and line (kawil)
108 255 233 596
Multiple hook (kitang)
52 78 15 145
Gill net (lambat)
13 31 91 131
Others 2 50* 20 72
ALL 175 414 359 948
*Light-light (patungkab) – used for catching squid,crab
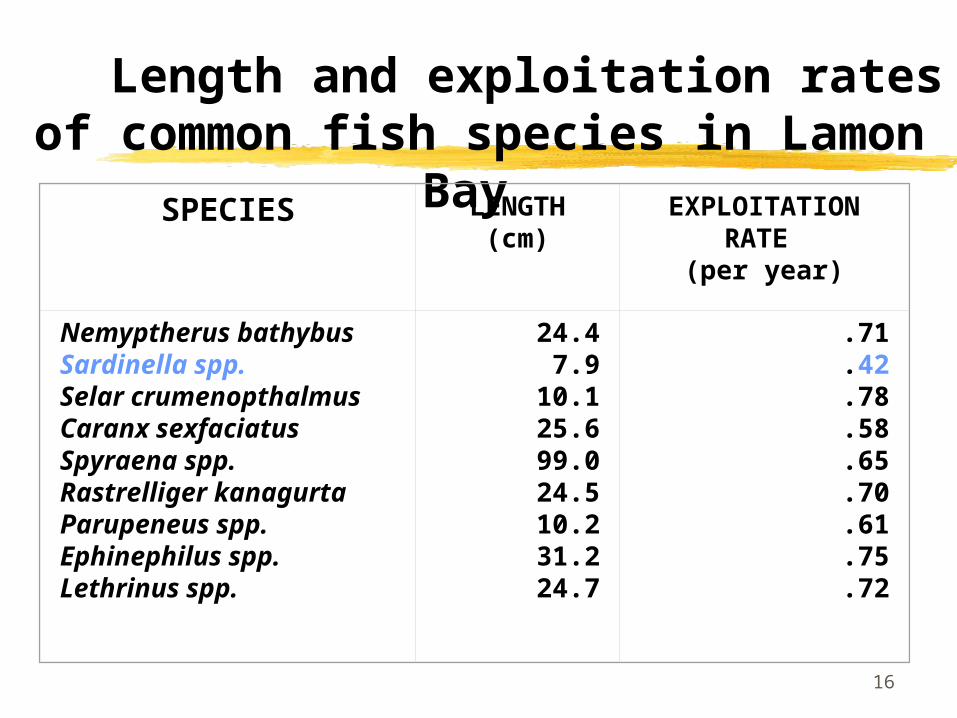
16
Length and exploitation rates of common fish species in Lamon
Bay
SPECIES LENGTH(cm)
EXPLOITATION RATE
(per year)
Nemyptherus bathybusSardinella spp.Selar crumenopthalmusCaranx sexfaciatusSpyraena spp.Rastrelliger kanagurtaParupeneus spp.Ephinephilus spp.Lethrinus spp.
24.47.9
10.125.699.024.510.231.224.7
.71
.42
.78
.58
.65
.70
.61
.75
.72
17
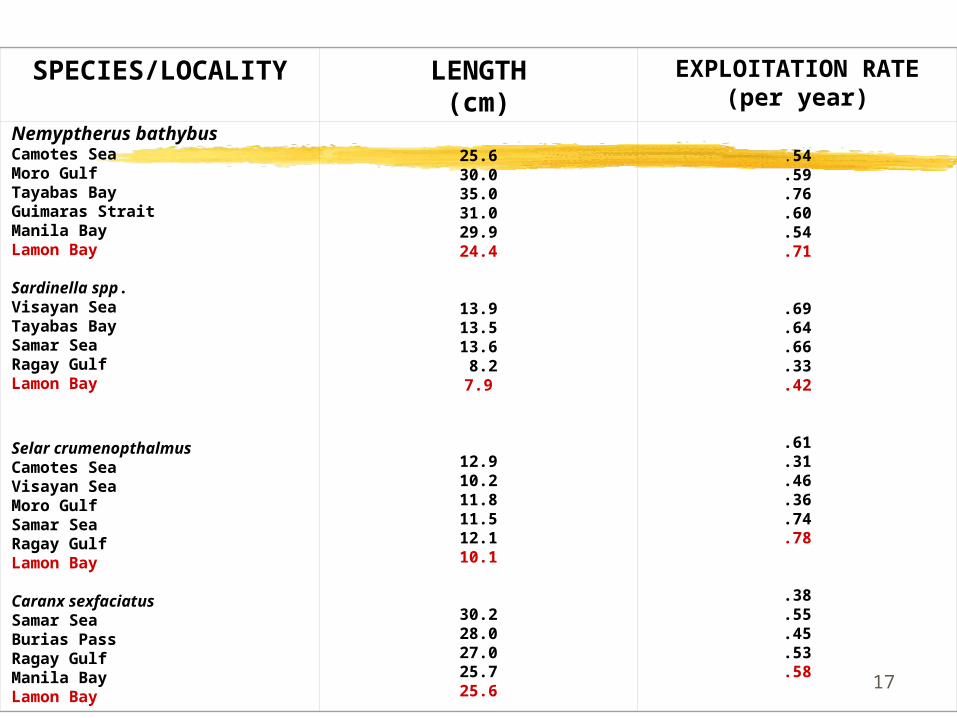
SPECIES/LOCALITY LENGTH(cm)
EXPLOITATION RATE (per year)
Nemyptherus bathybusCamotes SeaMoro GulfTayabas BayGuimaras StraitManila BayLamon Bay Sardinella spp.Visayan SeaTayabas BaySamar SeaRagay GulfLamon Bay
Selar crumenopthalmusCamotes SeaVisayan SeaMoro GulfSamar SeaRagay GulfLamon Bay Caranx sexfaciatusSamar SeaBurias PassRagay GulfManila BayLamon Bay
25.630.035.031.029.924.4
13.913.513.6 8.27.9
12.910.211.811.512.110.1
30.228.027.025.725.6
.54.59.76.60.54.71
.69
.64
.66
.33
.42
.61
.31
.46
.36
.74
.78
.38
.55
.45
.53
.58
18
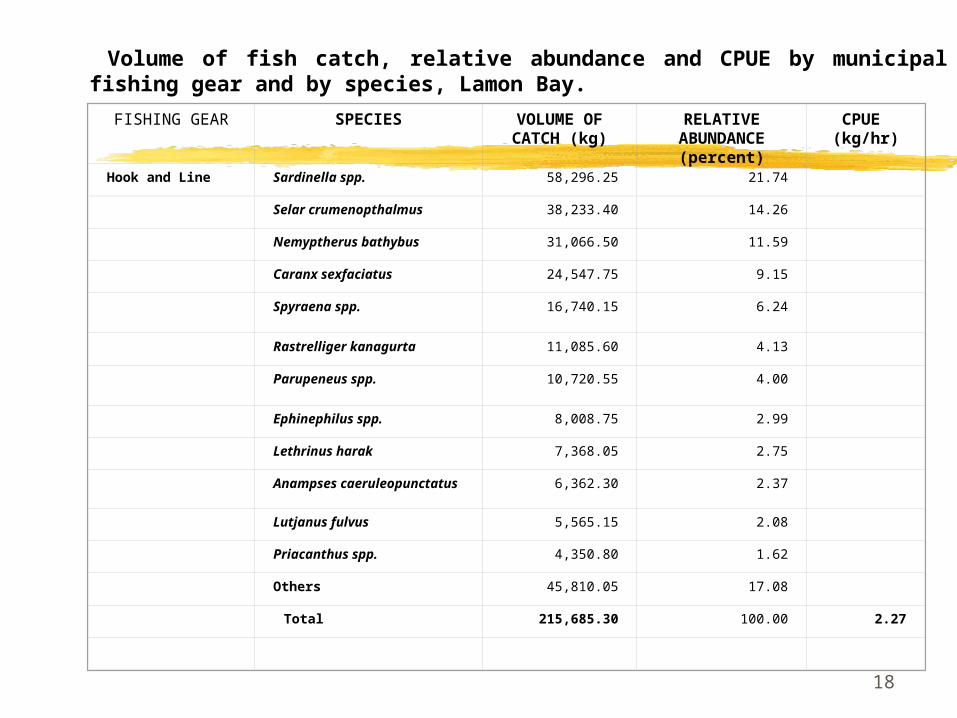
Volume of fish catch, relative abundance and CPUE by municipal fishing gear and by species, Lamon Bay.
FISHING GEAR SPECIES VOLUME OF CATCH (kg)
RELATIVE ABUNDANCE
(percent)
CPUE (kg/hr)
Hook and Line Sardinella spp. 58,296.25 21.74
Selar crumenopthalmus 38,233.40 14.26
Nemyptherus bathybus 31,066.50 11.59
Caranx sexfaciatus 24,547.75 9.15
Spyraena spp. 16,740.15
6.24
Rastrelliger kanagurta 11,085.60 4.13
Parupeneus spp. 10,720.55
4.00
Ephinephilus spp. 8,008.75 2.99
Lethrinus harak 7,368.05 2.75
Anampses caeruleopunctatus 6,362.30 2.37
Lutjanus fulvus 5,565.15 2.08
Priacanthus spp. 4,350.80 1.62
Others 45,810.05 17.08
Total 215,685.30 100.00 2.27
19
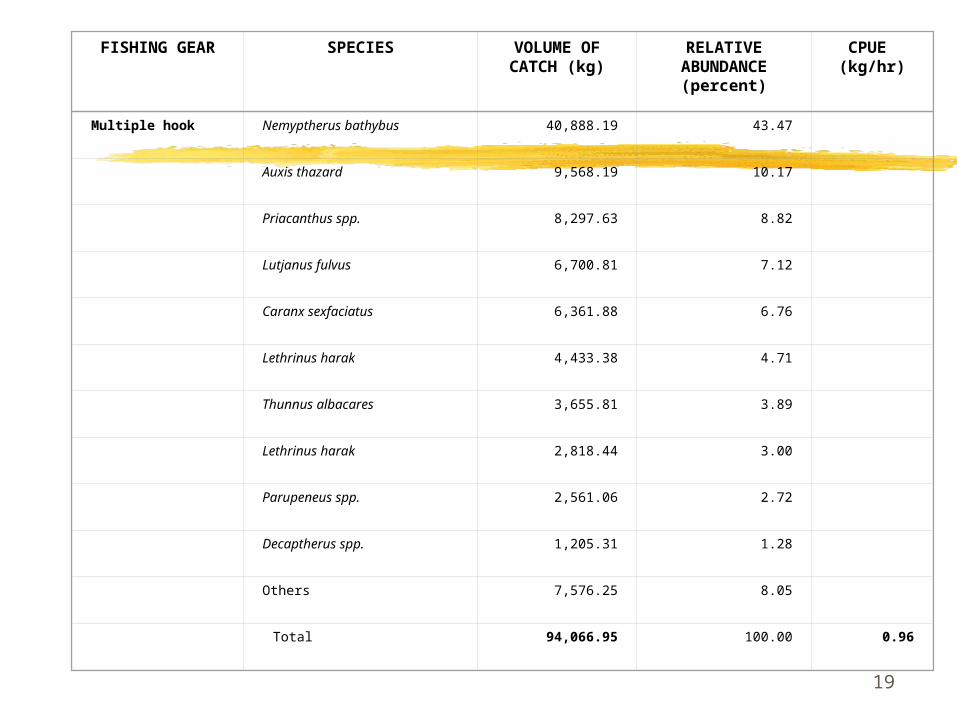
Multiple hook Nemyptherus bathybus 40,888.19 43.47
Auxis thazard 9,568.19 10.17
Priacanthus spp. 8,297.63 8.82
Lutjanus fulvus 6,700.81 7.12
Caranx sexfaciatus 6,361.88 6.76
Lethrinus harak 4,433.38 4.71
Thunnus albacares 3,655.81 3.89
Lethrinus harak 2,818.44 3.00
Parupeneus spp. 2,561.06 2.72
Decaptherus spp. 1,205.31 1.28
Others 7,576.25 8.05
Total 94,066.95 100.00 0.96
FISHING GEAR SPECIES VOLUME OF CATCH (kg)
RELATIVE ABUNDANCE
(percent)
CPUE (kg/hr)

20
Gill net Sardinella spp. 10,828.69 18.14
Stolephorus spp. 7,846.88 13.15
Parupeneus spp. 4,924.13 8.25
Spyraena spp. 4,770.56 7.99
Caranx sexfaciatus 3,673.69 6.16
Leio equulus 3,594.38 6.02
Nucus (squid) 2,975.06 4.98
Siganus caniculatus 2,404.69 4.03
Megalaspis cordyla 2,387.81 4.00
Ablennes hians 2,342.25 3.92
Rastrelliger kanagurta 2,276.44 3.81
Scarus spp. 1,336.5 2.24
Others 10,324.13 17.3
Total 59,685.21 100.00 9.52
ALL 369,437.46
FISHING GEAR SPECIES VOLUME OF CATCH (kg)
RELATIVE ABUNDANCE
(percent)
CPUE (kg/hr)
21
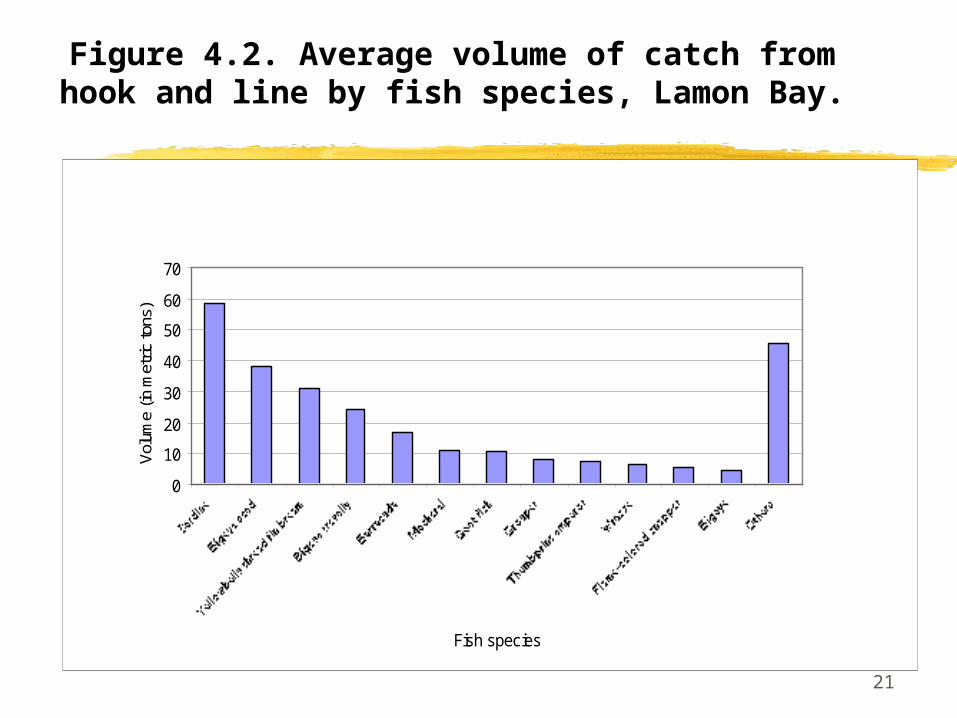
Figure 4.2. Average volume of catch from hook and line by fish species, Lamon Bay.
0
10
20
30
40
50
60
70
Fish species
Vol
ume
(in m
etric
tons
)
22
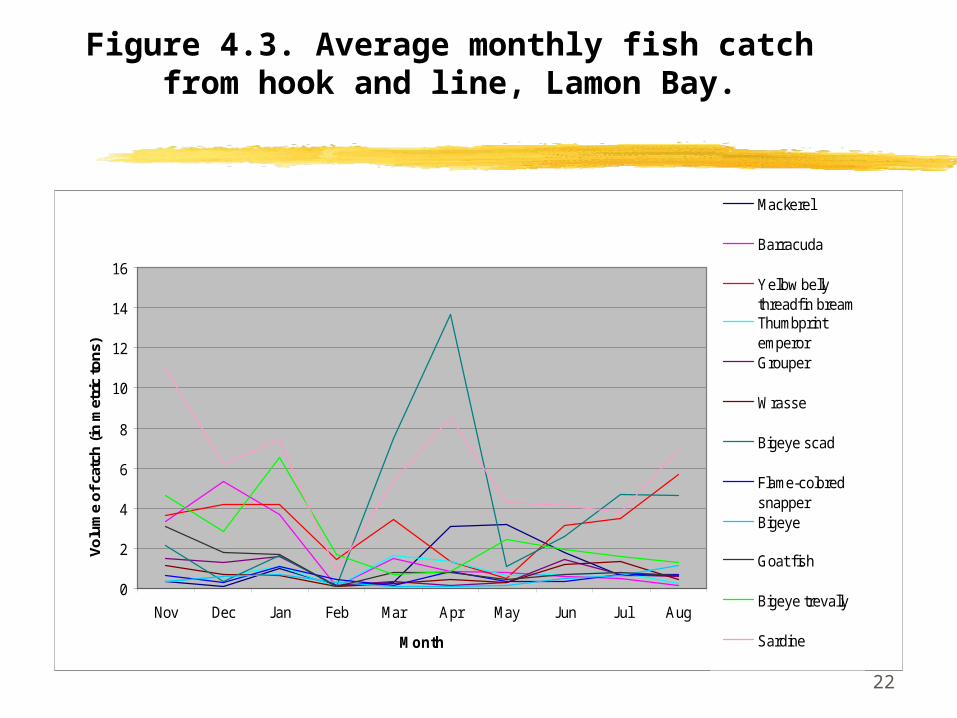
Figure 4.3. Average monthly fish catch from hook and
line, Lamon Bay.
0
2
4
6
8
10
12
14
16
Nov Dec Jan Feb Mar Apr May Jun Jul Aug
Month
Vo
lum
e o
f ca
tch
(in
met
ric
ton
s)
Mackerel
Barracuda
Yellow bellythreadfin breamThumbprintemperorGrouper
Wrasse
Bigeye scad
Flame-coloredsnapperBigeye
Goat f ish
Bigeye trevally
Sardine
23
AVERAGE PRODUCTIVITY
DecliningBFAR statistics show that average productivity
per gill net was 52 kg. in 1965. 1975, these figure dropped to 19 kg. This study revealed that at present the average
productivity per boat during the 10-month monitoring is 4.48 kg.
This shows that the average productivity per boat (gill net) had been declining through the years.
24
Effectivity of policies?
most people surveyed felt that existing policies most people surveyed felt that existing policies
were slightly effectivewere slightly effective
exceptions were those relating to sanctuaries, exceptions were those relating to sanctuaries,
permits & licenses which were perceived as ineffectivepermits & licenses which were perceived as ineffective
84 % respondents operating without fishing 84 % respondents operating without fishing
licenseslicenses
After assessing the declining productivity and After assessing the declining productivity and
resource quality dataresource quality data
Therefore, policy failureTherefore, policy failure
25
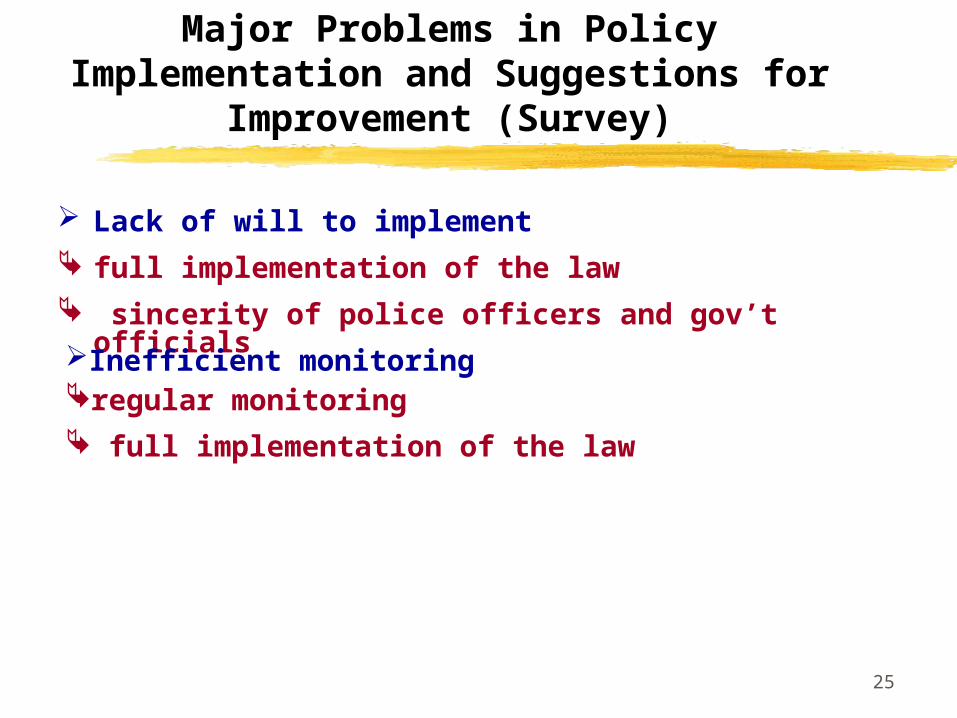
Major Problems in Policy Implementation and Suggestions for Improvement (Survey)
Lack of will to implement
full implementation of the law
sincerity of police officers and gov’t officials
Inefficient monitoringregular monitoring
full implementation of the law
26
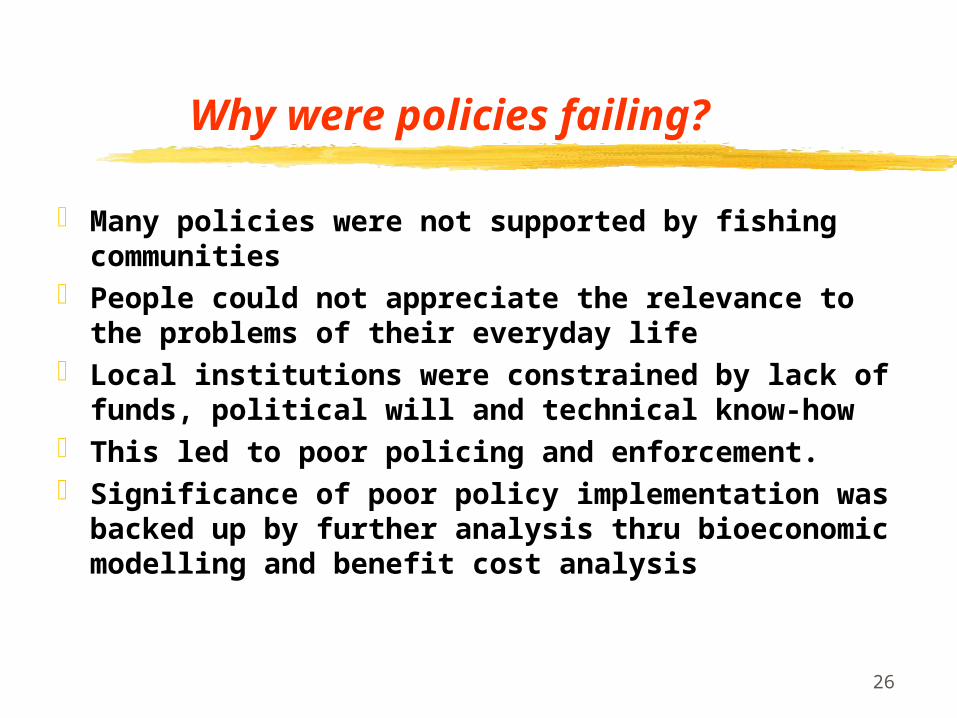
Why were policies failing?
Many policies were not supported by fishing communities
People could not appreciate the relevance to the problems of their everyday life
Local institutions were constrained by lack of funds, political will and technical know-how
This led to poor policing and enforcement. Significance of poor policy implementation
was backed up by further analysis thru bioeconomic modelling and benefit cost analysis
27
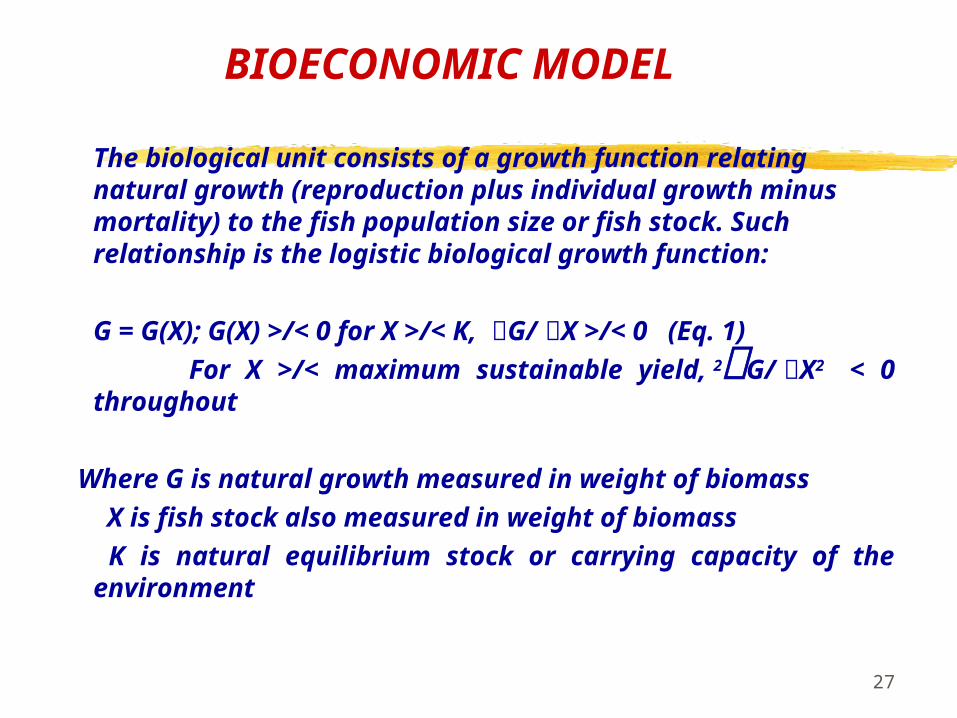
BIOECONOMIC MODEL
The biological unit consists of a growth function relating natural growth (reproduction plus individual growth minus mortality) to the fish population size or fish stock. Such relationship is the logistic biological growth function:
G = G(X); G(X) >/< 0 for X >/< K, لG/لX >/< 0 (Eq. 1)
For X >/< maximum sustainable yield, 2ل G/لX2 < 0 throughout
Where G is natural growth measured in weight of biomass
X is fish stock also measured in weight of biomass
K is natural equilibrium stock or carrying capacity of the environment
28
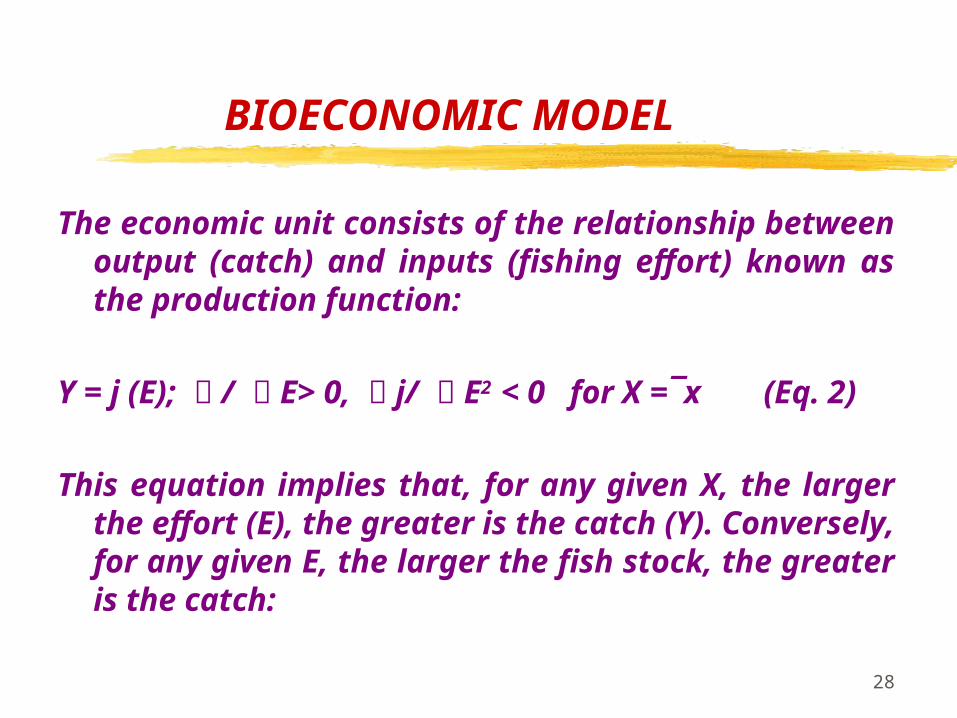
BIOECONOMIC MODEL
The economic unit consists of the relationship between output (catch) and inputs (fishing effort) known as the production function:
Y = j (E); ل / ل E> 0, ل j/ ل E2 < 0 for X =¯x (Eq. 2)
This equation implies that, for any given X, the larger the effort (E), the greater is the catch (Y). Conversely, for any given E, the larger the fish stock, the greater is the catch:
29
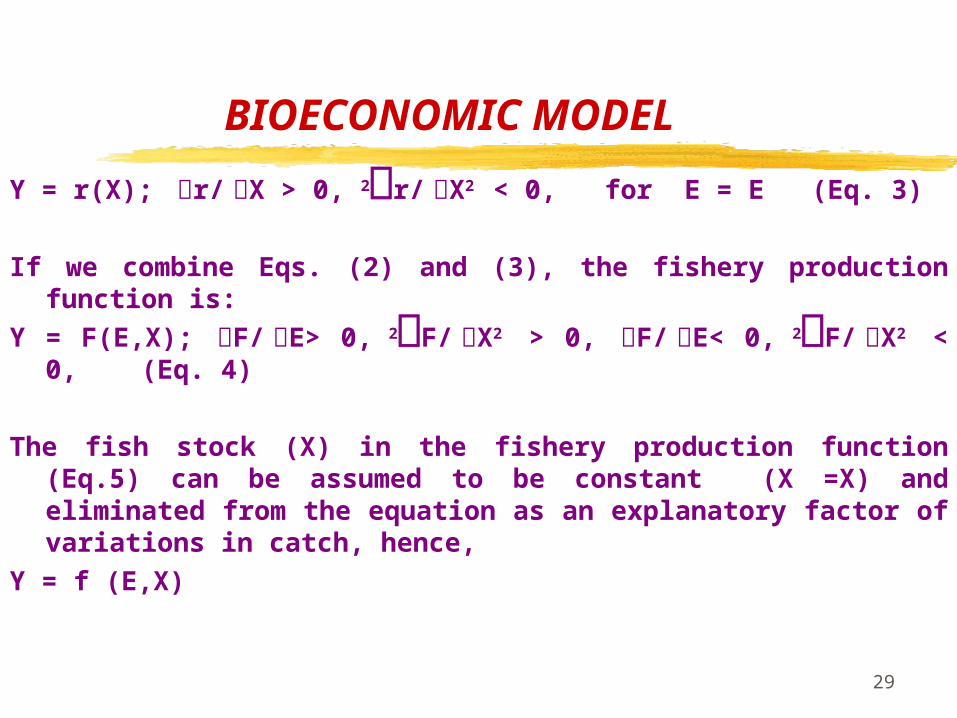
BIOECONOMIC MODEL
Y = r(X); لr/لX > 0, 2ل r/لX2 < 0, for E = E (Eq. 3)
If we combine Eqs. (2) and (3), the fishery production function is:
Y = F(E,X); لF/لE> 0, 2ل F/لX2 > 0, لF/لE< 0, 2ل F/لX2 < 0, (Eq. 4)
The fish stock (X) in the fishery production function (Eq.5) can be assumed to be constant (X =X) and eliminated from the equation as an explanatory factor of variations in catch, hence,
Y = f (E,X)
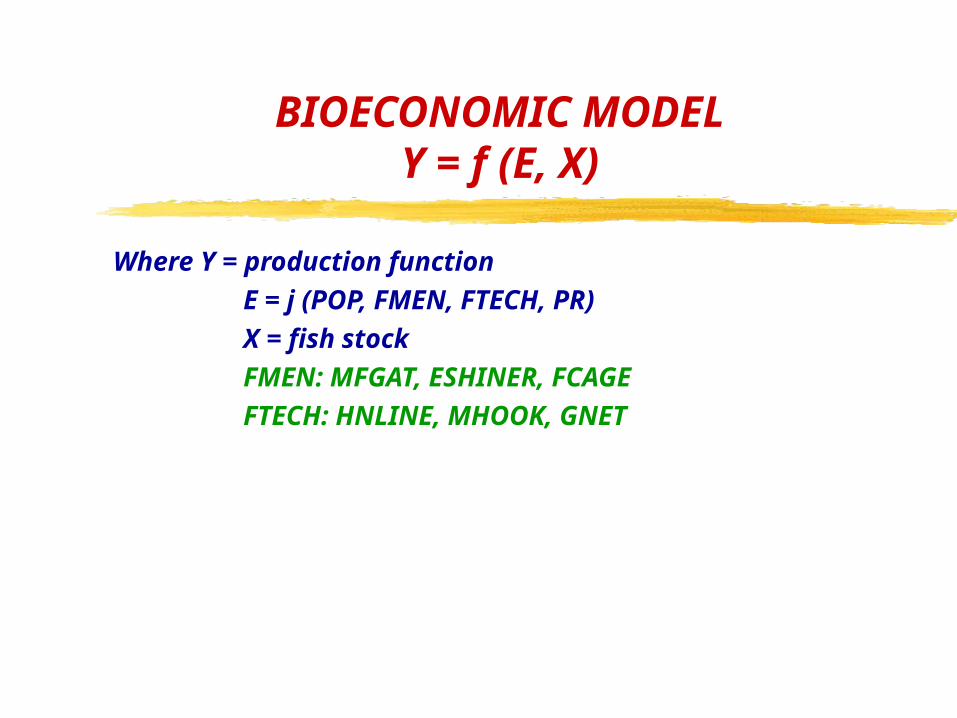
BIOECONOMIC MODELY = f (E, X)
Where Y = production function
E = j (POP, FMEN, FTECH, PR)
X = fish stock
FMEN: MFGAT, ESHINER, FCAGE
FTECH: HNLINE, MHOOK, GNET
31
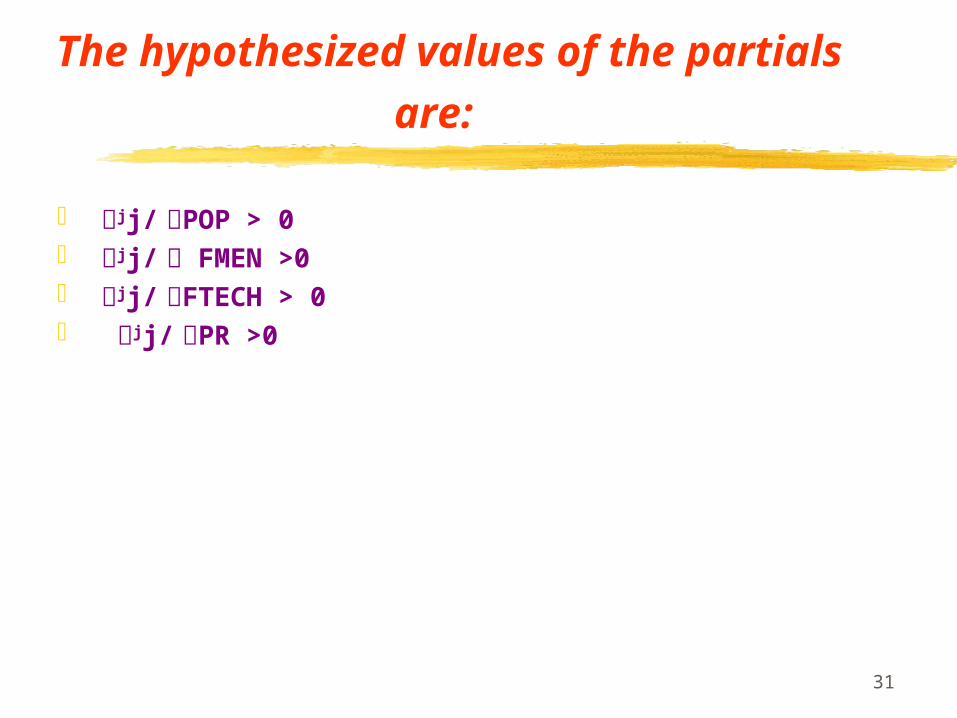
The hypothesized values of the partials are:
POP > 0ل/jjل FMEN >0 ل/jjل FTECH > 0ل/jjل PR >0ل/jjل
32
Assessment of yield equations
33
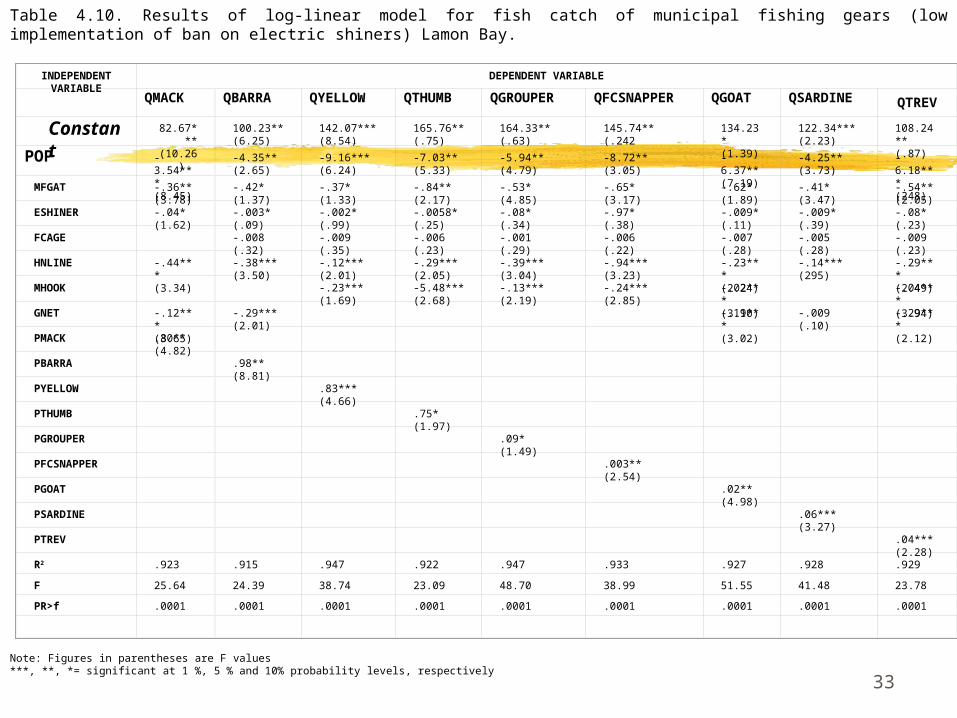
Table 4.10. Results of log-linear model for fish catch of municipal fishing gears (low implementation of ban on electric shiners) Lamon Bay. INDEPENDENT
VARIABLEDEPENDENT VARIABLE
QMACK QBARRA QYELLOW QTHUMB QGROUPER QFCSNAPPER QGOAT QSARDINE QTREV
Constant 82.67***(10.26)
100.23**(6.25)
142.07***(8.54)
165.76**(.75)
164.33**(.63)
145.74**(.242
134.23*(1.39)
122.34***(2.23)
108.24**(.87)
POP -3.54***(8.45)
-4.35**(2.65)
-9.16***(6.24)
-7.03**(5.33)
-5.94**(4.79)
-8.72**(3.05)
-6.37**(7.19)
-4.25**(3.73)
-6.18***(248)
MFGAT -.36**(3.78)
-.42*(1.37)
-.37*(1.33)
-.84**(2.17)
-.53*(4.85)
-.65*(3.17)
-.62*(1.89)
-.41*(3.47)
-.54**(2.05)
ESHINER -.04*(1.62)
-.003*(.09)
-.002*(.99)
-.0058*(.25)
-.08*(.34)
-.97*(.38)
-.009*(.11)
-.009*(.39)
-.08*(.23)
FCAGE -.008(.32)
-.009(.35)
-.006(.23)
-.001(.29)
-.006(.22)
-.007(.28)
-.005(.28)
-.009(.23)
HNLINE -.44***(3.34)
-.38***(3.50)
-.12***(2.01)
-.29***(2.05)
-.39***(3.04)
-.94***(3.23)
-.23***(2.24)
-.14***(295)
-.29***(2.49)
MHOOK -.23***(1.69)
-5.48***(2.68)
-.13***(2.19)
-.24***(2.85)
-.02***(3.10)
-.04***(3.94)
GNET -.12***(3.65)
-.29***(2.01)
-.19***(3.02)
-.009(.10)
-.29***(2.12)
PMACK .80**(4.82)
PBARRA .98**
(8.81)
PYELLOW .83***(4.66)
PTHUMB .75*
(1.97)
PGROUPER .09*(1.49)
PFCSNAPPER .003**
(2.54)
PGOAT .02**(4.98)
PSARDINE .06***
(3.27)
PTREV .04***(2.28)
R2 .923 .915 .947 .922 .947 .933 .927 .928 .929
F 25.64 24.39 38.74 23.09 48.70 38.99 51.55 41.48 23.78
PR>f .0001 .0001 .0001 .0001 .0001 .0001 .0001 .0001 .0001
Note: Figures in parentheses are F values***, **, *= significant at 1 %, 5 % and 10% probability levels, respectively
34
RESULTS OF THE BIOECONOMIC MODEL
R2 are all significant and high, except for milk cages
Combination of regulation of fish cages and banning of electric shiners show very high coefficient of determination, R2 ranging from .829 to .952. The effect of fish cages is also insignificant
35
RESULTS OF THE BIOECONOMIC MODEL
An increase in the level of fishing effort did not increase yield in all fishing gears but instead resulted in a decline in fish catch
Marginal product is negative. An additional unit of fishing boat will decrease the fish catch of the rest
Decreasing average fish catch per boat
36
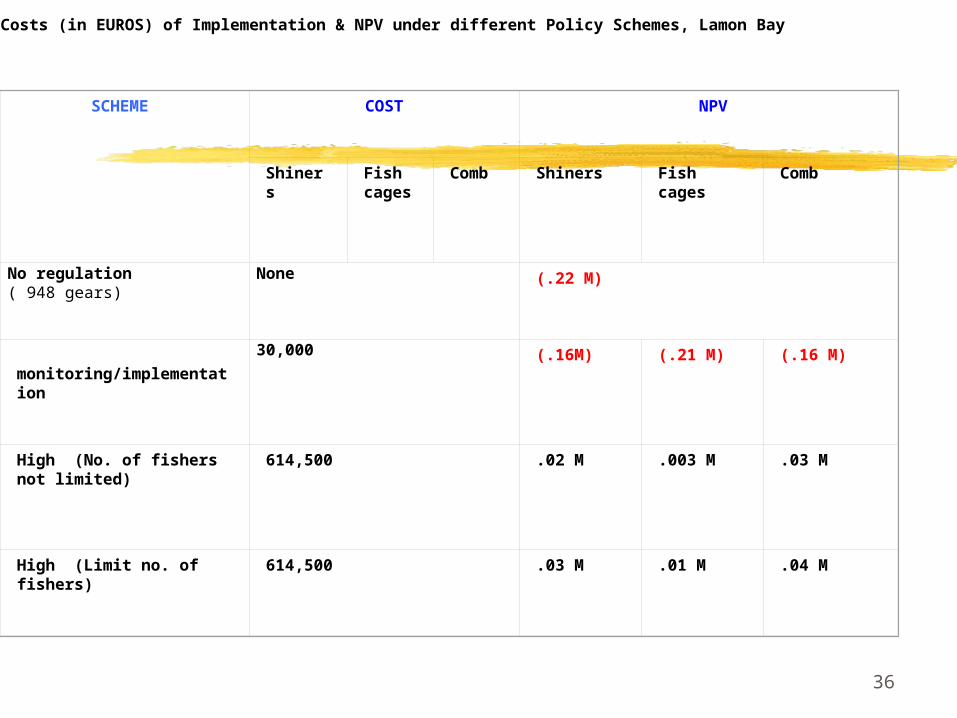
Costs (in EUROS) of Implementation & NPV under different Policy Schemes, Lamon Bay
SCHEME COST NPV
Shiners
Fish cages
Comb Shiners
Fish cages
Comb
No regulation( 948 gears)
None (.22 M)
monitoring/implementation
30,000
(.16M)
(.21 M)
(.16 M)
High (No. of fishers not limited)
614,500 .02 M
.003 M .03 M
High (Limit no. of fishers)
614,500 .03 M .01 M .04 M
37
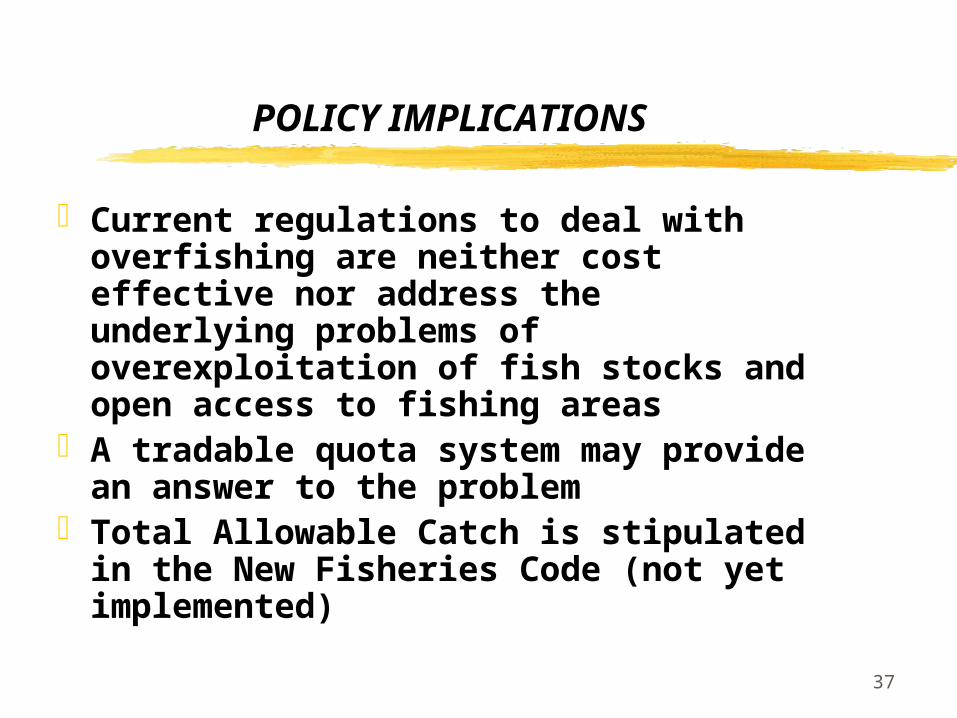
POLICY IMPLICATIONS
Current regulations to deal with overfishing are neither cost effective nor address the underlying problems of overexploitation of fish stocks and open access to fishing areas
A tradable quota system may provide an answer to the problem
Total Allowable Catch is stipulated in the New Fisheries Code (not yet implemented)
38
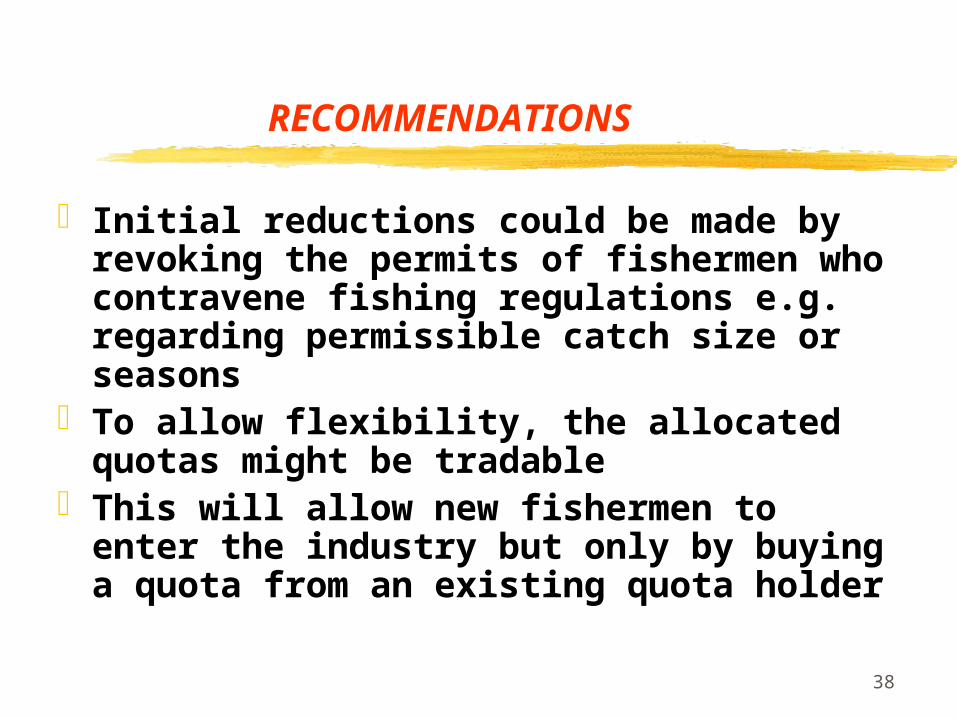
RECOMMENDATIONS
Initial reductions could be made by revoking the permits of fishermen who contravene fishing regulations e.g. regarding permissible catch size or seasons
To allow flexibility, the allocated quotas might be tradable
This will allow new fishermen to enter the industry but only by buying a quota from an existing quota holder
39
RECOMMENDATIONS
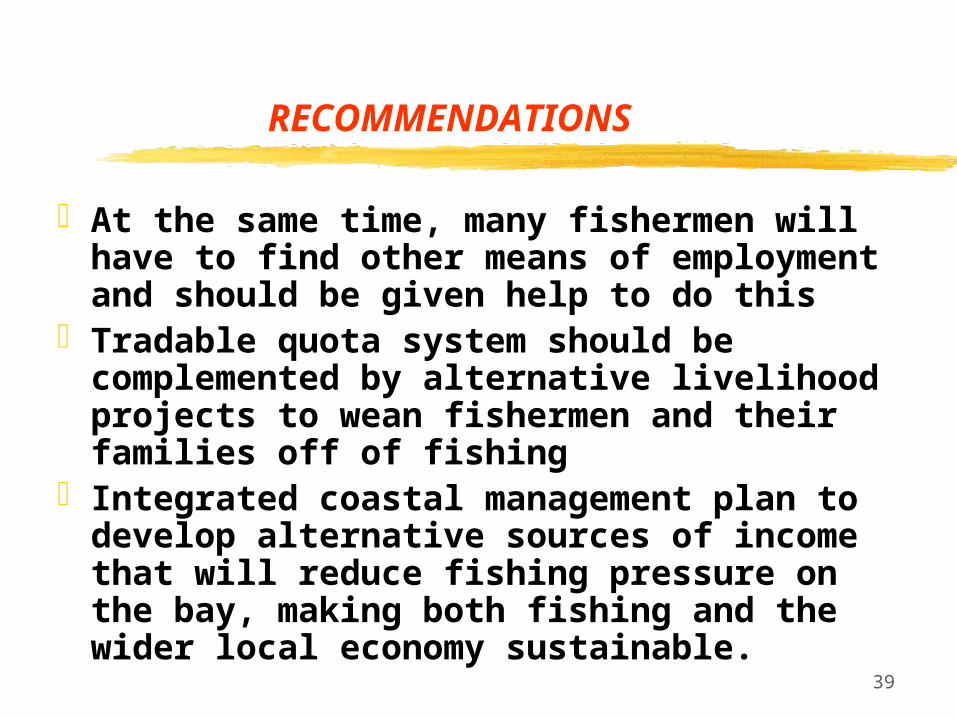
At the same time, many fishermen will have to find other means of employment and should be given help to do this
Tradable quota system should be complemented by alternative livelihood projects to wean fishermen and their families off of fishing
Integrated coastal management plan to develop alternative sources of income that will reduce fishing pressure on the bay, making both fishing and the wider local economy sustainable.