Embed Size (px)
Citation preview

1
Indirect Adaptive Routing on Large Scale Interconnection Networks
Nan Jiang, William J. Dally
Computer System Laboratory
Stanford University
John Kim
Korean Advanced Institute of Science and
Technology

2
Overview
• Indirect adaptive routing (IAR)– Allow adaptive routing decision to be based on local and
remote congestion information
• Main contributions– Three new IAR algorithms for large scale networks– Steady state and transient performance evaluations– Impact of network configurations– Cost of implementation

3
Presentation Outline
• Background– The dragonfly network– Adaptive routing
• Indirect adaptive routing algorithms• Performance results • Implementation considerations

4
Group 1Group 0 Group 2 …
Global Network
…
… …
Local Network
Router 1 Router 2
The Dragonfly Network
• High Radix Network– High radix routers– Small network diameter
• Each router– Three types of channels– Directly connected to a few
other groups• Each group
– Organized by a local network – Large number of global
channels (GC)• Large network with a global
diameter of one
Router 0p0
p1
…
5
Routing on the Dragonfly
• Minimal Routing (MIN)1. Source local network2. Global network3. Destination local network
• Some Adversarial traffic congests the global channels– Each group i sends all packets
to group i+1
• Oblivious solution: Valiant’s Algorithm (VAL)– Poor performance on benign
traffic
Router 0
Group 1Group 0
…
Group 2 …
p0
p1
…
… …
Router 1 Router 2Congestion

6
Adaptive Routing
• Choose between the MIN path and a VAL path at the packet source [Singh'05]– Decision metric: path delay– Delay: product of path distance
and path queue depth
• Measuring path queue length is unrealistic
• Use local queues length to approximate path– Require stiff backpressure
SourceRouter
q0 q1
q2 q3
MIN GC
VALGC
Congestion

7
Adaptive Routing: Worst Case Traffic
0 0.1 0.2 0.3 0.4 0.5100
150
200
250
300
350
400
450
Throughput (Flit Injection Rate)
Pac
ket L
aten
cy (
Sim
ulat
ion
cycl
es)
Valiant’sMinimalAdaptive

8
Indirect Adaptive Routing
• Improve routing decision through remote congestion information
• Previous method: – Credit round trip [Kim et. al ISCA’08]
• Three new methods:– Reservation – Piggyback– Progressive

9
Credit Round Trip (CRT)
• Delay the return of local credits to the congested router
• Creates the illusion of stiffer backpressure
• Drawbacks– Remote congestion is still
inferred through local queues
– Information not up to date SourceRouter
Congestion
DelayedCredits
Credits
MIN GC
VALGC
[Kim et. al ISCA’08]

10
Reservation (RES)
• Each global channel track the number of incoming MIN packets
• Injected packets creates a reservation flit
• Routing decision based on the reservation outcome
• Drawbacks– Reservation flit flooding– Reservation delay
SourceRouter
Congestion
RESFlit
RESFailed
MIN GC
VALGC

11
Piggyback (PB)
• Local congestion broadcast– Piggybacking on each
packet– Send on idle channels
• Congestion data compression
• Drawbacks– Consumes extra
bandwidth– Congestion information
not up to date (broadcast delay)
SourceRouter
Congestion
GCBusy
GCFree
MIN GC
VALGC

12
Progressive (PAR)
• MIN routing decisions at the source are not final
• VAL decisions are final• Switch to VAL when
encountering congestion
• Draw backs– Need an additional virtual
channel to avoid deadlock– Add extra hops
SourceRouter
Congestion
MIN GC
VALGC

13
Experimental Setup
• Fully connected local and global networks– 33 groups– 1,056 nodes
• 10 cycle local channel latency• 100 cycle global channel latency• 10-flit packets

14
Steady State Traffic: Uniform Random
0 0.1 0.2 0.3 0.4 0.5 0.6 0.7 0.8 0.9100
120
140
160
180
200
220
240
260
280
300
Throughput (Flit Injection Rate)
Pa
cke
t L
ate
ncy
(S
imu
latio
n c
ycle
s)
PiggybackCredit Round TripProgressiveReservationMinimal

15
Steady State Traffic: Worst Case
0 0.1 0.2 0.3 0.4 0.5100
150
200
250
300
350
400
450
Throughput (Flit Injection Rate)
Pa
cke
t L
ate
ncy
(S
imu
latio
n c
ycle
s)
PiggybackCredit Round TripProgressiveReservationValiant’s

16
Transient Traffic: Uniform Random to Worst Case
0 20 40 60 80 100100
200
300
400
500
Cycles After Transition
Pa
cke
t L
ate
ncy
Average Packet Latency per Cycle - UR to WC
ProgressivePiggyback
0 20 40 60 80 1000
50
100
Cycles After Transition% o
f P
ack
ets
Ro
utin
g N
on
min
ima
lly
% Packets Routing Non-minimally per Cycle - UR to WC
ProgressivePiggyback

17
Network Configuration Considerations
• Packet size– RES requires long packets to amortize reservation flit cost– Routing decision is done on per packet basis
• Channel latency– Affects information delay (CRT, PB)– Affects packet delay (PAR, RES)
• Network size– Affects information bandwidth overhead (RES, PB)
• Global diameter greater than one– Need to exchange congestion information on the global
network

18
Cost Considerations
• Credit round trip– Credit delay tracker for every local channel
• Reservation– Reservation counter for every global channel– Additional buffering at the injection port to store packets
waiting for reservation
• Piggyback– Global channel lookup table for every router– Increase in packet size
• Progressive– Extra virtual channel for deadlock avoidance

19
Conclusion
• Three new indirect adaptive routing algorithms for large scale networks
• Performance and design evaluation of the algorithms
• Best Algorithm?– Piggyback performed the best under steady state traffic– Progressive responded fastest to transient changes
– Network configurations will affect some algorithm performance– Cost of implementation

20
Thank You!
•Questions?

21
Adaptive Routing: Uniform Traffic
0 0.1 0.2 0.3 0.4 0.5 0.6 0.7 0.8 0.9100
120
140
160
180
200
220
240
260
280
300
Throughput - Flit Injection Rate
Pac
ket
Lat
ency
- S
imul
atio
n cy
cle
s
VALMINAdaptive
22
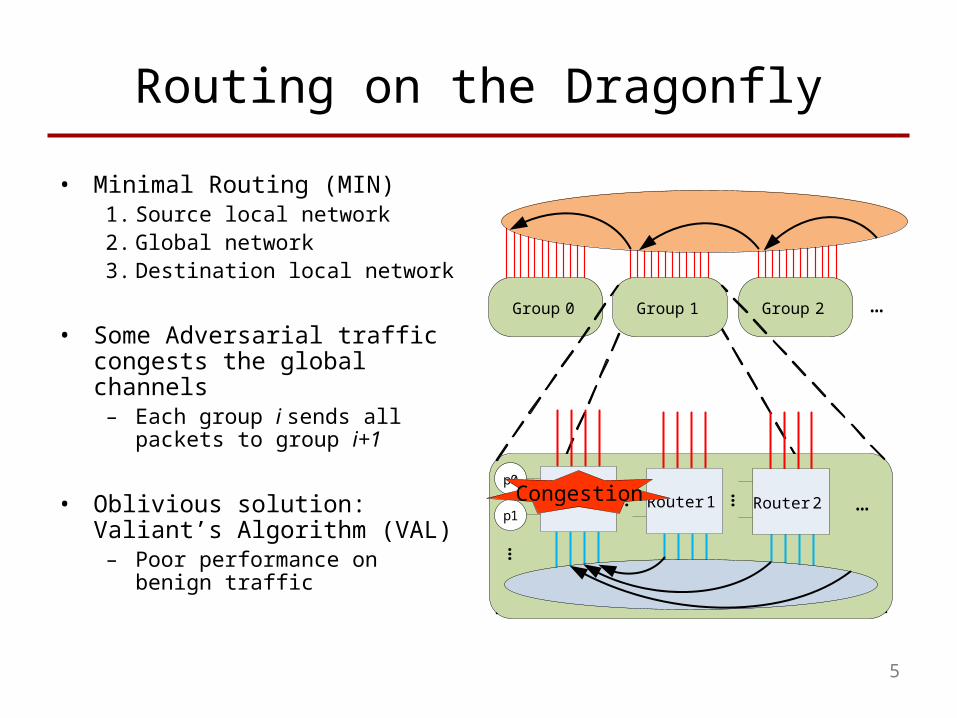
Transient Traffic: Worst Case to Uniform Random
0 20 40 60 80 100150
200
250
300
350
Cycles After Transition
Pa
cke
t La
ten
cyAverage Packet Latency per Cycle - WC to UR
PARPB
0 20 40 60 80 1000
50
100
Cycles After Transition
% o
f Pa
cke
ts R
ou
ting
No
nm
inim
ally
% Packets Routing Non-minimally per Cycle - WC to UR
PARPB

23
Transient Traffic: Worst Case 1 to Worst Case 10
0 20 40 60 80 100200
300
400
500
Cycles After Transition
Pa
cke
t La
ten
cyAverage Packet Latency per Cycle - WC1 to WC10
PARPB
0 20 40 60 80 1000
50
100
Cycles After Transition
% o
f Pa
cke
ts R
ou
ting
No
nm
inim
ally
% Packets Routing Non-minimally per Cycle - WC1 to WC10
PARPB

24
1000 Random Permutation Traffic
200 3000
5
10
15
20
25
30PB
Packet Latency
% o
f 1K
Per
mut
atio
ns
200 3000
5
10
15
20
25
30CRT
Packet Latency%
of
1K P
erm
utat
ions
200 3000
5
10
15
20
25
30PAR
Packet Latency
% o
f 1K
Per
mut
atio
ns
200 3000
5
10
15
20
25
30RES
Packet Latency
% o
f 1K
Per
mut
atio
ns
200 3000
5
10
15
20
25
30VAL
Packet Latency
% o
f 1K
Per
mut
atio
ns

25
Effect of Packet size on RES: Worst Case Traffic
0 0.1 0.2 0.3 0.4 0.50
50
100
150
200
250
300
350
400
450
500
550
Throughput - Flit Injection Rate
Late
ncy
- S
imul
atio
n cy
cles
1 Flit2 Flits4 Flits8 Flits

26
Large local network: Uniform Random
0 0.1 0.2 0.3 0.4 0.5 0.6 0.7 0.8 0.90
50
100
150
200
250
300
350
400
Throughput - Flit Injection Rate
Pac
ket
Lat
ency
- S
imul
atio
n cy
cle
s
PBCRTMINPARRES
27
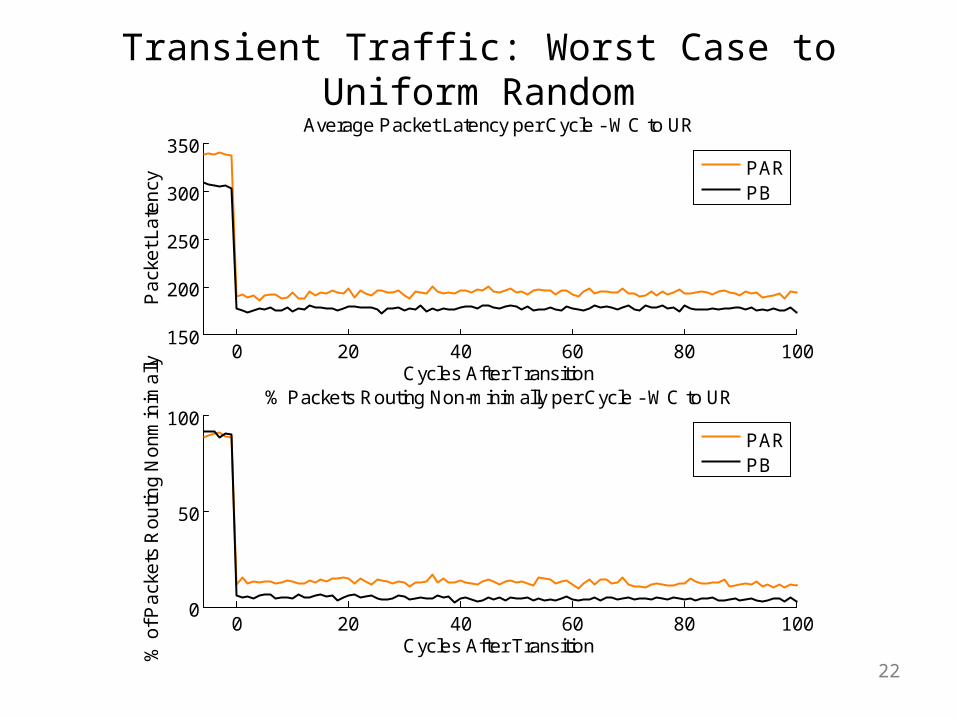
Large local network: Worst Case
0 0.1 0.2 0.3 0.4 0.50
100
200
300
400
500
600
Throughput - Flit Injection Rate
Pac
ket
Lat
ency
- S
imul
atio
n cy
cle
s
PBCRTPARRESVAL