Embed Size (px)
Citation preview
1
Instructional Practices Task Group
Chicago Meeting
Progress Report
April 20, 2007

2
Instructional Practices Task Group
Task Group Members
•Russell Gersten•Camilla Benbow •Douglas Clements •Bert Fristedt •Tom Loveless •Vern Williams •Joan Ferrini-Mundy, Ex Officio •Diane Jones, Ex Officio
3
Instructional Practices Task Group
Framing of the Methodology Used and
the First Three Research Topics
4
Instructional Practices Task Group
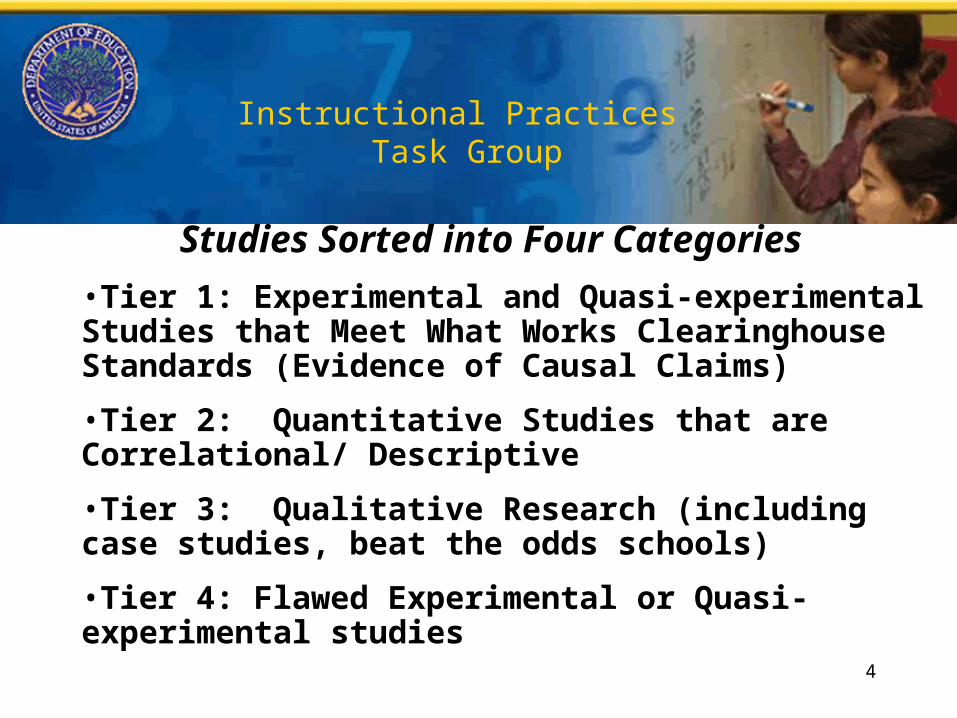
Studies Sorted into Four Categories
•Tier 1: Experimental and Quasi-experimental Studies that Meet What Works Clearinghouse Standards (Evidence of Causal Claims)
•Tier 2: Quantitative Studies that are Correlational/ Descriptive
•Tier 3: Qualitative Research (including case studies, beat the odds schools)
•Tier 4: Flawed Experimental or Quasi-experimental studies
5
Instructional Practices Task Group
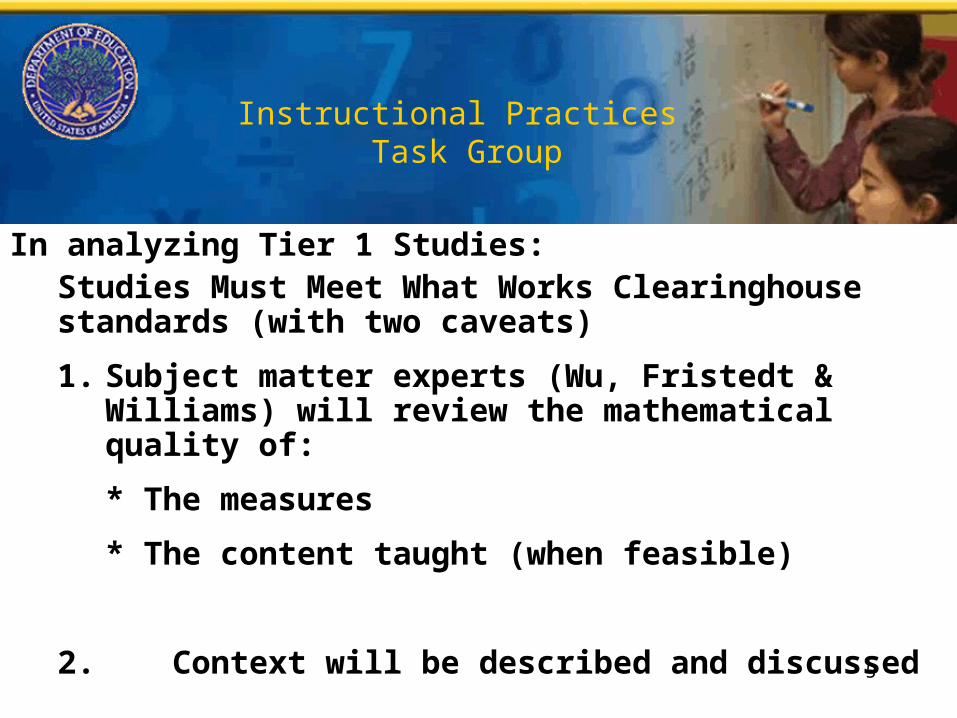
In analyzing Tier 1 Studies:Studies Must Meet What Works Clearinghouse standards (with two caveats)
1. Subject matter experts (Wu, Fristedt & Williams) will review the mathematical quality of:
* The measures
* The content taught (when feasible)
2. Context will be described and discussed
6
Instructional Practices Task Group
Role of Tier 2 and Tier 3 Studies
–Will Help Frame Research Questions and Issues
–Assist in Interpreting Findings from Experimental Research
7
Instructional Practices Task Group
Student and Teacher Centered Instruction
Part I:
Research on Cooperative and
Peer Assisted Learning
8
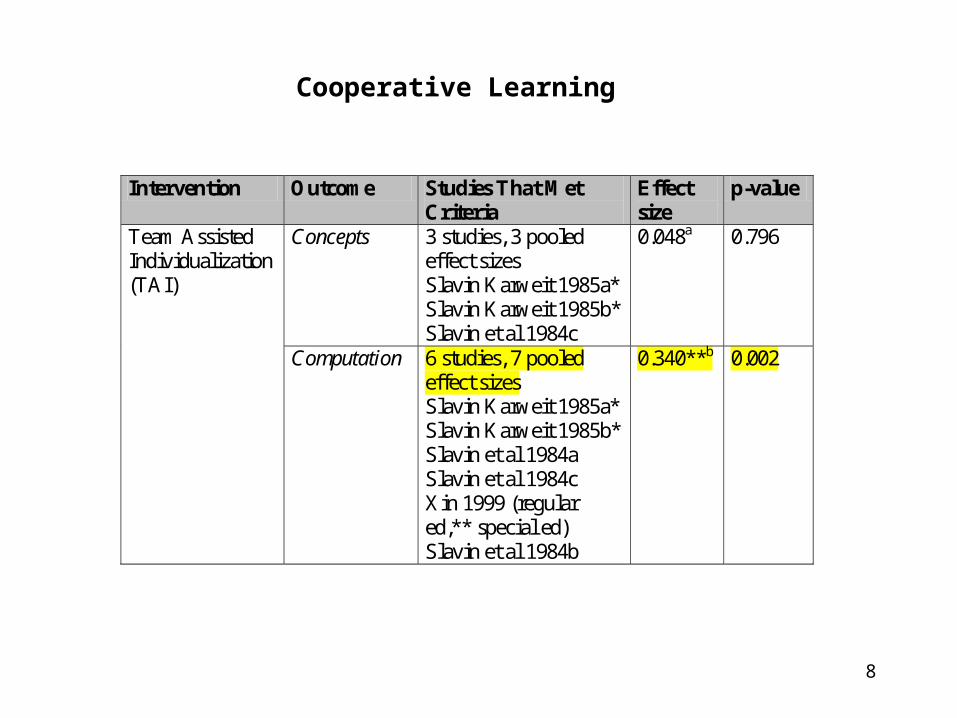
Intervention Outcome Studies That Met Criteria
Effect size
p-value
Concepts 3 studies, 3 pooled effect sizes Slavin Karweit 1985a* Slavin Karweit 1985b* Slavin et al 1984c
0.048a 0.796 Team Assisted Individualization (TAI)
Computation 6 studies, 7 pooled effect sizes Slavin Karweit 1985a* Slavin Karweit 1985b* Slavin et al 1984a Slavin et al 1984c Xin 1999 (regular ed,** special ed) Slavin et al 1984b
0.340**b 0.002
Cooperative Learning
9
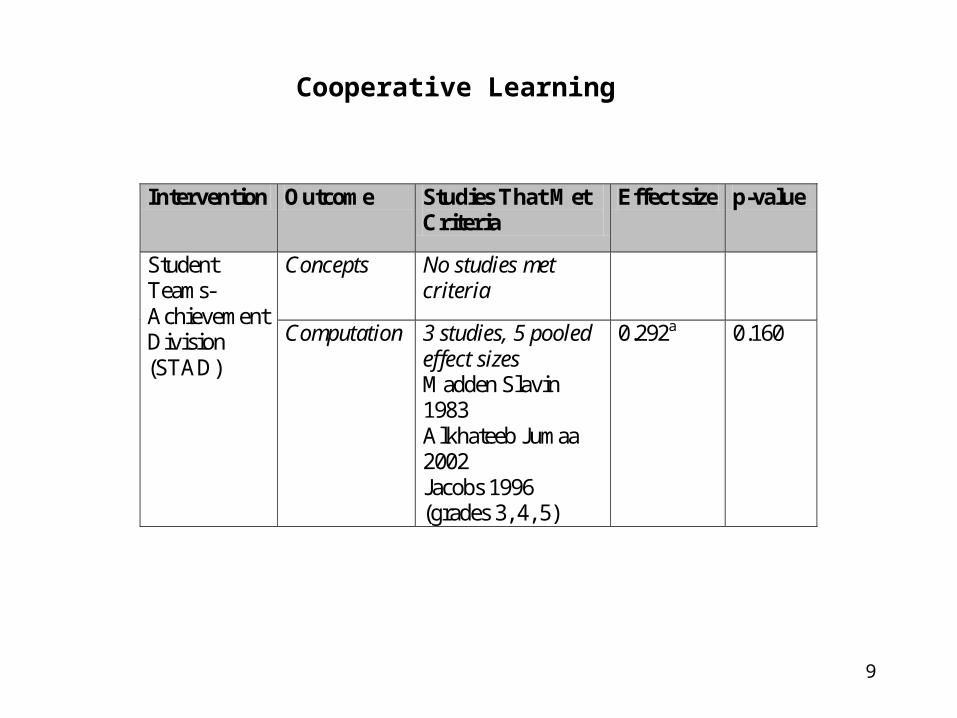
Intervention Outcome Studies That Met Criteria
Effect size p-value
Concepts No studies met criteria
Student Teams-Achievement Division (STAD)
Computation 3 studies, 5 pooled effect sizes Madden Slavin 1983 Alkhateeb Jumaa 2002 Jacobs 1996 (grades 3, 4, 5)
0.292a 0.160
Cooperative Learning
10
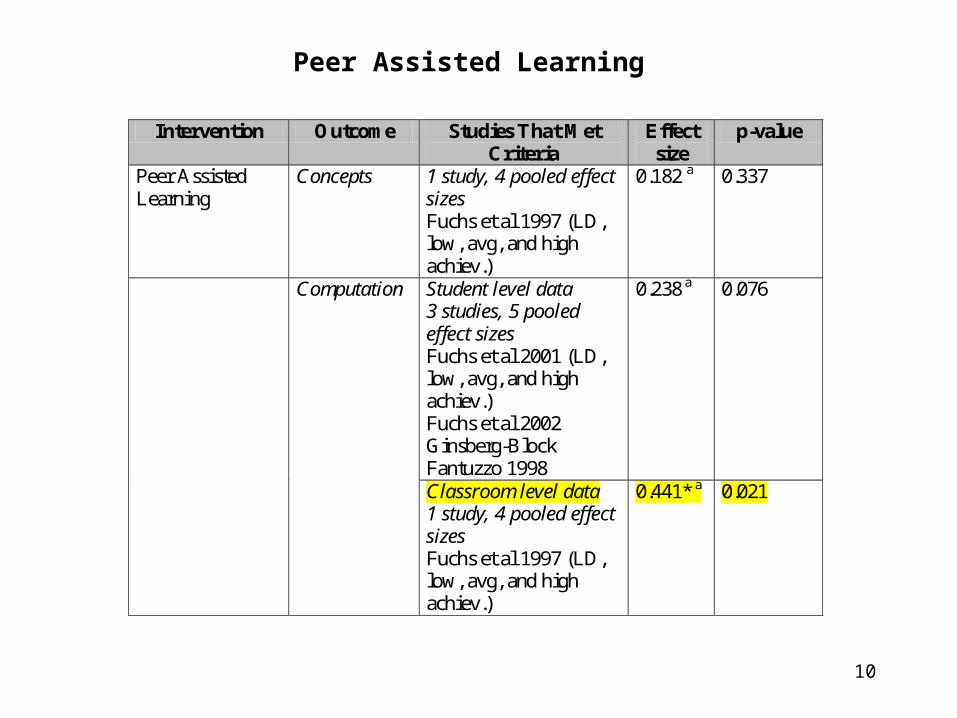
Intervention Outcome Studies That Met Criteria
Effect size
p-value
Peer Assisted Learning
Concepts 1 study, 4 pooled effect sizes Fuchs et al 1997 (LD, low, avg, and high achiev.)
0.182 a 0.337
Student level data 3 studies, 5 pooled effect sizes Fuchs et al 2001 (LD, low, avg, and high achiev.) Fuchs et al 2002 Ginsberg-Block Fantuzzo 1998
0.238 a 0.076
Computation
Classroom level data 1 study, 4 pooled effect sizes Fuchs et al 1997 (LD, low, avg, and high achiev.)
0.441* a 0.021
Peer Assisted Learning
11
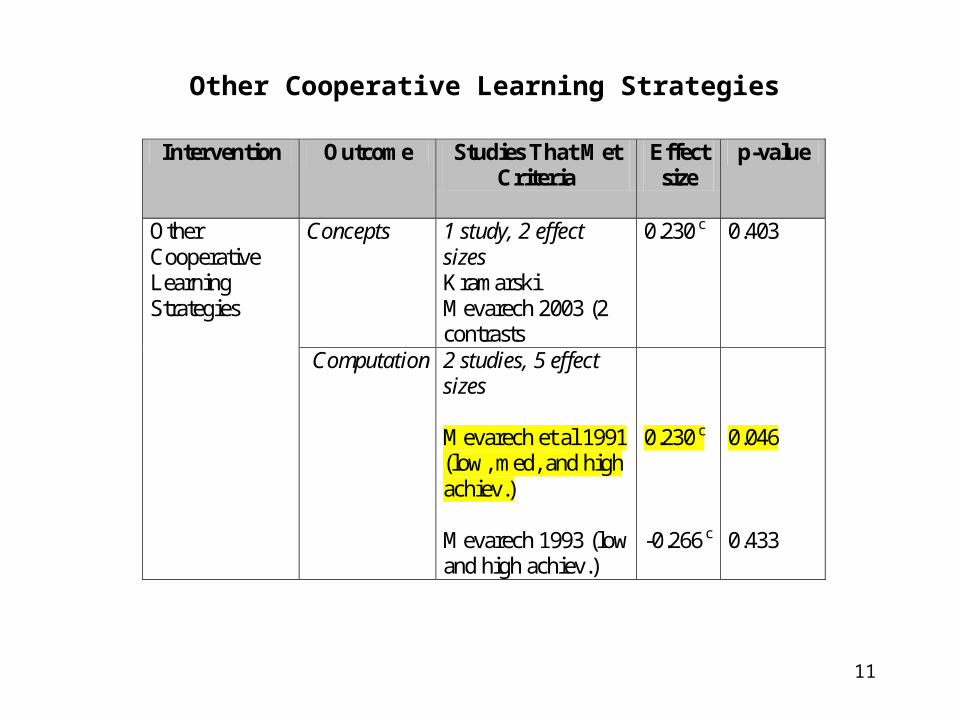
Intervention Outcome Studies That Met Criteria
Effect size
p-value
Concepts 1 study, 2 effect sizes Kramarski Mevarech 2003 (2 contrasts
0.230 c 0.403 Other Cooperative Learning Strategies
Computation 2 studies, 5 effect sizes Mevarech et al 1991 (low, med, and high achiev.)
Mevarech 1993 (low and high achiev.)
0.230 c
-0.266 c
0.046 0.433
Other Cooperative Learning Strategies
12
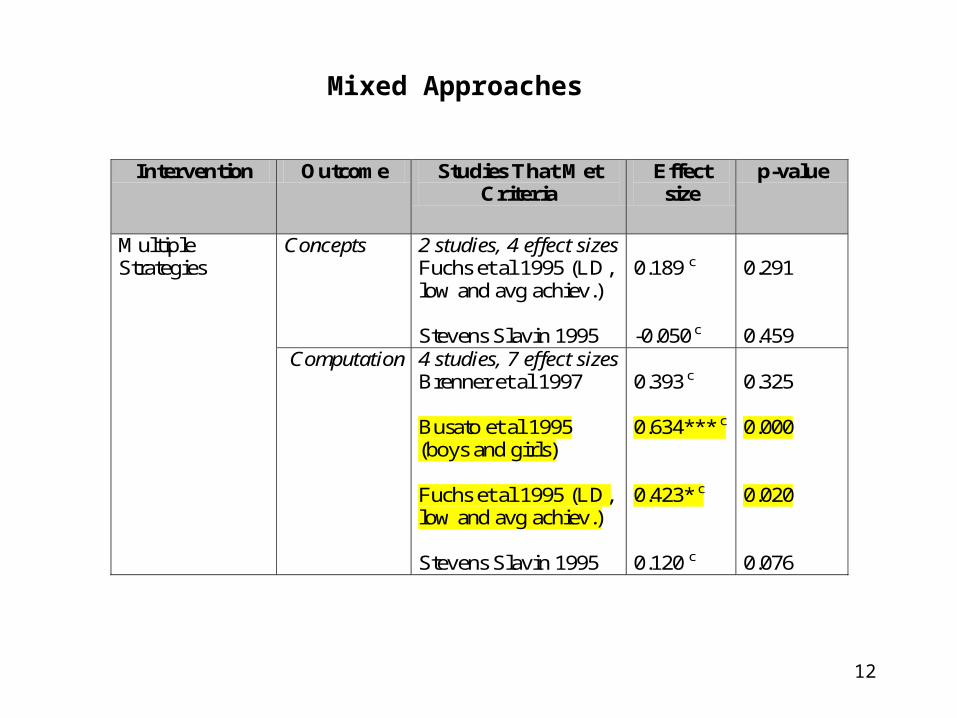
Intervention Outcome Studies That Met Criteria
Effect size
p-value
Concepts 2 studies, 4 effect sizes Fuchs et al 1995 (LD, low and avg achiev.)
Stevens Slavin 1995
0.189 c
-0.050 c
0.291 0.459
Multiple Strategies
Computation 4 studies, 7 effect sizes Brenner et al 1997
Busato et al 1995 (boys and girls)
Fuchs et al 1995 (LD, low and avg achiev.)
Stevens Slavin 1995
0.393 c
0.634*** c
0.423* c
0.120 c
0.325 0.000 0.020 0.076
Mixed Approaches
13
Instructional Practices Task Group
A. Formative Assessment• Focus on studies that examine the following questions:• Does use of formative assessments in mathematics
improve students’ growth in mathematics proficiency?• Are there tools or enhancements that help teachers use
this type of data? If so, do they improve students’ growth in mathematics proficiency
14
Instructional Practices Task Group
B. Data Sources • Ten experimental and quasi-experimental studies
Elementary grades Outcomes include both procedural and problem
solving/conceptual measures of reasonable reliability and criterion-related validity
Content validity is under review at current time
15
Instructional Practices Task Group
C. Type of Formative Assessments Studied•Sample from state standards•Measures are brief and include a random selection of items from the years’ scope and sequence•This approach is more reliable and valid than a sampling of only one week’s material•This is the only body of research that has been studied experimentally•Other approaches may have equal effect; they simply have not been studied systematically
16
Instructional Practices Task Group
D. Findings: Question 1•Yes, use of formative assessments by teachers (and often students) significantly enhances students’ growth in math proficiency.
•Result is statistically significant
•Average effect size is small and corresponds to about a nine percentile point growth, on average
17
Instructional Practices Task Group
E: Findings Question 2Effect is almost doubled when the various enhancements are added.
•But, most of these studies include only special education students.
•Thus, it is unclear if the results will work as well for non-disabled students.
•Remember that almost 10% of the student population currently fits into the learning disabilities category.
18
Instructional Practices Task Group
F. What are the Enhancements?1. Using formative assessment data as basis for peer tutoring activities.2. Providing teachers with an analysis of areas of strength and weakness for individual students and areas of weakness for the class.3. Providing teachers with specific instructional ideas and approaches to address the identified problem.4. Teaching students to monitor their own progress and interpret the graphs of their progress.
19
Instructional Practices Task Group
“Real-World” Problem Solving
/…..
20
Instructional Practices Task Group
Fundamental Question:
What is the impact of instructional approaches that feature the use of “real-world” problems on student learning and achievement?
21
Instructional Practices Task Group
• “Real-world” problems have been a feature (in various forms and with differing levels of emphasis) in US mathematics curriculum for a century
• Many current policy documents call for the use of “real-world” problems in mathematics instruction, and this is reflected in some instructional materials
22
Instructional Practices Task Group
Varied Meanings of “Real-World” Problems in the Literature, e.g.:
• problems that will be meaningful, appealing, and motivating for students (from contexts that they know, from imaginary situations, from mathematics)
• authentic problems, similar to those in applications beyond school
• complex problems with multiple steps, integration of concepts
• “open-ended” problems
23
Instructional Practices Task Group
There are many arguments, based in beliefs, experience, and research, both for and against the use of “real world” problems in mathematics instruction.
24
Instructional Practices Task Group
Examining 12 studies thus far:
• 3 quasi-experimental studies that have examined the impact of specific curricula, all with methodological problems
• 9 other studies that look at the impact of various types of instruction using “real-world” problems, and/or instructional strategies to help students solve real-world, again with methodological problems