Embed Size (px)
Citation preview
1
Intergovernmental Fiscal Review
Presentation to Select Committees of Finance, Social Services, Education and
Recreation17 October 2007
DEPARTMENT OF EDUCATION
2
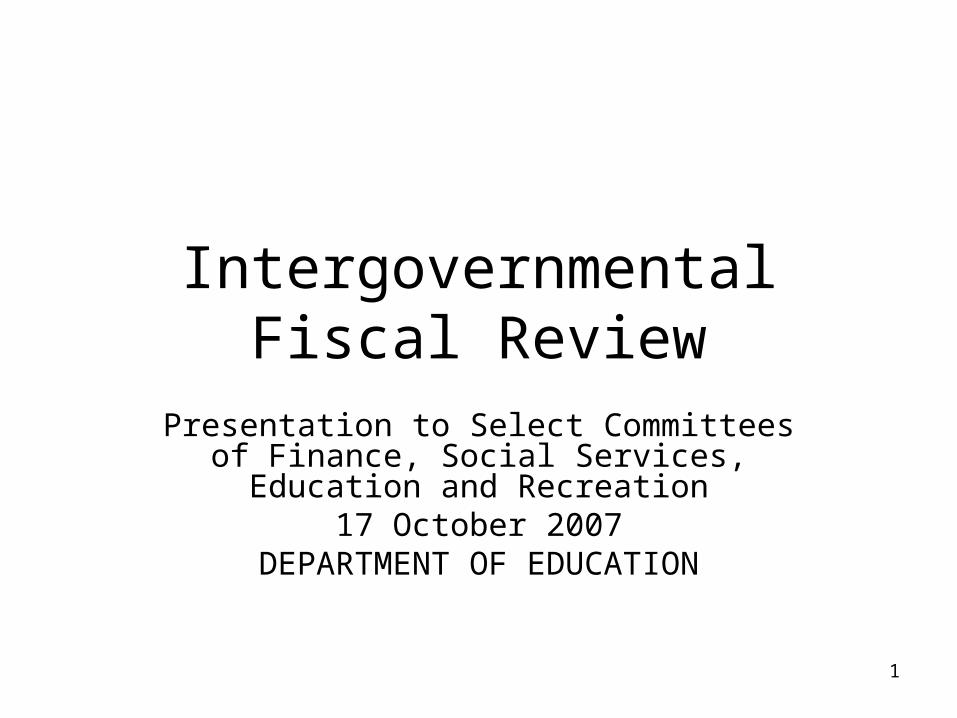
IGRF
• This comprehensive review for the period 2003/4 to 2009/10 of the fiscal situation on provinces welcomed.
• The review is very clear and succinct and does accurately reflect the situation.
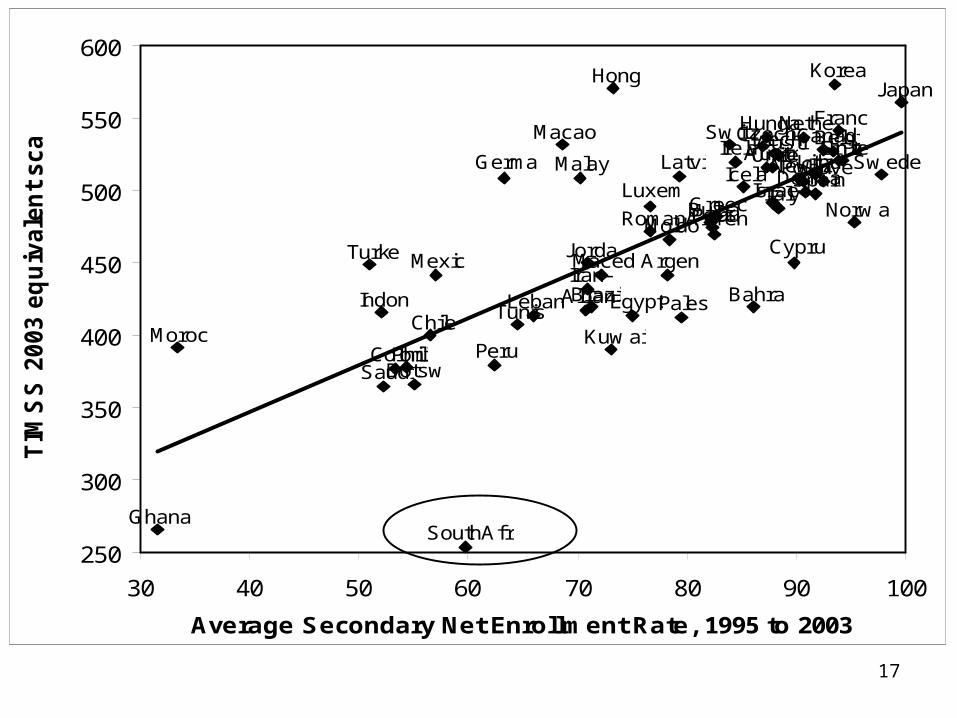
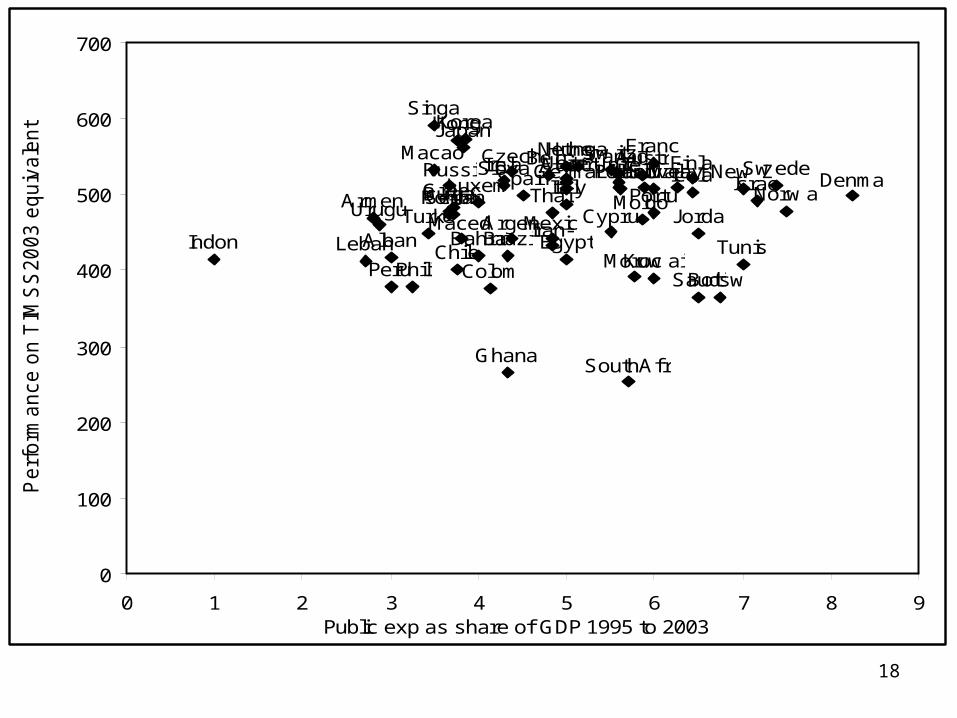
• We acknowledge that relatively on world wide comparisons we are well resourced in education yet perform poorly.
• We acknowledge provincial inequalities from 1995 continue to become overcome, however…
• Without repeating what’s in the report, this presentation raises some concerns about the outcomes of the report especially in regards to legacies and provincial equity
3
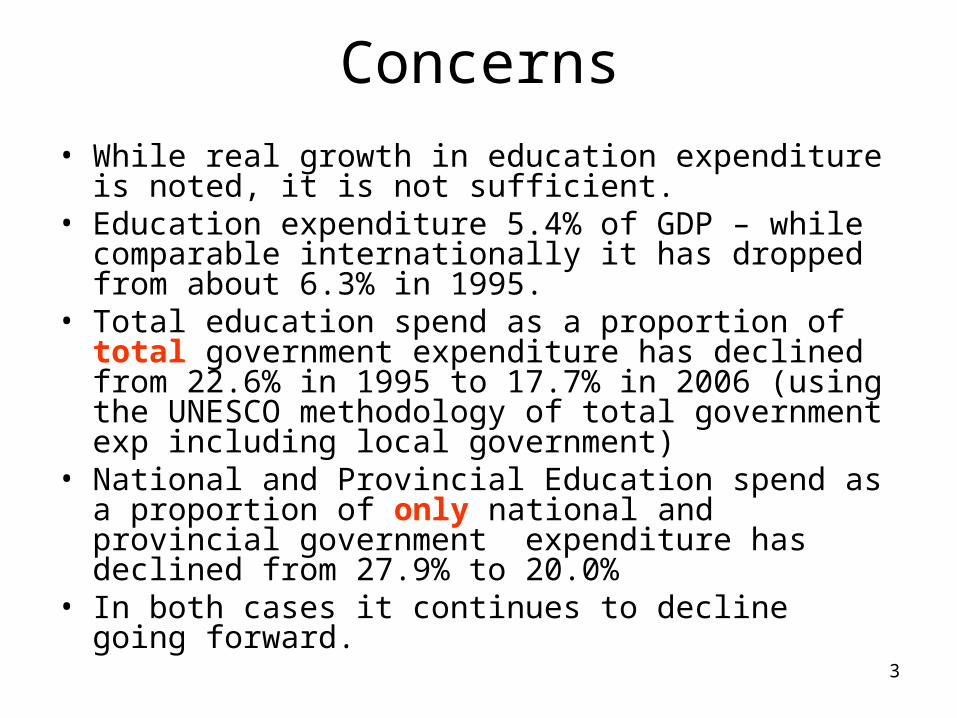
Concerns• While real growth in education expenditure is noted, it is
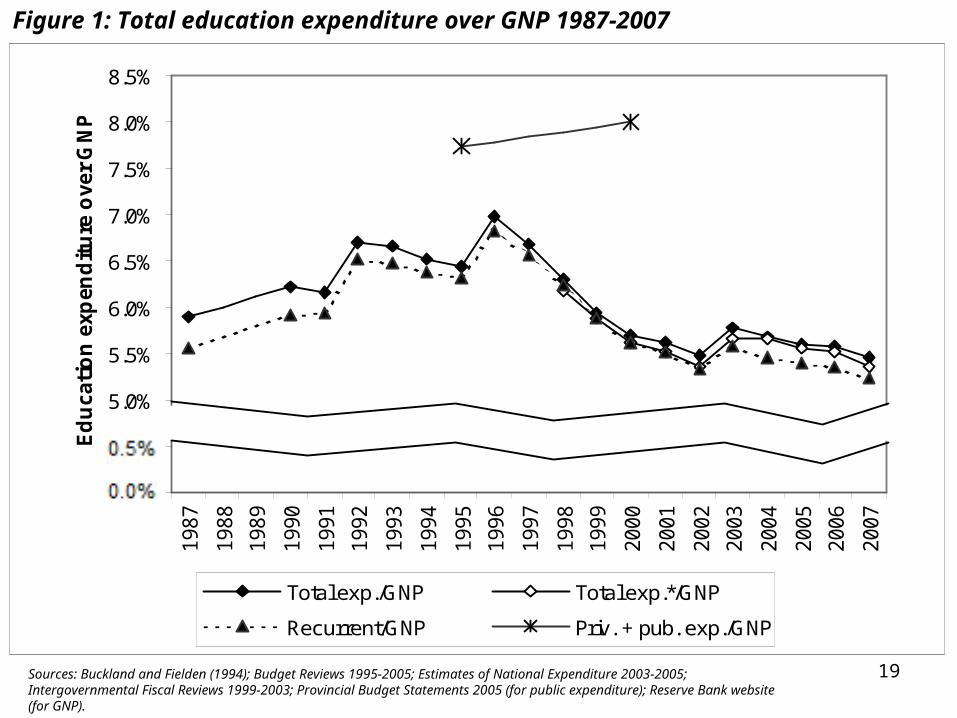
not sufficient.• Education expenditure 5.4% of GDP – while comparable
internationally it has dropped from about 6.3% in 1995.• Total education spend as a proportion of total
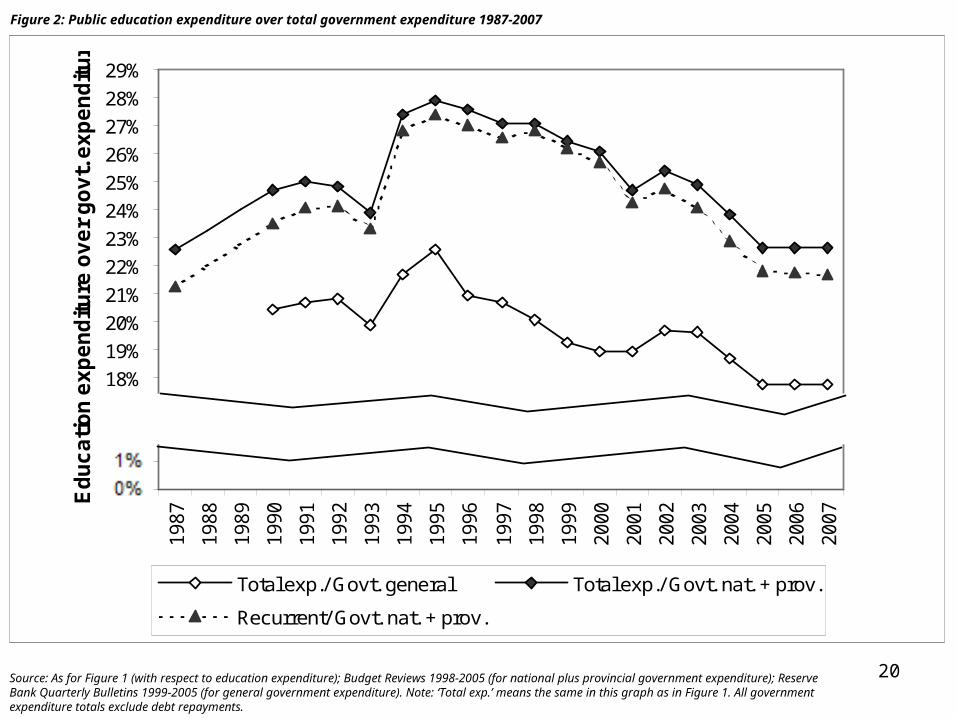
government expenditure has declined from 22.6% in 1995 to 17.7% in 2006 (using the UNESCO methodology of total government exp including local government)
• National and Provincial Education spend as a proportion of only national and provincial government expenditure has declined from 27.9% to 20.0%
• In both cases it continues to decline going forward.
4
Concerns
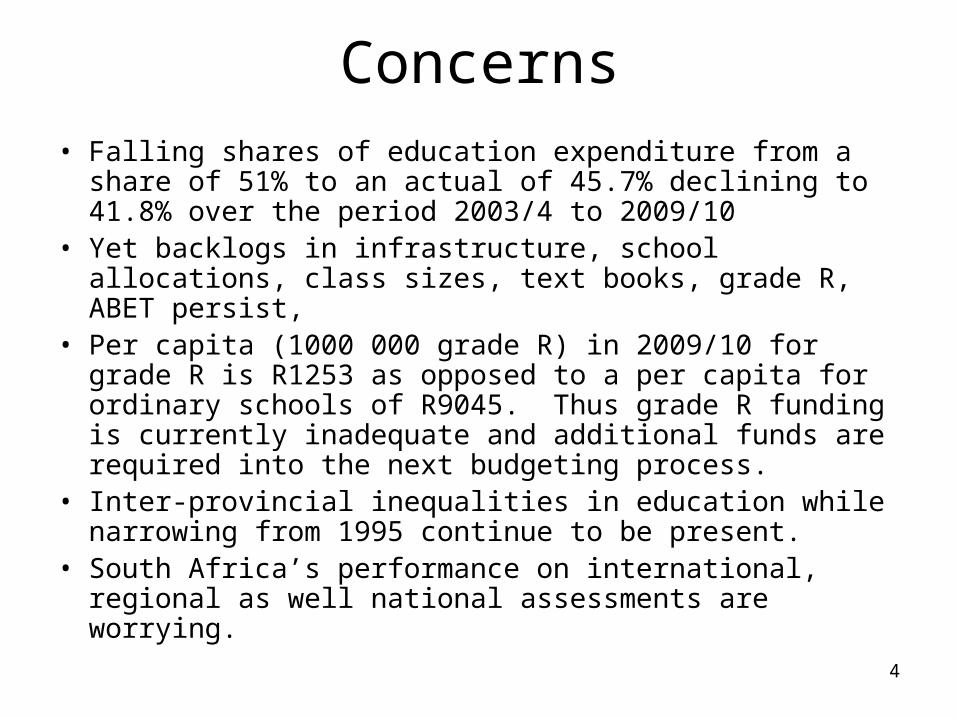
• Falling shares of education expenditure from a share of 51% to an actual of 45.7% declining to 41.8% over the period 2003/4 to 2009/10
• Yet backlogs in infrastructure, school allocations, class sizes, text books, grade R, ABET persist,
• Per capita (1000 000 grade R) in 2009/10 for grade R is R1253 as opposed to a per capita for ordinary schools of R9045. Thus grade R funding is currently inadequate and additional funds are required into the next budgeting process.
• Inter-provincial inequalities in education while narrowing from 1995 continue to be present.
• South Africa’s performance on international, regional as well national assessments are worrying.
5
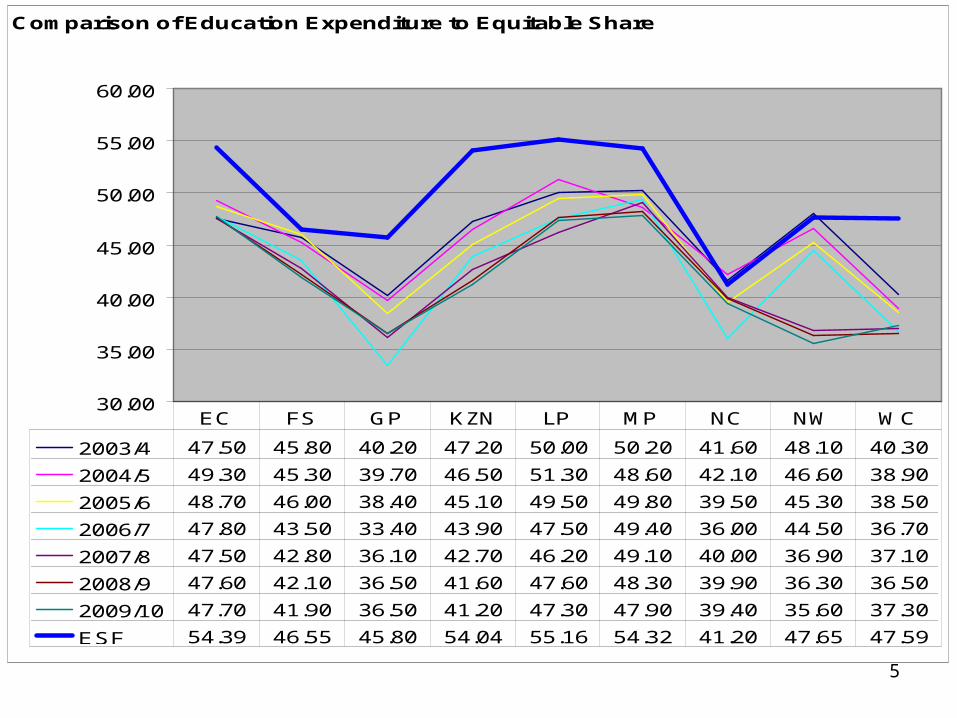
Comparison of Education Expenditure to Equitable Share
30.00
35.00
40.00
45.00
50.00
55.00
60.00
2003/4 47.50 45.80 40.20 47.20 50.00 50.20 41.60 48.10 40.30
2004/5 49.30 45.30 39.70 46.50 51.30 48.60 42.10 46.60 38.90
2005/6 48.70 46.00 38.40 45.10 49.50 49.80 39.50 45.30 38.50
2006/7 47.80 43.50 33.40 43.90 47.50 49.40 36.00 44.50 36.70
2007/8 47.50 42.80 36.10 42.70 46.20 49.10 40.00 36.90 37.10
2008/9 47.60 42.10 36.50 41.60 47.60 48.30 39.90 36.30 36.50
2009/10 47.70 41.90 36.50 41.20 47.30 47.90 39.40 35.60 37.30
ESF 54.39 46.55 45.80 54.04 55.16 54.32 41.20 47.65 47.59
EC FS GP KZN LP MP NC NW WC
6
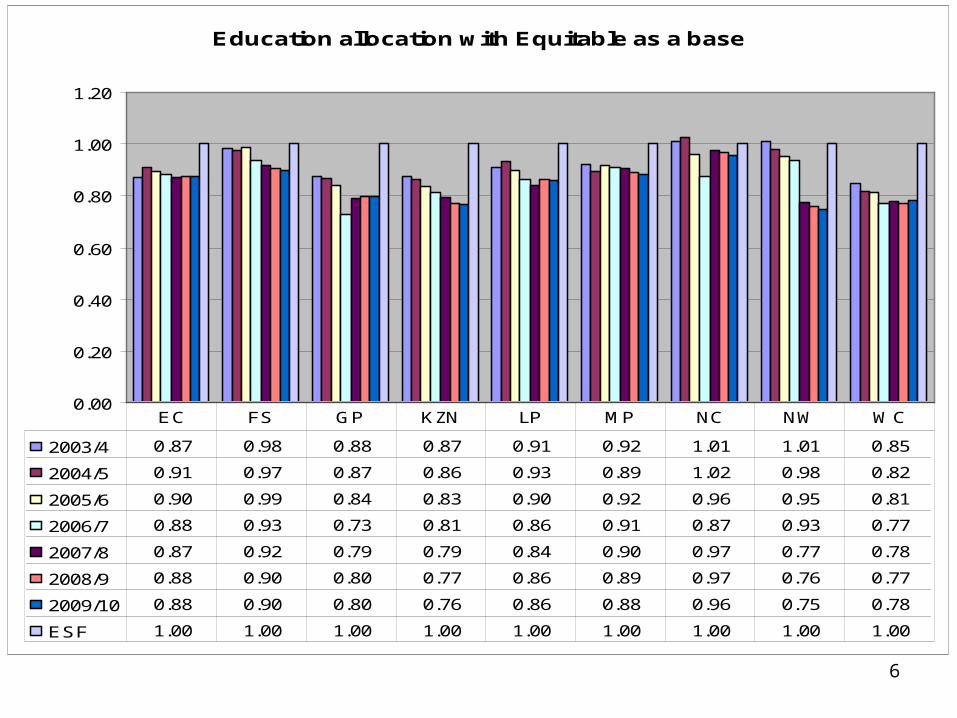
Education allocation with Equitable as a base
0.00
0.20
0.40
0.60
0.80
1.00
1.20
2003/4 0.87 0.98 0.88 0.87 0.91 0.92 1.01 1.01 0.85
2004/5 0.91 0.97 0.87 0.86 0.93 0.89 1.02 0.98 0.82
2005/6 0.90 0.99 0.84 0.83 0.90 0.92 0.96 0.95 0.81
2006/7 0.88 0.93 0.73 0.81 0.86 0.91 0.87 0.93 0.77
2007/8 0.87 0.92 0.79 0.79 0.84 0.90 0.97 0.77 0.78
2008/9 0.88 0.90 0.80 0.77 0.86 0.89 0.97 0.76 0.77
2009/10 0.88 0.90 0.80 0.76 0.86 0.88 0.96 0.75 0.78
ESF 1.00 1.00 1.00 1.00 1.00 1.00 1.00 1.00 1.00
EC FS GP KZN LP MP NC NW WC
7
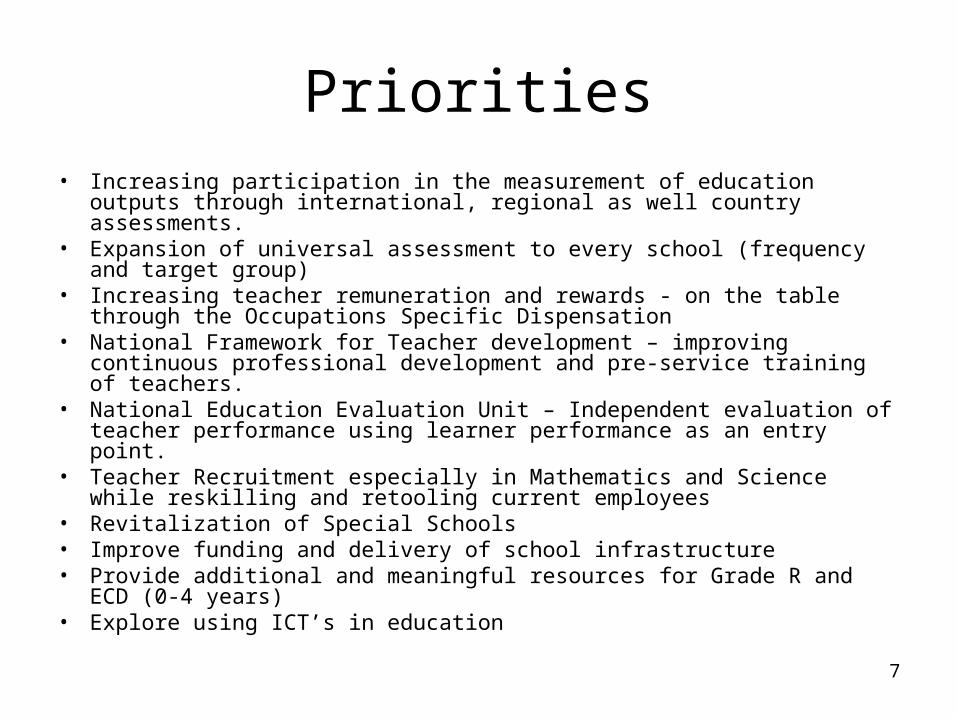
Priorities• Increasing participation in the measurement of education outputs through
international, regional as well country assessments. • Expansion of universal assessment to every school (frequency and target
group) • Increasing teacher remuneration and rewards - on the table through the
Occupations Specific Dispensation• National Framework for Teacher development – improving continuous
professional development and pre-service training of teachers.• National Education Evaluation Unit – Independent evaluation of teacher
performance using learner performance as an entry point.• Teacher Recruitment especially in Mathematics and Science while reskilling
and retooling current employees• Revitalization of Special Schools• Improve funding and delivery of school infrastructure• Provide additional and meaningful resources for Grade R and ECD (0-4
years)• Explore using ICT’s in education
8
Provincial Inequalities
• Learner Educator ratio’s
• Conditions of schools
• No fee school allocations
• Per Capita Expenditure
9
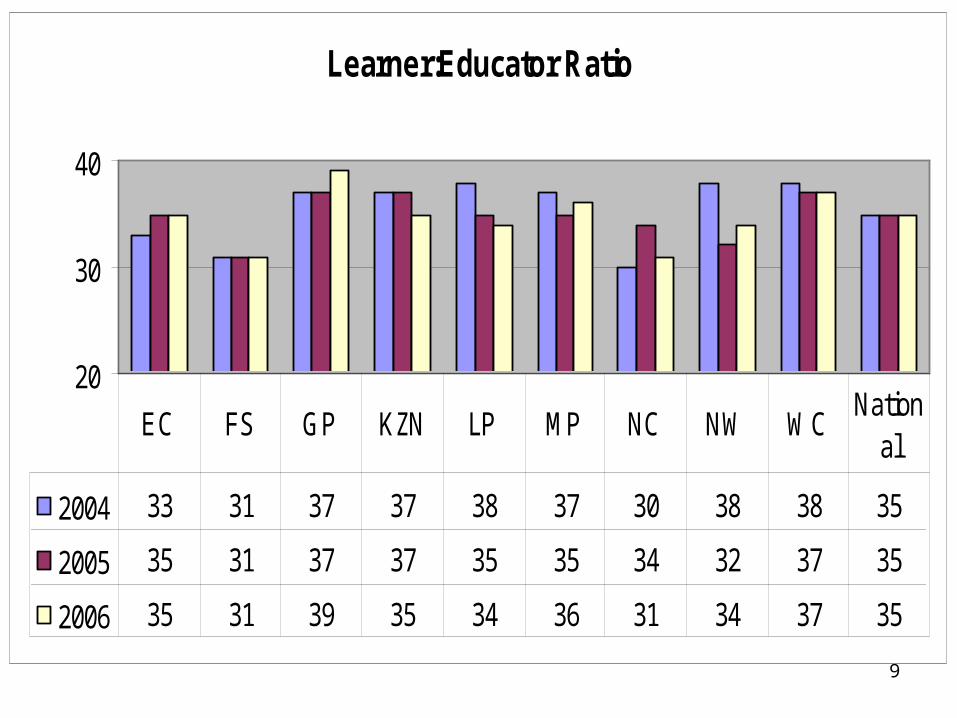
Learner:Educator Ratio
20
30
40
2004 33 31 37 37 38 37 30 38 38 35
2005 35 31 37 37 35 35 34 32 37 35
2006 35 31 39 35 34 36 31 34 37 35
EC FS GP KZN LP MP NC NW WCNation
al
10
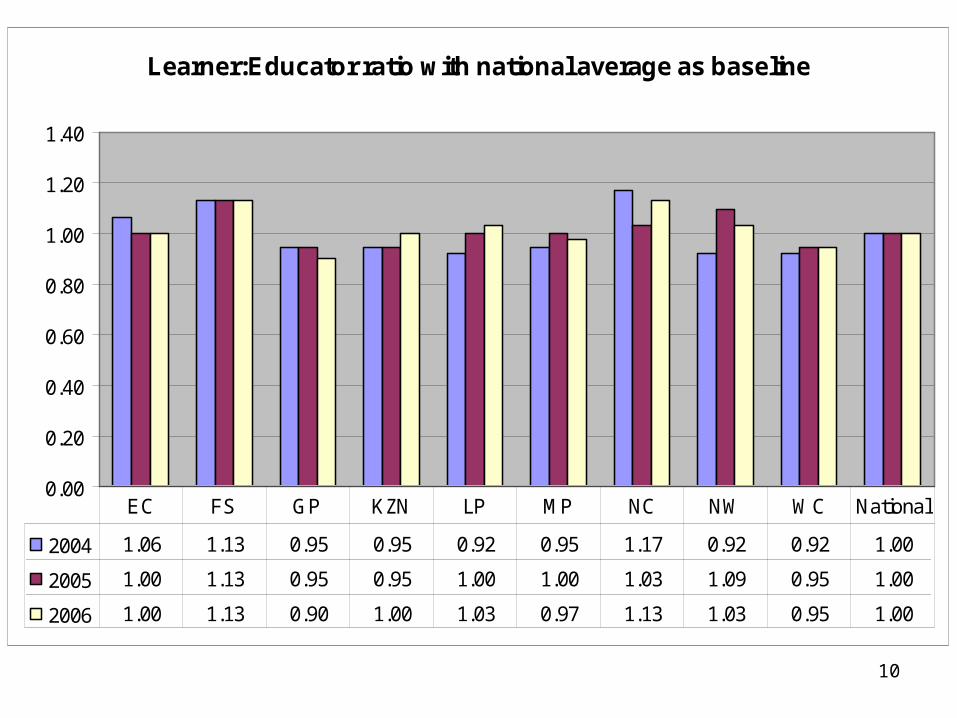
Learner:Educator ratio with national average as baseline
0.00
0.20
0.40
0.60
0.80
1.00
1.20
1.40
2004 1.06 1.13 0.95 0.95 0.92 0.95 1.17 0.92 0.92 1.00
2005 1.00 1.13 0.95 0.95 1.00 1.00 1.03 1.09 0.95 1.00
2006 1.00 1.13 0.90 1.00 1.03 0.97 1.13 1.03 0.95 1.00
EC FS GP KZN LP MP NC NW WC National
11
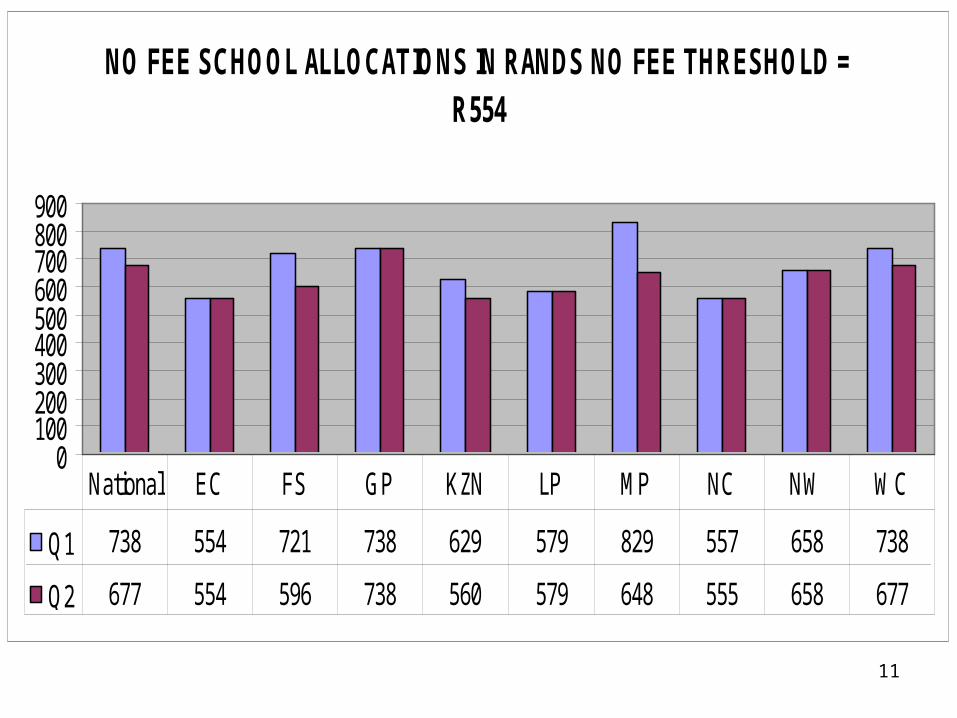
NO FEE SCHOOL ALLOCATIONS IN RANDS NO FEE THRESHOLD = R554
0100200300400500600700800900
Q1 738 554 721 738 629 579 829 557 658 738
Q2 677 554 596 738 560 579 648 555 658 677
National EC FS GP KZN LP MP NC NW WC
12
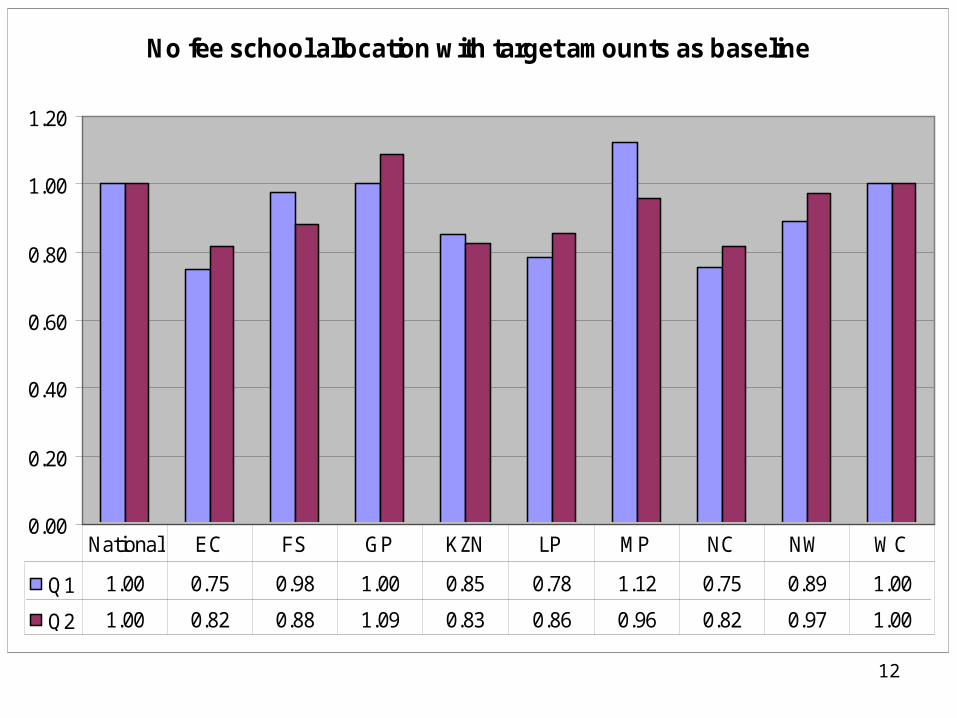
No fee school allocation with target amounts as baseline
0.00
0.20
0.40
0.60
0.80
1.00
1.20
Q1 1.00 0.75 0.98 1.00 0.85 0.78 1.12 0.75 0.89 1.00
Q2 1.00 0.82 0.88 1.09 0.83 0.86 0.96 0.82 0.97 1.00
National EC FS GP KZN LP MP NC NW WC
13
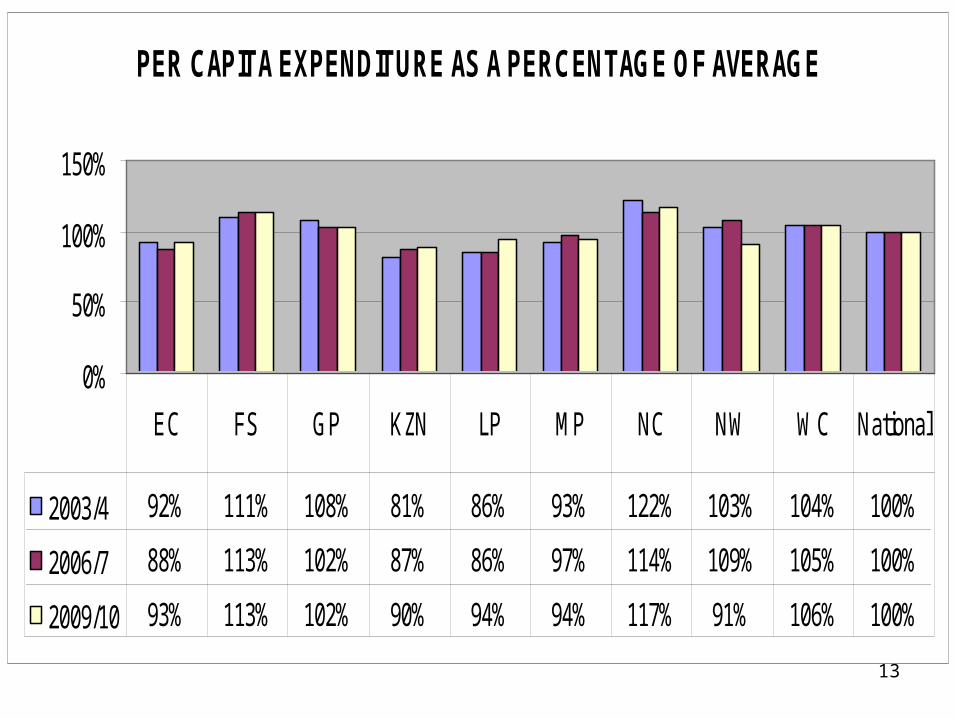
PER CAPITA EXPENDITURE AS A PERCENTAGE OF AVERAGE
0%
50%
100%
150%
2003/4 92% 111% 108% 81% 86% 93% 122% 103% 104% 100%
2006/7 88% 113% 102% 87% 86% 97% 114% 109% 105% 100%
2009/10 93% 113% 102% 90% 94% 94% 117% 91% 106% 100%
EC FS GP KZN LP MP NC NW WC National
14
THANK YOU
15
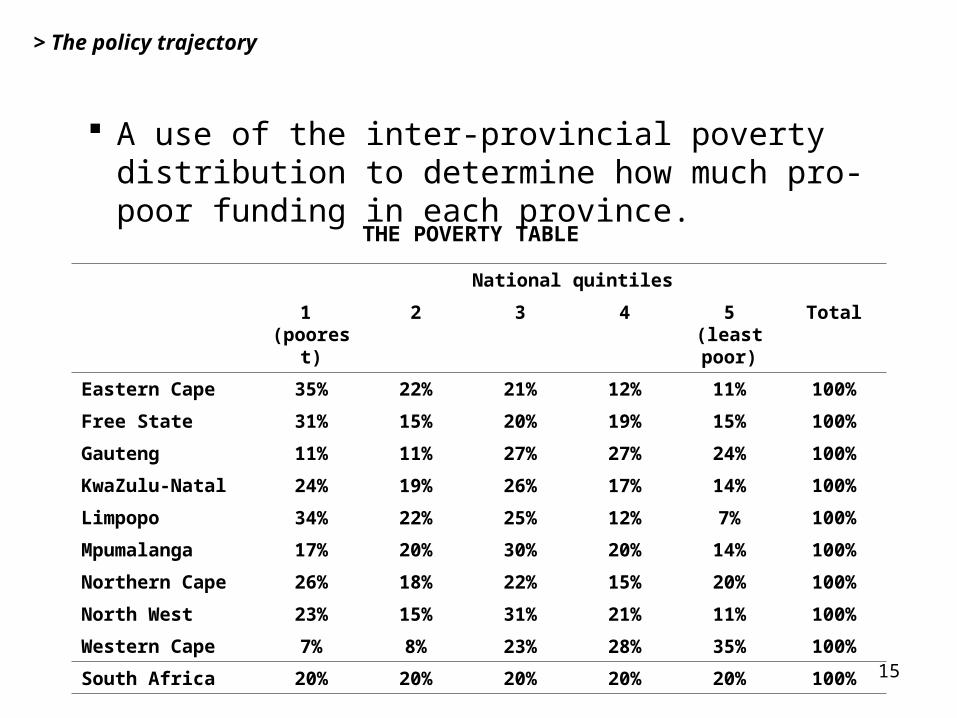
> The policy trajectory
A use of the inter-provincial poverty distribution to determine how much pro-poor funding in each province.
THE POVERTY TABLE
National quintiles
1 (poorest)
2 3 4 5 (least poor)
Total
Eastern Cape 35% 22% 21% 12% 11% 100%
Free State 31% 15% 20% 19% 15% 100%
Gauteng 11% 11% 27% 27% 24% 100%
KwaZulu‑Natal 24% 19% 26% 17% 14% 100%
Limpopo 34% 22% 25% 12% 7% 100%
Mpumalanga 17% 20% 30% 20% 14% 100%
Northern Cape 26% 18% 22% 15% 20% 100%
North West 23% 15% 31% 21% 11% 100%
Western Cape 7% 8% 23% 28% 35% 100%
South Africa 20% 20% 20% 20% 20% 100%
16
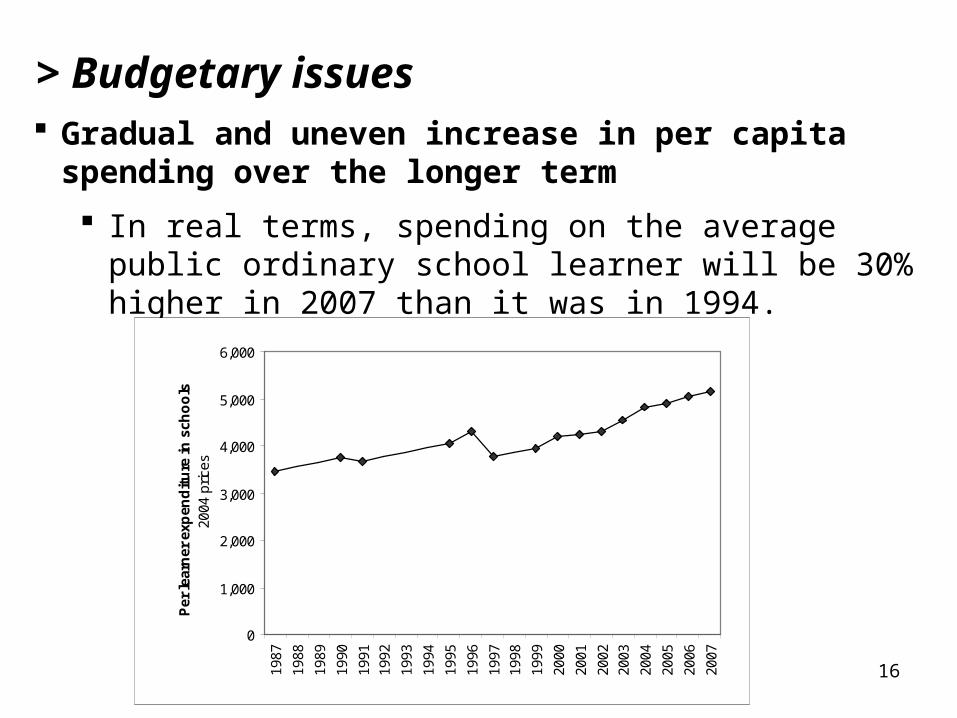
> Budgetary issues Gradual and uneven increase in per capita spending over
the longer term
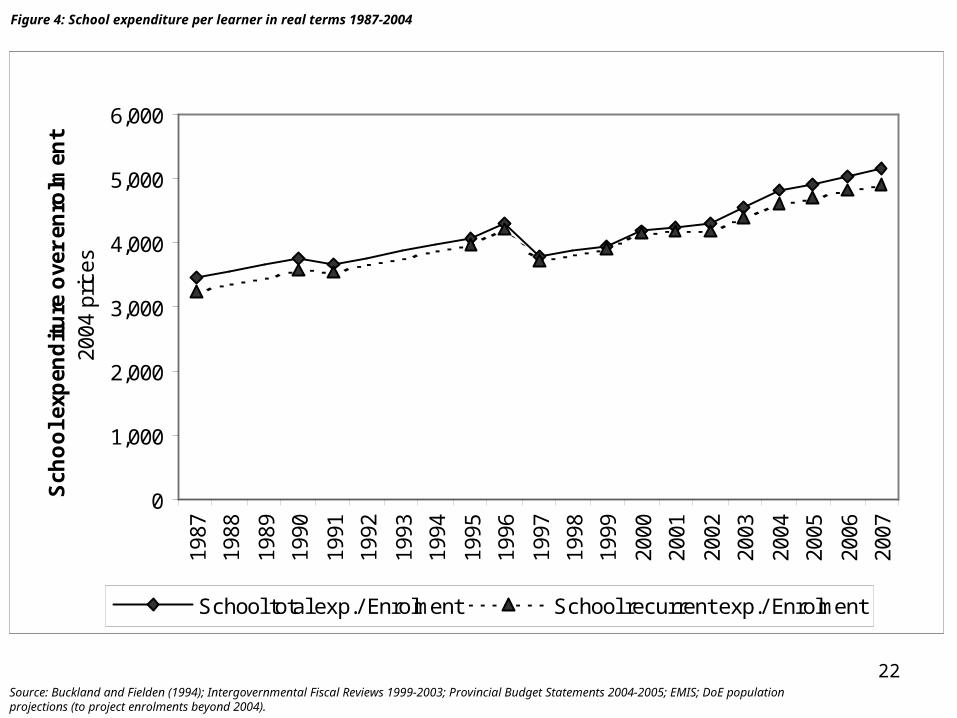
In real terms, spending on the average public ordinary school learner will be 30% higher in 2007 than it was in 1994.
0
1,000
2,000
3,000
4,000
5,000
6,000
1987
1988
1989
1990
1991
1992
1993
1994
1995
1996
1997
1998
1999
2000
2001
2002
2003
2004
2005
2006
2007
Per
lear
ner
exp
end
itu
re in
sch
oo
ls20
04 p
rices
17
Alban
Argen
Armen
AustrAustr
Bahra
Belgi
Botsw
Brazi
Bulga
Canad
Chile
Colom
Cypru
Czech
Denma
Egypt
Finla
Franc
Germa
Ghana
Greec
Hong
Hunga
Icela
IndonIran-
Irela
IsraeItaly
Japan
Jorda
Korea
Kuw ai
Latvi
Leban
LiechLithu
Luxem
Macao
Maced
Malay
Mexic
Moldo
Moroc
Nethe
New Z
Norw a
Pales
PeruPhili
Polan
PortuRoman
Saudi
Slove
SouthAfr
SpainSw ede
Sw itz
Tunis
Turke
UniteUnite
250
300
350
400
450
500
550
600
30 40 50 60 70 80 90 100
Average Secondary Net Enrollment Rate, 1995 to 2003
TIM
SS
2003 e
qu
ivale
nt
scale
r=.76
18
Urugu
UniteUnite
Turke
Tunis
Thail
Sw itzSw edeSpain
SouthAfr
SloveSlova
Singa
Serbi
Saudi
Russi
Roman PortuPolan
PhiliPeru
Norw aNew Z
Nethe
Moroc
MoldoMexic
Malay
Maced
Macao
LuxemLithu
Leban
Latvi
Kuw ai
Korea
Jorda
Japan
Italy IsraeIrela
Iran-Indon
IcelaHunga
Hong
Greec
Ghana
GermaFranc
Finla
Egypt
DenmaCzech
Cypru
ColomChile
Canad
Bulga
Brazi
Botsw
Belgi
Bahra
AustrAustr
ArmenArgen
Alban
0
100
200
300
400
500
600
700
0 1 2 3 4 5 6 7 8 9Public exp as share of GDP 1995 to 2003
Perf
orm
ance o
n T
IMS
S2003 e
quiv
ale
nt scale
19
4.0%
4.5%
5.0%
5.5%
6.0%
6.5%
7.0%
7.5%
8.0%
8.5%
1987
1988
1989
1990
1991
1992
1993
1994
1995
1996
1997
1998
1999
2000
2001
2002
2003
2004
2005
2006
2007
Ed
ucati
on
exp
en
dit
ure
over
GN
P
Total exp./GNP Total exp.*/GNP
Recurrent/GNP Priv. + pub. exp./GNP
Figure 1: Total education expenditure over GNP 1987-2007
Sources: Buckland and Fielden (1994); Budget Reviews 1995-2005; Estimates of National Expenditure 2003-2005; Intergovernmental Fiscal Reviews 1999-2003; Provincial Budget Statements 2005 (for public expenditure); Reserve Bank website (for GNP).
20
Figure 2: Public education expenditure over total government expenditure 1987-2007
14%
15%
16%
17%
18%
19%
20%
21%
22%
23%
24%
25%
26%
27%
28%
29%
1987
1988
1989
1990
1991
1992
1993
1994
1995
1996
1997
1998
1999
2000
2001
2002
2003
2004
2005
2006
2007E
du
ca
tio
n e
xp
en
dit
ure
ov
er
go
vt.
ex
pe
nd
itu
re
Total exp./ Govt. general Total exp./ Govt. nat. + prov.
Recurrent/ Govt. nat. + prov.
Source: As for Figure 1 (with respect to education expenditure); Budget Reviews 1998-2005 (for national plus provincial government expenditure); Reserve Bank Quarterly Bulletins 1999-2005 (for general government expenditure). Note: ‘Total exp.’ means the same in this graph as in Figure 1. All government expenditure totals exclude debt repayments.
21
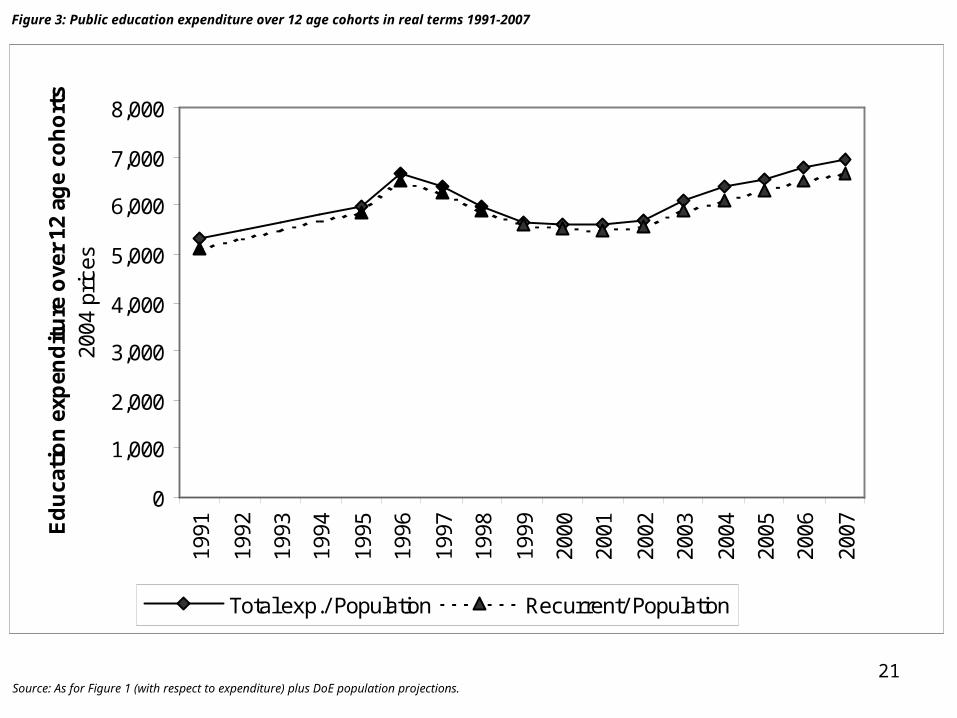
Figure 3: Public education expenditure over 12 age cohorts in real terms 1991-2007
0
1,000
2,000
3,000
4,000
5,000
6,000
7,000
8,000
1991
1992
1993
1994
1995
1996
1997
1998
1999
2000
2001
2002
2003
2004
2005
2006
2007E
du
cati
on
exp
end
itu
re o
ver
12 a
ge
coh
ort
s20
04 p
rices
Total exp./ Population Recurrent/ Population
Source: As for Figure 1 (with respect to expenditure) plus DoE population projections.
22
Figure 4: School expenditure per learner in real terms 1987-2004
0
1,000
2,000
3,000
4,000
5,000
6,000
1987
1988
1989
1990
1991
1992
1993
1994
1995
1996
1997
1998
1999
2000
2001
2002
2003
2004
2005
2006
2007
Sch
oo
l exp
end
itu
re o
ver
enro
lmen
t20
04 p
rices
School total exp./ Enrolment School recurrent exp./ Enrolment
Source: Buckland and Fielden (1994); Intergovernmental Fiscal Reviews 1999-2003; Provincial Budget Statements 2004-2005; EMIS; DoE population projections (to project enrolments beyond 2004).
23
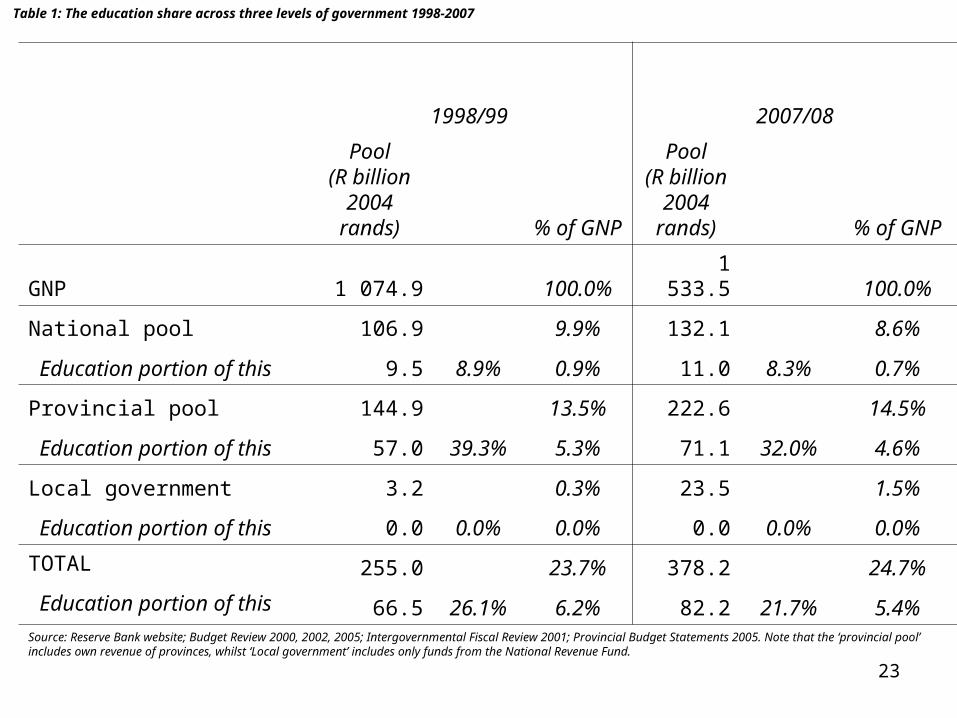
Table 1: The education share across three levels of government 1998-2007
1998/99 2007/08
Pool(R billion
2004 rands)
% of GNP
Pool(R billion
2004 rands) % of GNP
GNP 1 074.9 100.0% 1 533.5 100.0%
National pool 106.9 9.9% 132.1 8.6%
Education portion of this 9.5 8.9% 0.9% 11.0 8.3% 0.7%
Provincial pool 144.9 13.5% 222.6 14.5%
Education portion of this 57.0 39.3% 5.3% 71.1 32.0% 4.6%
Local government 3.2 0.3% 23.5 1.5%
Education portion of this 0.0 0.0% 0.0% 0.0 0.0% 0.0%
TOTAL 255.0 23.7% 378.2 24.7%
Education portion of this 66.5 26.1% 6.2% 82.2 21.7% 5.4%Source: Reserve Bank website; Budget Review 2000, 2002, 2005; Intergovernmental Fiscal Review 2001; Provincial Budget Statements 2005. Note that the ‘provincial pool’ includes own revenue of provinces, whilst ‘Local government’ includes only funds from the National Revenue Fund.
24
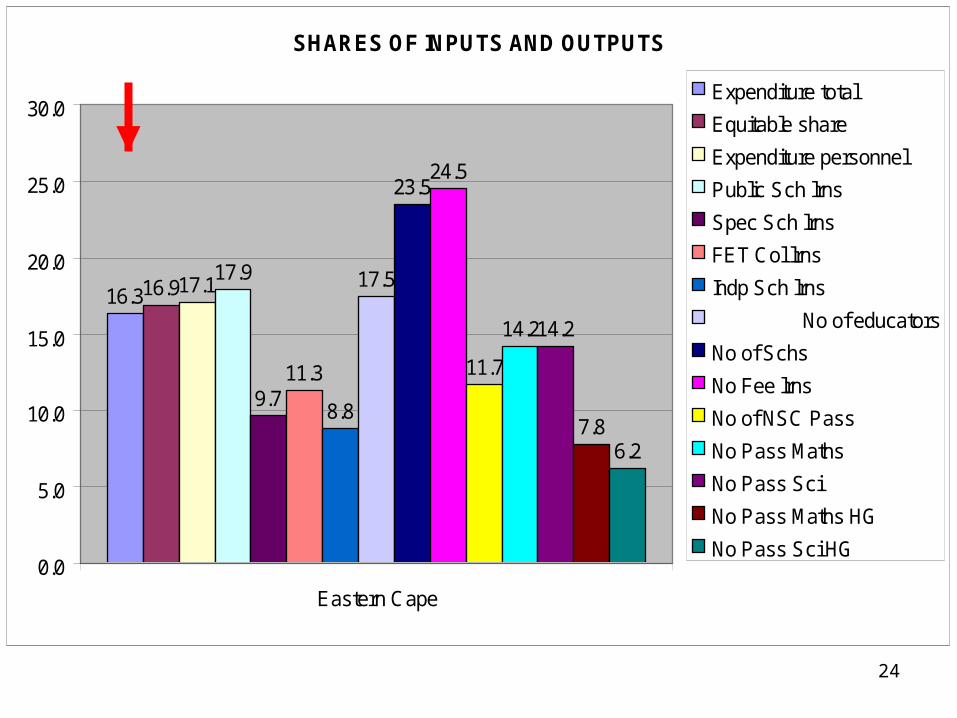
SHARES OF INPUTS AND OUTPUTS
16.316.917.117.9
9.711.3
8.8
17.5
23.524.5
11.7
14.214.2
7.86.2
0.0
5.0
10.0
15.0
20.0
25.0
30.0
Eastern Cape
Expenditure total
Equitable share
Expenditure personnel
Public Sch lrns
Spec Sch lrns
FET Col lrns
Indp Sch lrns
No of educators
No of Schs
No Fee lrns
No of NSC Pass
No Pass Maths
No Pass Sci
No Pass Maths HG
No Pass Sci HG
25
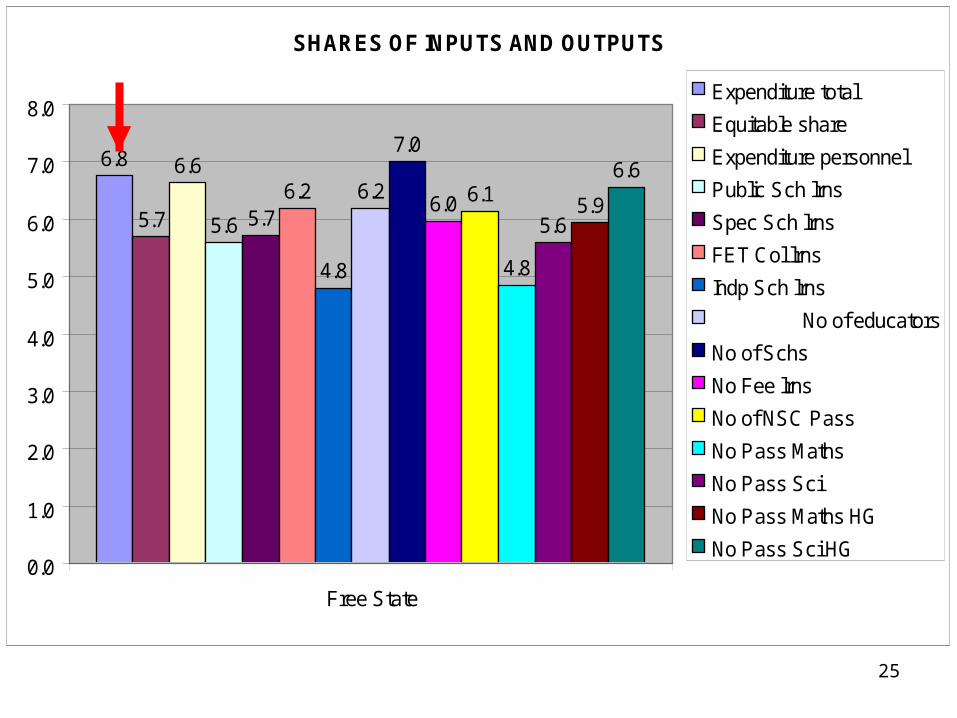
SHARES OF INPUTS AND OUTPUTS
6.8
5.7
6.6
5.6 5.76.2
4.8
6.2
7.0
6.0 6.1
4.8
5.65.9
6.6
0.0
1.0
2.0
3.0
4.0
5.0
6.0
7.0
8.0
Free State
Expenditure total
Equitable share
Expenditure personnel
Public Sch lrns
Spec Sch lrns
FET Col lrns
Indp Sch lrns
No of educators
No of Schs
No Fee lrns
No of NSC Pass
No Pass Maths
No Pass Sci
No Pass Maths HG
No Pass Sci HG
26
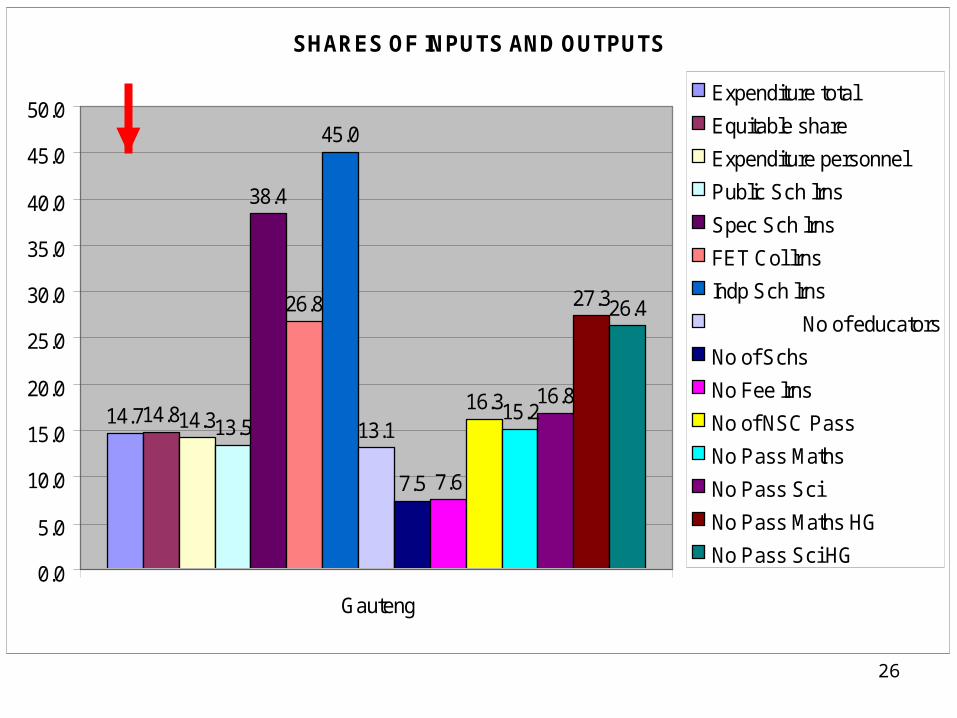
SHARES OF INPUTS AND OUTPUTS
14.714.814.313.5
38.4
26.8
45.0
13.1
7.5 7.6
16.315.216.8
27.326.4
0.0
5.0
10.0
15.0
20.0
25.0
30.0
35.0
40.0
45.0
50.0
Gauteng
Expenditure total
Equitable share
Expenditure personnel
Public Sch lrns
Spec Sch lrns
FET Col lrns
Indp Sch lrns
No of educators
No of Schs
No Fee lrns
No of NSC Pass
No Pass Maths
No Pass Sci
No Pass Maths HG
No Pass Sci HG
27
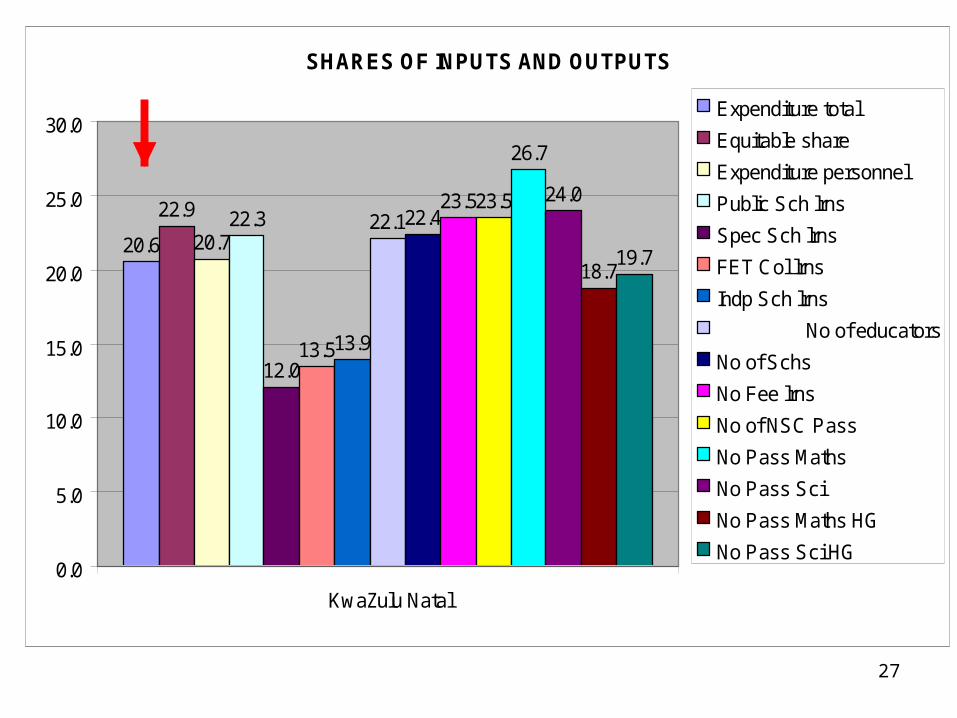
SHARES OF INPUTS AND OUTPUTS
20.6
22.9
20.722.3
12.013.513.9
22.122.423.523.5
26.7
24.0
18.719.7
0.0
5.0
10.0
15.0
20.0
25.0
30.0
KwaZulu Natal
Expenditure total
Equitable share
Expenditure personnel
Public Sch lrns
Spec Sch lrns
FET Col lrns
Indp Sch lrns
No of educators
No of Schs
No Fee lrns
No of NSC Pass
No Pass Maths
No Pass Sci
No Pass Maths HG
No Pass Sci HG
28
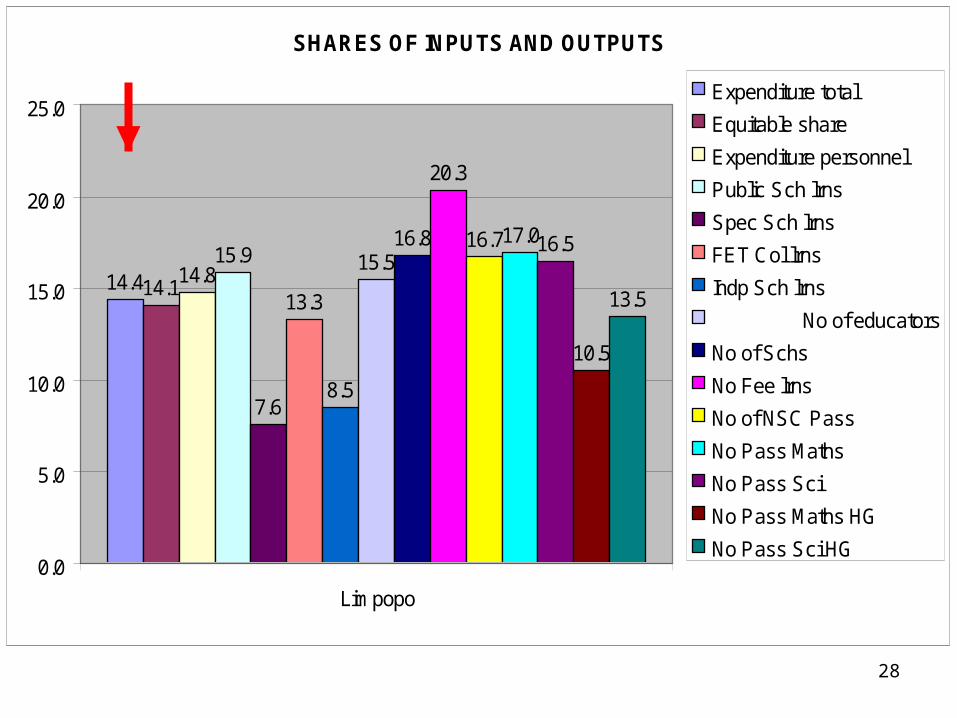
SHARES OF INPUTS AND OUTPUTS
14.414.114.8
15.9
7.6
13.3
8.5
15.516.8
20.3
16.717.016.5
10.5
13.5
0.0
5.0
10.0
15.0
20.0
25.0
Limpopo
Expenditure total
Equitable share
Expenditure personnel
Public Sch lrns
Spec Sch lrns
FET Col lrns
Indp Sch lrns
No of educators
No of Schs
No Fee lrns
No of NSC Pass
No Pass Maths
No Pass Sci
No Pass Maths HG
No Pass Sci HG
29
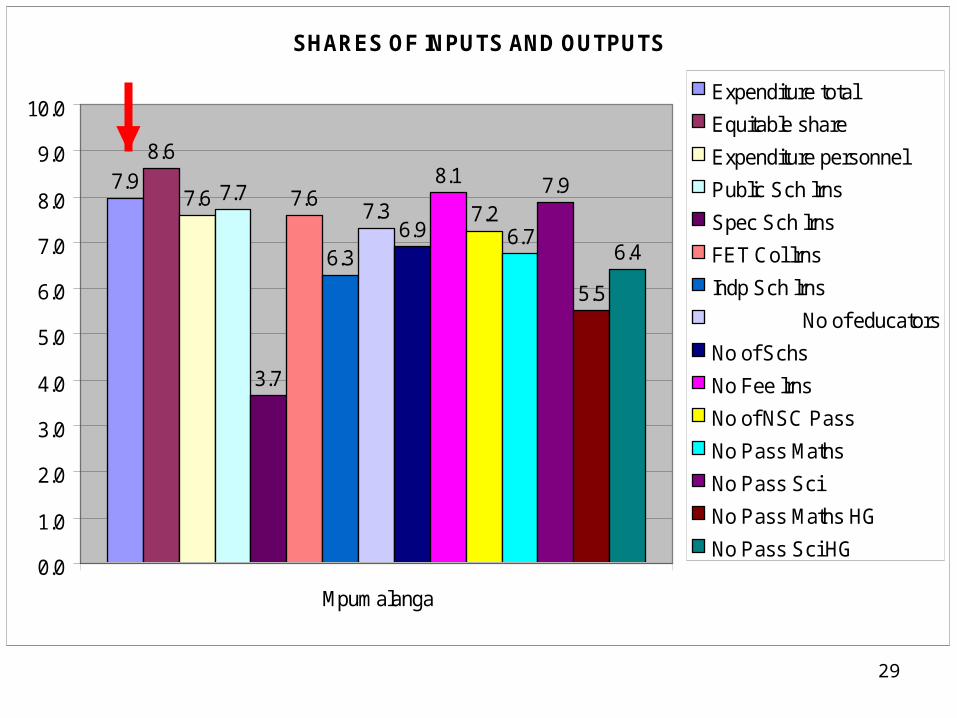
SHARES OF INPUTS AND OUTPUTS
7.9
8.6
7.6 7.7
3.7
7.6
6.3
7.36.9
8.1
7.26.7
7.9
5.5
6.4
0.0
1.0
2.0
3.0
4.0
5.0
6.0
7.0
8.0
9.0
10.0
Mpumalanga
Expenditure total
Equitable share
Expenditure personnel
Public Sch lrns
Spec Sch lrns
FET Col lrns
Indp Sch lrns
No of educators
No of Schs
No Fee lrns
No of NSC Pass
No Pass Maths
No Pass Sci
No Pass Maths HG
No Pass Sci HG
30
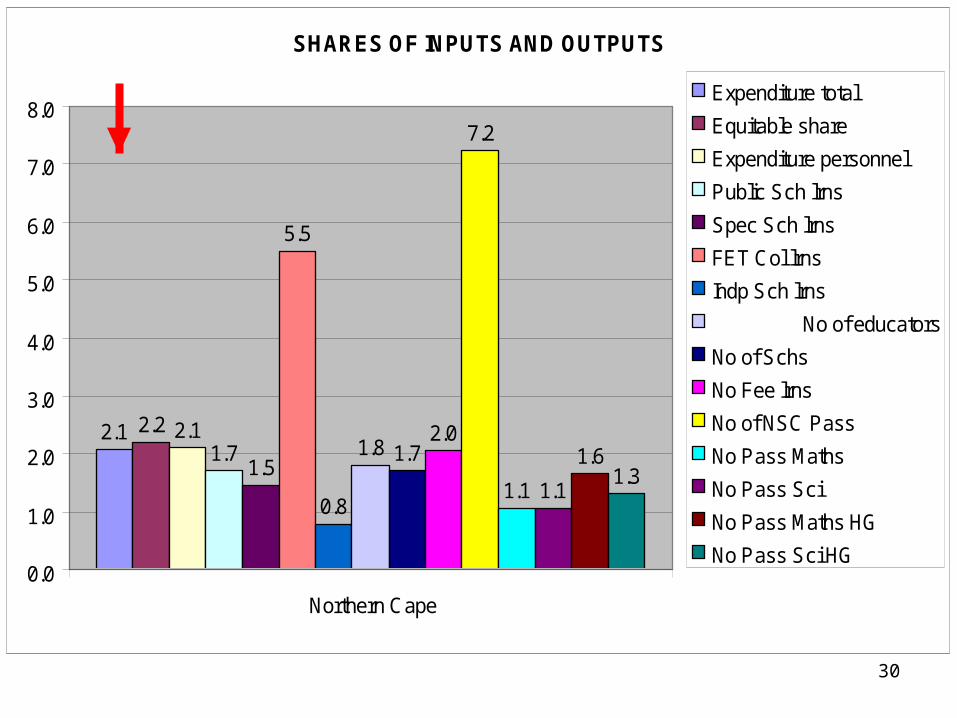
SHARES OF INPUTS AND OUTPUTS
2.1 2.2 2.11.7
1.5
5.5
0.8
1.8 1.72.0
7.2
1.1 1.1
1.61.3
0.0
1.0
2.0
3.0
4.0
5.0
6.0
7.0
8.0
Northern Cape
Expenditure total
Equitable share
Expenditure personnel
Public Sch lrns
Spec Sch lrns
FET Col lrns
Indp Sch lrns
No of educators
No of Schs
No Fee lrns
No of NSC Pass
No Pass Maths
No Pass Sci
No Pass Maths HG
No Pass Sci HG
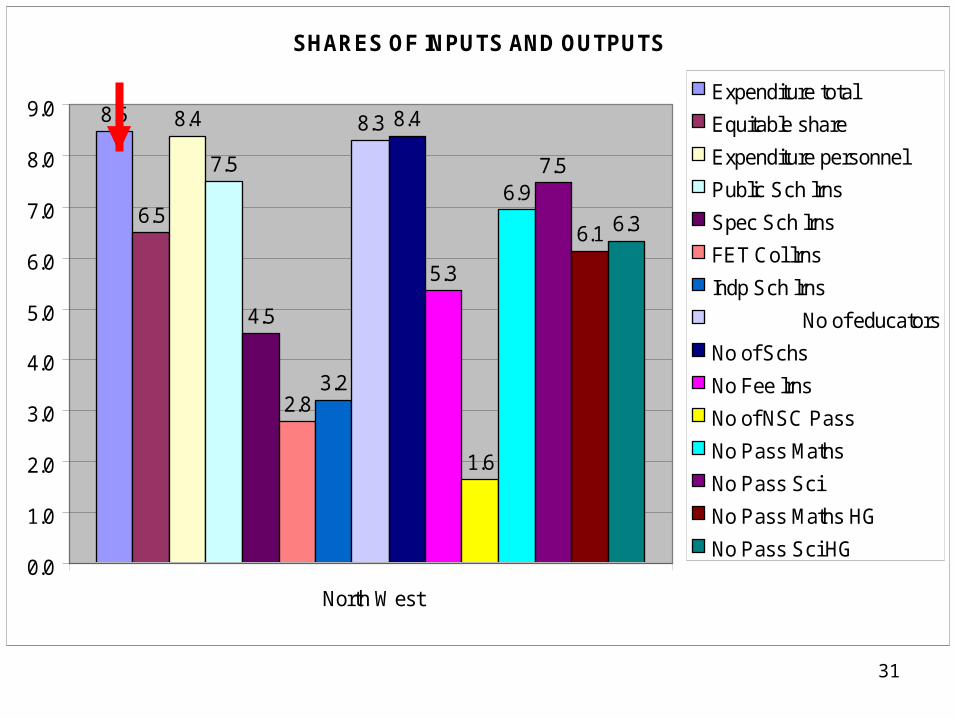
31
SHARES OF INPUTS AND OUTPUTS
8.5
6.5
8.4
7.5
4.5
2.83.2
8.3 8.4
5.3
1.6
6.97.5
6.1 6.3
0.0
1.0
2.0
3.0
4.0
5.0
6.0
7.0
8.0
9.0
North West
Expenditure total
Equitable share
Expenditure personnel
Public Sch lrns
Spec Sch lrns
FET Col lrns
Indp Sch lrns
No of educators
No of Schs
No Fee lrns
No of NSC Pass
No Pass Maths
No Pass Sci
No Pass Maths HG
No Pass Sci HG
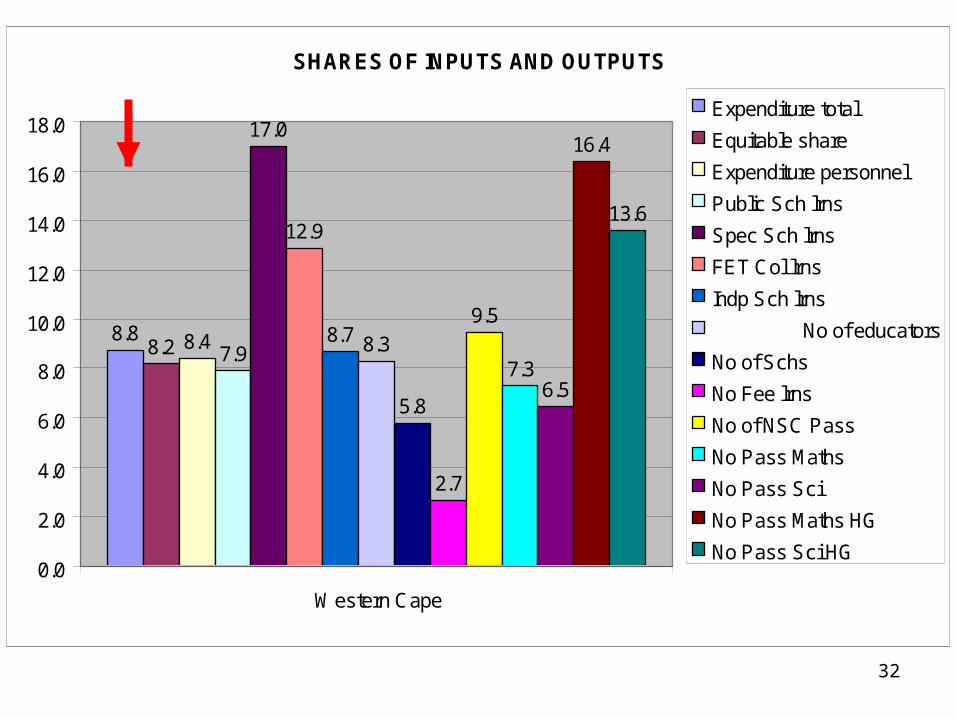
32
SHARES OF INPUTS AND OUTPUTS
8.88.2 8.4
7.9
17.0
12.9
8.7 8.3
5.8
2.7
9.5
7.36.5
16.4
13.6
0.0
2.0
4.0
6.0
8.0
10.0
12.0
14.0
16.0
18.0
Western Cape
Expenditure total
Equitable share
Expenditure personnel
Public Sch lrns
Spec Sch lrns
FET Col lrns
Indp Sch lrns
No of educators
No of Schs
No Fee lrns
No of NSC Pass
No Pass Maths
No Pass Sci
No Pass Maths HG
No Pass Sci HG