Embed Size (px)
Citation preview
1
1 Introduction Sushil K. Misra
1.1 Introduction to EPR
In earlier days, electron paramagnetic resonance ( EPR ) was referred to as para-magnetic resonance ( PMR ), but today it is also referred to as electron spin reso-nance ( ESR ) and, more recently – in analogy with nuclear magnetic resonance ( NMR ) – as electron magnetic resonance ( EMR ). For simplicity and consistency, however, the term EPR will be used throughout this book.
With the advent of high - frequency spectrometers, EPR has today become a very sensitive and unique technique. Historically, the most commonly used frequency band for EPR has been X - band ( ∼ 9.5 GHz; 1 GHz = 10 9 Hertz]), requiring a waveguide resonator of the size ∼ 3.0 cm. The processing and analysis of EPR spectra have become much more easy and accurate with the development of the personal computer ( PC ), which today is becoming equipped with increasingly faster processors as time marches on. As a result, computational times have been reduced by many orders of magnitude over the past three decades, and this is expected to be reduced even further in future. In addition, faster and more accurate EPR data acquisition softwares have been developed which no longer require the use of chart recorders. When combining these developments with parallel process-ing in computation, the acquisition, simulation, and analysis of EPR data have become extremely rapid and effi cient.
1.1.1 Continuous - Wave EPR
In continuous - wave EPR ( CW - EPR ) spectroscopy, the microwave fi eld is applied to the sample over the entire period of time, while the EPR signal is recorded for a sweep of the external magnetic fi eld over a chosen range of time, normally over 0.0 – 0.9 Tesla (1 Tesla (T) = 10 000 Gauss) at X - band. Although the use of X - band spectrometers has provided certain advantages over the years, spectrometers that function at microwave bands of higher and lower frequencies than that of X - band have now been developed, and these may be preferable over X - band for some types
Multifrequency Electron Paramagnetic Resonance, First Edition. Edited by Sushil K. Misra.© 2011 Wiley-VCH Verlag GmbH & Co. KGaA. Published 2011 by Wiley-VCH Verlag GmbH & Co. KGaA.
2 1 Introduction
of investigation. Finally, the variety of experimental data acquired at various fre-quencies indicates that a multifrequency approach in EPR is preferable in order to achieve a complete and unambiguous description of the interaction of a para-magnetic ion with its environment.
1.1.2 Pulsed EPR
In contrast to CW - EPR, and following NMR for which pulsed techniques were fi rst developed, pulsed EPR spectroscopy is now commonly used. In this tech-nique, microwave pulses are applied to the sample over selected fi nite intervals of time, so that the orientation of the precessing magnetic moment about the external magnetic fi eld (Larmor precession) can be turned by chosen angles about the x - , y - , or z - axes (conventionally, the z - axis is chosen to be parallel to the external magnetic fi eld). To this end, it is possible to use a single pulse or more pulses with chosen intervals of time in between, recording a signal (referred to as an “ echo signal ” ) that is proportional to the magnetization of the sample at appropri-ate intervals following application of the last pulse. As a consequence, several varieties of pulsed EPR techniques have been developed; these include electron spin echo ( ESE ), ESE envelope modulation ( ESEEM ), electron – electron double resonance ( ELDOR ), double quantum coherence ( DQC ), double electron – electron resonance ( DEER ) – which is also referred to as pulse ELDOR ( PELDOR ) and ELDOR in ESE – two - dimensional Fourier transform EPR ( 2 - D - FTEPR ), spin - echo correlated spectroscopy ( SECSY ), correlation spectroscopy ( COSY ), and hyperfi ne spin - correlation spectroscopy ( HYSCORE ). Pulsed EPR has certain advantages over CW - EPR, as it provides information that cannot be acquired by using CW - EPR. However, the instrumentation required for pulse EPR is much more costly, and analysis of data much more complex, compared to CW - EPR.
1.1.3 EPR Imaging
In analogy with NMR imaging, the technique of EPR imaging – which is based on the same principle as its NMR counterpart – has undergone a rather rapid develop-ment. EPR imaging provides information that is complementary to NMR imaging. In this book, attention is focused on the theory and applications of multifrequency EPR carried out at frequencies in the ∼ 0.1 to 1200 GHz range, covering the latest developments.
1.2 Historical Background of EPR
The historical background of EPR has occurred in chronological order: (i) the developments in paramagnetism up to 1939, which greatly infl uenced the achieve-
1.3 Typical X-Band, Low-, and High-Frequency Spectrometers 3
ment of magnetic resonance (Bleaney, 1997); (ii) subsequent historical develop-ments in EPR research, which include background research leading to EPR (Poole and Farach, 1997), the early history of EPR spectrometers (Eaton and Eaton, 2004; Grinberg and Dubinskii, 2004; Freed, 2004), and early commercial spectrometers (Varian: Hyde, 2004; Bruker: Schmallbein, 2004). The early history of paramag-netic spin - lattice relaxation was described by Manenkov and Orbach (1976). Details of these references, along with the respective titles, are provided below.
1.2.1 Literature Pertinent to the Early History of EPR
The details of the early history of EPR can be found, for example, in the following sources:
• B. Bleaney (1997) Paramagnetism, Before Magnetic Resonance, in Foundations of Modern EPR (eds G.R. Eaton, S.S. Eaton, and K.M. Salikhov), World Scien-tifi c, New Jersey, 1997 (hereafter Ref. 1), pp. 22 – 36;
• C.P. Poole, Jr and H.A. Farach, Preparing the Way for Paramagnetic Reso-nance, Ref. 1, pp. 13 – 24;
• C.P. Poole, Jr and H. A. Farach, The First Sesquidecade of Paramagnetic Reso-nance, Ref. 1, pp. 63 – 83;
• G.R. Eaton and S.S. Eaton (2004) EPR Spectrometers at Frequencies Below X - band, in Biological Magnetic Resonance , vol. 21 (eds L.J. Berliner and C.J. Bender), Kluwer Academic/Plenum Publishers, New York, pp. 59 – 114;
• O.Y. Grinberg and A.A. Dubinskii (2004) The Early Years, in Biological Mag-netic Resonance , vol. 22, Kluwer Academic/Plenum Publishers, New York;
• O. Grinberg and L.J. Berliner (eds) (hereafter Ref. 2), pp. 1 – 18, and J.H. Freed, The Development of High Field/High Frequency ESR. Historical Review, Ref. 2, pp. 19 – 43;
• J.S. Hyde, EPR at VARIAN: 1954 – 1974, Ref. 1, pp. 695 – 716
• D. Schmalbein, A Bruker History, Ref. 1, pp. 717 – 730;
• A.A. Manenkov and R. Orbach (1976) Spin - Lattice Relaxation in Ionic Solids (eds A.A. Manenkov and R. Orbach), Harper and Row Publishers, New York, pp. ix – x.
1.3 Typical X - Band, Low - , and High - Frequency Spectrometers
1.3.1 EPR Spectrometer Design
The basic details of the designs of CW - EPR spectrometers operating at various frequencies are detailed in this section. Typically, in a CW - EPR spectrometer the
4 1 Introduction
microwave frequency is kept constant and the magnetic fi eld is varied linearly with time. This changes the spacing of the energy levels, so that the condition of reso-nance is fulfi lled when the spacing of energy levels participating in resonance becomes equal to h ν , where ν is the frequency of the microwave radiation and h is Planck ’ s constant. Such a spectrometer consists of four components:
• A source of microwave radiation , with components that control and measure the frequency and intensity of that radiation.
• A magnetic - fi eld system , which provides a stable, linearly varying, and homoge-neous magnetic fi eld of arbitrary magnitude.
• A cavity , or resonator, system characterized by a fi xed resonant frequency, which holds the sample, and directs and controls the microwave beam to and from the sample.
• A signal - detection system , which is accomplished by modulating the magnetic fi eld by an alternating magnetic fi eld, providing a sinusoidal voltage at the modulation frequency that is amplifi ed as the useful EPR absorption signal for its recording.
In the rudimentary system, the cavity can be avoided by simply placing the sample in the waveguide. The next stage of sophistication in design used for “ old - fashioned ” spectrometers was to place the sample in the cavity and to use the transmission mode. Finally, in the commonly used modern design, the cavity is used in refl ection mode in conjunction with a microwave circulator to prevent the refl ected microwaves from passing back to the source of radiation. Today, most EPR spectrometers are of the refl ection type, whereby changes in the amount of radiation refl ected back from the microwave cavity containing the sample are measured. Such EPR spectrometers all have the same design over the range of frequencies from 8 to 70 GHz.
1.3.2 X - Band Spectrometer
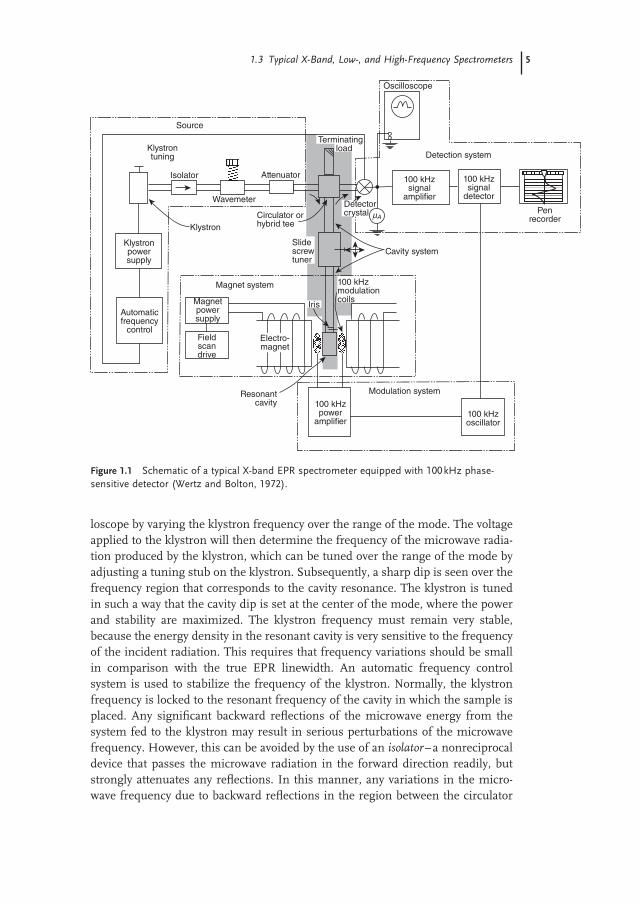
This is the most common spectrometer of those used at various frequencies. The schematic of a typical X - band spectrometer is shown in Figure 1.1 , and the details of the various components are as follows.
1.3.2.1 Source of Microwave Radiation While klystrons (a type of vacuum tube) were used almost exclusively in old spec-trometers as the source of microwave, in virtually all new spectrometers a variety of different sources are used at all frequencies. The radiation emitted from the source is monochromatic (the following description is given in terms of klystrons). In a klystron, microwave oscillations are produced that are centered over a small range of frequencies. This output, when expressed as a function of frequency, is referred to as the klystron mode . Among the several modes available, the mode with the highest power output is usually selected. A mode can be displayed on an oscil-
1.3 Typical X-Band, Low-, and High-Frequency Spectrometers 5
loscope by varying the klystron frequency over the range of the mode. The voltage applied to the klystron will then determine the frequency of the microwave radia-tion produced by the klystron, which can be tuned over the range of the mode by adjusting a tuning stub on the klystron. Subsequently, a sharp dip is seen over the frequency region that corresponds to the cavity resonance. The klystron is tuned in such a way that the cavity dip is set at the center of the mode, where the power and stability are maximized. The klystron frequency must remain very stable, because the energy density in the resonant cavity is very sensitive to the frequency of the incident radiation. This requires that frequency variations should be small in comparison with the true EPR linewidth. An automatic frequency control system is used to stabilize the frequency of the klystron. Normally, the klystron frequency is locked to the resonant frequency of the cavity in which the sample is placed. Any signifi cant backward refl ections of the microwave energy from the system fed to the klystron may result in serious perturbations of the microwave frequency. However, this can be avoided by the use of an isolator – a nonreciprocal device that passes the microwave radiation in the forward direction readily, but strongly attenuates any refl ections. In this manner, any variations in the micro-wave frequency due to backward refl ections in the region between the circulator
Figure 1.1 Schematic of a typical X - band EPR spectrometer equipped with 100 kHz phase - sensitive detector (Wertz and Bolton, 1972).
Source
Klystrontuning
Isolator Attenuator
Wavemeter
Klystron
Klystronpowersupply
Automaticfrequency
control
Magnetpowersupply
Magnet system
Fieldscandrive
Electro-magnet
100 kHzpower
amplifier100 kHzoscillator
Cavity system
Detectorcrystal mA
Penrecorder
Detection system
100 kHzsignal
detector
100 kHzsignal
amplifier
Oscilloscope
Terminating load
Circulator orhybrid tee
Slidescrewtuner
Resonantcavity
100 kHzmodulationcoils
Iris
Modulation system
6 1 Introduction
and the klystron are minimized. The frequency of the radiation is measured with a wavemeter . This is a cylindrical resonant cavity, the length of which is adjustable to an integral number of half - wavelengths by using a micrometer. Any decrease in the power will be detected by a silicon crystal when the resonant frequency of the wavemeter matches the frequency of the incident microwaves, because of the resonant absorption of the microwaves by the wavemeter. The wavemeter is usually read to a precision of ± 1 MHz, having been calibrated in frequency units, although typically its accuracy will be ± 9 MHz. For greater accuracy in frequency measurements it is possible to use a frequency meter by coupling it to the micro-wave system. It should be noted that wavemeters most likely retain some use at very high frequencies, but at Q - band and lower frequencies a frequency counter would be used rather than a wavemeter. The microwave power incident on the sample can be adjusted with an attenuator , which consists of an absorptive element.
1.3.2.2 Transmission of Microwaves Single - mode waveguides are used for the transmission of microwaves. The size of a waveguide increases with wavelength, or decreases with frequency in a linear fashion. For example, the dimension (cross - section) of an X - band (9.8 GHz) waveguide are: 0.9 × 0.4 in (2.3 × 1.0 cm), whereas they are 6.50 × 3.25 in (16.5 × 8.3 cm) at L - band (1 GHz). At lower frequencies – including that of X - band – higher - order modes are not excited, so that simple bends can be made and the directional couplers and other passive components twisted in simple manner. As the wavelengths at low frequencies are rather large, the resistive losses in the waveguides at X - band are minimal, being proportional to ν 3/2 for a single - mode waveguide, and of the order of 0.7 dB m − 1 for TE 10 rectangular mode. It should be noted that semi - rigid coaxial cables are frequently used in the range extending from L - to X - band frequencies; however, at frequencies above 10 GHz their propagation losses become rather large. Nonetheless, they provide a compact size and thus are convenient in usage.
1.3.2.3 The Cavity (Resonator) System The sensitivity of a spectrometer is enhanced by a resonator, which stores the microwave energy, and concentrates the microwave power at the sample. Cavities are used as the most common type of resonator, with the most frequently used being rectangular - parallelepiped and cylindrical in nature. The cavities are con-structed as a short section, which is an integral number of half - wavelengths, of a rectangular or circular wave guide in which a standing wave is produced. Cavities become progressively larger as the frequency decreases. In this context, the funda-mental resonance frequency is defi ned as that which corresponds to a cavity dimen-sion. It is possible to excite more than one type of standing wave pattern, called a mode . These are referred to as transverse electric ( TE ) modes, where the subscript denotes the number of half - wavelengths along the various dimensions (e.g., TE 102 for rectangular - parallelepiped and TE 011 for cylindrical cavities). A cylindrical cavity can be tuned by using a piston fi tted at one end; this property is also used in a wavemeter (as described above), which is a cylindrical cavity used to measure the
1.3 Typical X-Band, Low-, and High-Frequency Spectrometers 7
wavelength of the microwave radiation. Since, for microwaves, the wavelength is typically of the order of centimeters, the size of the resonant cavity is convenient to handle reasonably large samples. For microwaves, it is important to consider both the electric ( E 1 ) and magnetic ( B 1 ) fi elds in the cavity. The lines of forces for the electric and magnetic fi elds are calculated using Maxwell ’ s equations, with the maxima of the electric and magnetic fi elds occurring at different places, depending on the mode. The requirements for EPR resonance are: (i) a cavity mode should permit a high - energy density; (ii) the sample can be placed where the density of B 1 is maximum; and (iii) the B 1 fi eld is perpendicular to the static fi eld B to observe the allowed transitions, for which Δ M = ± 1, where M is the electron spin magnetic quantum number. The Q - factor of a cavity represents the sharpness, or fi gure of merit, of the response of the cavity. This is defi ned as the ratio of 2 π times the maximum microwave energy stored in the cavity to the energy dissipated per cycle, and implies that Q will increase with the cavity volume for a fi xed frequency. It also means that Q will be increased by reducing the energy losses from currents fl owing in the cavity walls or in the sample. Thus, Q can be maximized by heavy silver plating, the further deterioration of which can be prevented by an additional thin gold plating. Q is also reduced if a sample with a high dielectric constant (e.g., an aqueous sample) extends into the regions of appreciable electric fi eld. In order to reduce the fractional refl ection of microwave energy from the cavity, and at the same time to increase the fractional change in the refl ected power, an iris – a small hole at the entrance port to the cavity – is used. This is accomplished with an adjust-able screw, the setting of which depends on the size and nature of the sample in the cavity. In this way, standing waves are formed due to discontinuities in the waveguide, or to an imperfect matching of microwave elements, from areas other than the cavity, and this causes a decrease in the sensitivity of the spectrometer. In order to minimize such effects, a small metallic probe known as a slide - screw tuner is used to produce standing waves of such amplitude and phase as to mini-mize the existing standing waves, by varying its depth of insertion and position along the waveguide. In order to attenuate any microwaves traveling in the reverse direction, a circulator (a nonreciprocal device) is used. This passes the microwaves in the forward direction with little loss, but strongly attenuates any microwaves traveling in the reverse direction. Thus, the microwaves are directed to the cavity and the signal is refl ected from the cavity to the detector. If a reduction in the size of the resonator is desired, a dielectric resonator can be used in which the wave-length is considerably shorter than that in the free space. Alternatively, a different type of structure can be used, such as a split - ring or loop - gap resonator. Size reduc-tion is important both at lower frequencies and for pulsed EPR at X - band, where an enhanced microwave magnetic fi eld ( B 1 ) is required.
1.3.2.4 Magnetic Field System The magnet used at X - band is an electromagnet, consisting of two Helmholtz coils with suffi cient space between the pole pieces to house the resonator. The magnetic fi eld should be stable and uniform over the sample, with a stability of better than ± 10 mG for organic free radicals in liquid solution and ∼ 1 G for most inorganic
8 1 Introduction
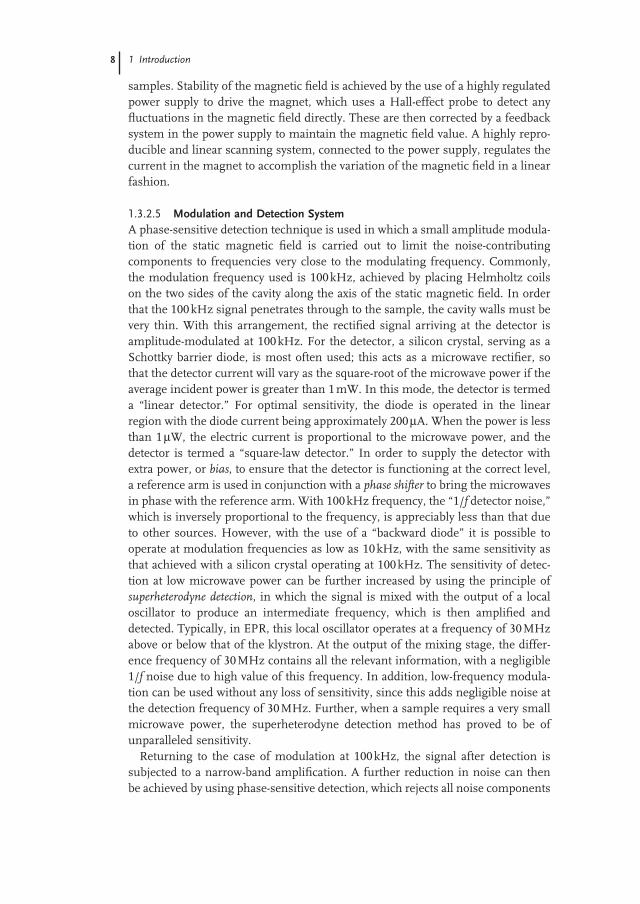
samples. Stability of the magnetic fi eld is achieved by the use of a highly regulated power supply to drive the magnet, which uses a Hall - effect probe to detect any fl uctuations in the magnetic fi eld directly. These are then corrected by a feedback system in the power supply to maintain the magnetic fi eld value. A highly repro-ducible and linear scanning system, connected to the power supply, regulates the current in the magnet to accomplish the variation of the magnetic fi eld in a linear fashion.
1.3.2.5 Modulation and Detection System A phase - sensitive detection technique is used in which a small amplitude modula-tion of the static magnetic fi eld is carried out to limit the noise - contributing components to frequencies very close to the modulating frequency. Commonly, the modulation frequency used is 100 kHz, achieved by placing Helmholtz coils on the two sides of the cavity along the axis of the static magnetic fi eld. In order that the 100 kHz signal penetrates through to the sample, the cavity walls must be very thin. With this arrangement, the rectifi ed signal arriving at the detector is amplitude - modulated at 100 kHz. For the detector, a silicon crystal, serving as a Schottky barrier diode, is most often used; this acts as a microwave rectifi er, so that the detector current will vary as the square - root of the microwave power if the average incident power is greater than 1 mW. In this mode, the detector is termed a “ linear detector. ” For optimal sensitivity, the diode is operated in the linear region with the diode current being approximately 200 μ A. When the power is less than 1 μ W, the electric current is proportional to the microwave power, and the detector is termed a “ square - law detector. ” In order to supply the detector with extra power, or bias , to ensure that the detector is functioning at the correct level, a reference arm is used in conjunction with a phase shifter to bring the microwaves in phase with the reference arm. With 100 kHz frequency, the “ 1/ f detector noise, ” which is inversely proportional to the frequency, is appreciably less than that due to other sources. However, with the use of a “ backward diode ” it is possible to operate at modulation frequencies as low as 10 kHz, with the same sensitivity as that achieved with a silicon crystal operating at 100 kHz. The sensitivity of detec-tion at low microwave power can be further increased by using the principle of superheterodyne detection , in which the signal is mixed with the output of a local oscillator to produce an intermediate frequency, which is then amplifi ed and detected. Typically, in EPR, this local oscillator operates at a frequency of 30 MHz above or below that of the klystron. At the output of the mixing stage, the differ-ence frequency of 30 MHz contains all the relevant information, with a negligible 1/ f noise due to high value of this frequency. In addition, low - frequency modula-tion can be used without any loss of sensitivity, since this adds negligible noise at the detection frequency of 30 MHz. Further, when a sample requires a very small microwave power, the superheterodyne detection method has proved to be of unparalleled sensitivity.
Returning to the case of modulation at 100 kHz, the signal after detection is subjected to a narrow - band amplifi cation. A further reduction in noise can then be achieved by using phase - sensitive detection, which rejects all noise components
1.3 Typical X-Band, Low-, and High-Frequency Spectrometers 9
except those in a very narrow band ( ∼ ± 1 Hz), about 100 kHz. Basically, in this technique, the amplifi ed signal is mixed with the output of the modulating 100 kHz oscillator. Then, if the two are exactly in phase the output from the unit will be a maximum, but if they are opposite in phase then the output will be a minimum. The output of the detected 100 kHz signal is approximately proportional to the slope of the absorption curve at the mid - point of the modulating fi eld, provided that the amplitude of the modulation is small compared to the linewidth. The sign of the slope determines the output polarity of the phase - sensitive detector. As a consequence, when the amplitude of modulation is small, the output signal resem-bles the fi rst derivative of the absorption signal, with the line shape becoming distorted for large modulation amplitudes approaching the linewidth. The time constant of the circuit fi ltering the output affects the noise of level of the signal; notably, the noise becomes less for larger time constants.
1.3.3 EPR Line Shapes and Determination of Signal Intensity
Two types of line shape are usually observed in EPR – Lorentzian and Gaussian – in which the line shapes are expressed as y = a /(1 + bx 2 ) and y = a exp( – bx 2 ), respectively, where y and x represent, respectively, the EPR signal and the mag-netic fi eld. The intensity of the fi rst - derivative absorption signal is proportional to ′Y Bmax pp( )Δ 2, where 2 ′Ymax is the peak - to - peak derivative amplitude and Δ B pp is the peak - to - peak width. Gaussian line shapes are produced when there occurs super-position of many components, known as inhomogeneous broadening . On the other hand, if there is no variation of the parameters determining the line shape from one spin to another spin, one observes a Lorentzian line shape, referred to as homogeneous broadening . The half of the Lorentzian linewidth at half height, Γ , is related to the relaxation time T 2 , as follows (Wertz and Bolton, 1792, pp. 196 – 197): 1 2/T e= κ γ Γ, where κ is a constant that depends on the line shape, and γ e is the electron magnetogyric ratio.
1.3.4 Low - Frequency Spectrometers
The differences in CW - EPR spectrometer design at frequencies lower than that at X - band, described above, are listed as follows. The frequency range of these spec-trometers is anywhere from ∼ 250 MHz to ∼ 4 GHz.
• Source of radiation: The selection of a microwave, or a radiofrequency, source is made based on consideration of the phase noise and the ability to control the source frequency with an automatic frequency control system. No EPR spectrometer recently described has used a klystron in the L (1 GHz) - and S (4 GHz) - bands, as these cavity - stabilized oscillators used earlier are no longer available. Some sources currently in use are: super - regenerative fi eld - effect transistor ( FET ) oscillator, signal generator, microwave oscillator, phase - locked crystal oscillator.
10 1 Introduction
• Transmission: In most cases, a coaxial cable is used for the transmission of waves at low frequencies.
• Resonators and sensitivity: At low frequencies, more compact devices – such as coaxial cavities, helices, and coaxial cavity containing a helix – are used rather than cylindrical or rectangular cavities, as their sizes become very large. These include: (i) a strip - line resonator, consisting of a center conductor and ground plates; (ii) a lumped - circuit resonator; (iii) a loop - gap resonator ( LGR ); (iv) a single - turn solenoid; (v) a tuned one - loop – two - gap bridged LGR; and (vi) a surface - coil resonator. Finally, the size of the resonator can be signifi cantly reduced by using a dielectric resonator, in which the wavelength is consider-ably shorter than that in the free space. As for the sensitivity, it is noted that if the sample is unlimited, and if the lossiness is not important, then the signal - to - noise ratio ( SNR ) is enhanced at lower frequencies (Eaton and Eaton, 1988a).
• Magnetic fi eld: In the frequency range 1 – 9 GHz, standard EPR iron - core magnets are used. Field control is used in iron - core and/or iron - yoke magnets, whereas current control can be used only for air - core magnets. Other sources of magnetic fi eld that have been used at low frequencies include solenoid and Helmholtz - type coils.
• Detectors: At low frequencies, the detectors used are normally crystals or double - balanced mixers.
1.3.5 High - Frequency Spectrometers
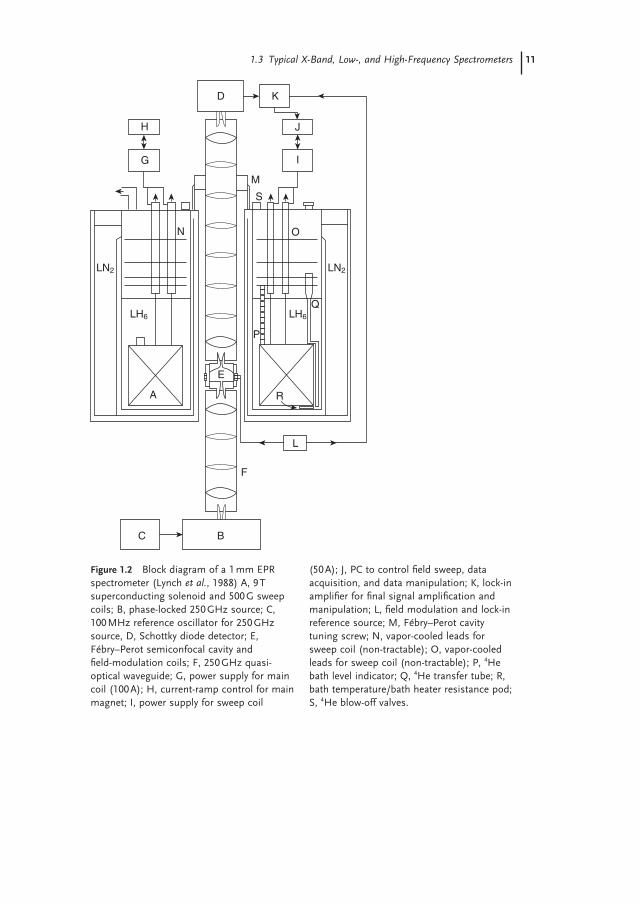
The various frequency ranges considered here – which often are referred to as “ submillimeter waves ” – are greater than or equal to 95 GHz, or the wavelengths are less than or equal to 2.5 mm. The block diagram of a 1 mm EPR spectrometer is shown in Figure 1.2 (Lynch et al. , 1988). As compared to X - band, the following differences are noted for the various components of an EPR spectrometer at high frequencies.
1.3.5.1 Sources of Radiation The sources currently in use are described as follows:
• Gunn diodes and multipliers: These are semiconductor devices, which produce microwave radiation, maintained by a resonant cavity coupled to the device. They are usually mounted on a single - mode waveguide, generating the output in a well - defi ned mode. The maximum frequency that can be produced is about 140 GHz, with the output power varying from about 500 mW at 10 GHz to 60 mW at 140 GHz. In order to produce higher frequencies, frequency multipli-ers can be used; this is achieved with Schottky diodes. However, the power falls rather rapidly with multiplication in accordance with the power loss being of the order of 25 log( N ) dB, where N is the order of the harmonic to be gener-ated. This reduces the power typically by 7.5 dB (16%) and 17.5 dB (1.8%) for
1.3 Typical X-Band, Low-, and High-Frequency Spectrometers 11
Figure 1.2 Block diagram of a 1 mm EPR spectrometer (Lynch et al. , 1988) A, 9 T superconducting solenoid and 500 G sweep coils; B, phase - locked 250 GHz source; C, 100 MHz reference oscillator for 250 GHz source, D, Schottky diode detector; E, F é bry – Perot semiconfocal cavity and fi eld - modulation coils; F, 250 GHz quasi - optical waveguide; G, power supply for main coil (100 A); H, current - ramp control for main magnet; I, power supply for sweep coil
(50 A); J, PC to control fi eld sweep, data acquisition, and data manipulation; K, lock - in amplifi er for fi nal signal amplifi cation and manipulation; L, fi eld modulation and lock - in reference source; M, F é bry – Perot cavity tuning screw; N, vapor - cooled leads for sweep coil (non - tractable); O, vapor - cooled leads for sweep coil (non - tractable); P, 4 He bath level indicator; Q, 4 He transfer tube; R, bath temperature/bath heater resistance pod; S, 4 He blow - off valves.
H
G
D K
J
I
M
S
O
Q
LN2
LH6 LH6
LN2
N
A
E
C B
F
L
R
P
12 1 Introduction
the second and fi fth harmonics, respectively. The noise of these harmonics is quite acceptable, when used as sources of radiation in EPR. Related to the Gunn diode is the IMPATT (Impact Ionization Avalanche Transit Time Mode) device, which produces a higher power but accompanied by a higher noise. The IMPATT is commonly used as an injection - locked amplifi er.
• Molecular gas lasers: These have also been used as sources for millimeter waves in EPR. They consist of a laser cavity with a length of the order of 1.5 m, fi lled with molecular gas at a medium pressure (ca. 0.1 – 1.0 mbar). The cavity is a metallic or a dielectric tube that is fi tted with mirrors at the two ends, contains the gas, and serves as an oversized waveguide. The gas is excited by a tunable single - mode CO 2 laser with a wavelength of about 10 μ m and a power of the order of 50 W. Coupling out of the laser is achieved through a hole in one of the mirrors, but the mode is not always well defi ned. The actual laser action takes place between the rotational levels of the gas; the frequencies produced here are discrete, and therefore cannot be changed or locked to an external frequency source. The effi ciency increases with frequency, and good power levels can be obtained in the range of 200 to 2000 GHz. A major concern here is that of stability, as the system requires rather long warm - up times. Although the 1/ f noise is quite high, it is better or equal to that of a Gunn diode at fre-quencies higher than 10 – 20 kHz.
• Backward - wave oscillators (carcinotrons): These are related to traveling - wave tubes. The microwaves are produced here as a result of the bunching of elec-trons generated in an electron gun, as in a klystron. The power available here is higher than that produced by a Gunn diode, but the noise is higher. The frequencies available range from about 30 GHz to 1000 GHz, but the lifetime is rather limited to about 2000 h. It should be noted that similar devices, such as the extended interaction oscillator and the Orotron, operate on the principle of bunching of electrons to produce microwaves.
• Gyrotrons: Here, the bunching of electrons is accomplished by cyclotron reso-nance. This results in a very high effi ciency and very high power levels of the order of 200 W. The magnetic fi elds required for the operation of gyrotrons are of the same order of magnitude as those required for EPR, which makes the devices bulky and expensive. They can be injection - locked, but are noisy in operation.
1.3.5.2 Transmission of Submillimeter Waves It is possible to use either oversized (or corrugated) waveguides, or free space for the transmission of high - frequency microwaves.
• Waveguides: As with the single - mode waveguides, the resistive losses at W - band (95 GHz) are 16 dB m − 1 , whereas they are 21 dB m − 1 at 300 GHz. Thus, taking into account the fact that the power levels at frequencies of 95 GHz and higher are rather low, such losses are unacceptable; this makes the use of single - mode waveguides impractical at these frequencies over large distances. A solution is to use oversized, rather than single - mode, waveguides, for which
1.3 Typical X-Band, Low-, and High-Frequency Spectrometers 13
the losses are much smaller. Thus, X - band waveguides can be used for which the attenuation will still increase with frequency, but at a much smaller rate, proportional to ν 1/2 . The use of all elements susceptible of exciting higher modes, and not just a straight waveguide, should be avoided; however, single - mode waveguides are still required for bends and turns. In some applications, it is not necessary to have a well - defi ned mode, in which case shelf brass pipes can be used. These are practical, cheap, and capable of accommodating a wide range of frequencies, with losses of the order of 2 – 3 dB m − 1 . Recently, corru-gated waveguides have been used in EPR (Smith et al. , 1998); these are a special form of oversized waveguide, that consist generally of a circular metallic waveguide having corrugations of the order of λ /4 width and depth. Such waveguides behave like dielectric waveguides, with the principal mode EH 11 . As a result, the losses may be as small as about 0.1 dB m − 1 .
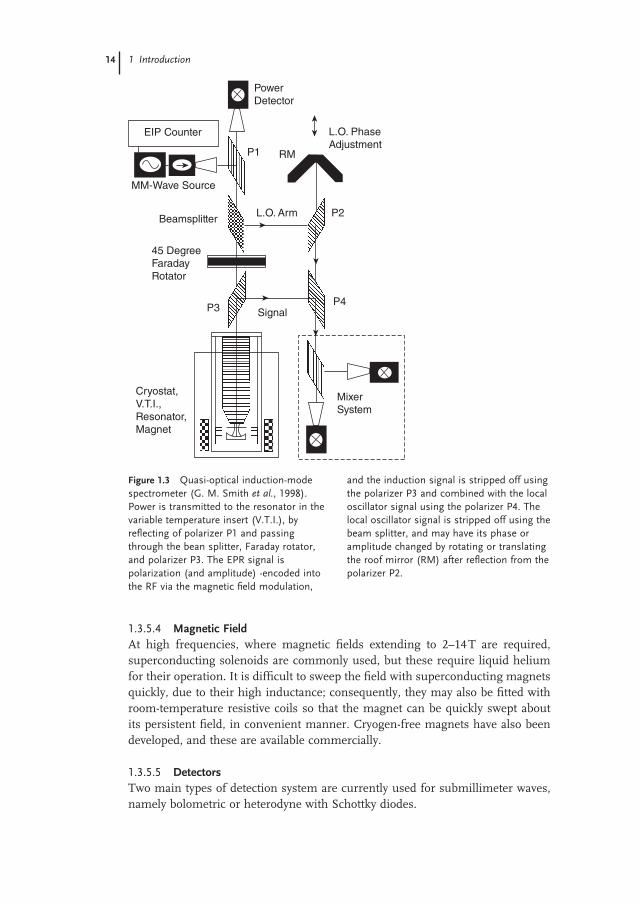
• Free space: Attenuation is zero in vacuum, and very small in free space. As the divergence of radiation in this case is appreciable, it is necessary to keep the beam contained; this can be accomplished by using conventional optics with lenses and elliptical mirrors, referred to as “ quasi - optics . ” Horns can be used for conversion from single - mode or corrugated waveguides to free - space propa-gation, using optical elements such as mirrors, lenses, and polarizers to act on the beam. The optical equations used in this context are described by Gaussian beam - mode optics. The schematics of a quasi - optical induction - mode spec-trometer are shown in Figure 1.3 (Smith et al. , 1998).
1.3.5.3 Resonators and Sensitivity The resonator used preferentially in VHF ( ∼ 250 – 360 GHz) EPR is the F é bry – Perot resonator. This has the advantage of having an open structure, which makes it accessible for optical excitation, and its Q - factor is typically of the order of 2000 – 3000. The F é bry – Perot resonator can support two orthogonal modes, refl ection and induction; thus, it serves as a bimodal cavity. Its main advantages are a small fi lling factor and critical sample loading. Although this type of resonator has been initially used at 95 GHz, it has now been largely replaced by a cylindrical TE 011 cavity, which is diffi cult to fabricate at this frequency, as it is very small. Finally, it may be pos-sible not to use any cavity at all; whilst this option reduces the absolute sensitivity, it still provides an acceptable sensitivity when an appropriately concentrated sample is used. The absolute sensitivity depends on frequency as ν 11/4 , assuming constant B 1 , a constant sample size, taking into account the fact that the resonator size is inversely proportional to frequency, and considering only resistive losses in the cavity. Thus, as the sample size for the same resonator type decreases with frequency, the concentration sensitivity remains almost independent of frequency, and actually decreases at a higher frequency. In fact, in some cases, the use of a cavity at high frequencies does not have any signifi cant advantage over a system without a cavity. [It should be noted that, whilst this information was obtained concisely from Biological Magnetic Resonance , vol. 22 (2004), many important details have been omitted; the same volume should be consulted to obtain precise data.]
14 1 Introduction
1.3.5.4 Magnetic Field At high frequencies, where magnetic fi elds extending to 2 – 14 T are required, superconducting solenoids are commonly used, but these require liquid helium for their operation. It is diffi cult to sweep the fi eld with superconducting magnets quickly, due to their high inductance; consequently, they may also be fi tted with room - temperature resistive coils so that the magnet can be quickly swept about its persistent fi eld, in convenient manner. Cryogen - free magnets have also been developed, and these are available commercially.
1.3.5.5 Detectors Two main types of detection system are currently used for submillimeter waves, namely bolometric or heterodyne with Schottky diodes.
Figure 1.3 Quasi - optical induction - mode spectrometer (G. M. Smith et al. , 1998). Power is transmitted to the resonator in the variable temperature insert (V.T.I.), by refl ecting of polarizer P1 and passing through the bean splitter, Faraday rotator, and polarizer P3. The EPR signal is polarization (and amplitude) - encoded into the RF via the magnetic fi eld modulation,
and the induction signal is stripped off using the polarizer P3 and combined with the local oscillator signal using the polarizer P4. The local oscillator signal is stripped off using the beam splitter, and may have its phase or amplitude changed by rotating or translating the roof mirror (RM) after refl ection from the polarizer P2.
EIP Counter
Power
Detector
MM-Wave Source
Beamsplitter
45 DegreeFaraday
Rotator
Cryostat,
V.T.I.,
Resonator,
Magnet
MixerSystem
Signal
L.O. Arm
RM
L.O. Phase
AdjustmentP1
P2
P3P4
1.4 Applications of EPR 15
• Bolometric detectors: Although these operate over a large frequency range, they are not suitable for pulsed EPR, as they possess a small bandwidth. The various bolometers in use are: (i) Ge/Ga, Si bolometers, which have a high sensitivity but possess a small bandwidth of only 300 Hz; and (ii) InSb hot - electron bolom-eters, which operate over the range 50 to 1500 GHz, with a bandwidth of 1 MHz. These can also be used as homodyne mixers.
• Schottky diodes: These are suitable for heterodyne detection, and possess a bandwidth of greater than 1 GHz.
1.3.6 Pertinent Literature
Details on EPR spectrometers are found in the following references:
X - band spectrometers
• J. Pilbrow, Transition Ion Electron Paramagnetic Resonance , Clarendon Press, Oxford (1990);
• J.E. Wertz and J.R. Bolton, Electron Spin Resonance: Elementary Theory and Practical Applications , Mc - Graw Hill, New York (1972);
• C.P. Poole, Jr, Electron Spin Resonance: A Comprehensive Treatise on Experimen-tal Techniques , Wiley - Interscience, New York (1983);
• R.S. Alger, Electron Paramagnetic Resonance: Techniques and Applications , Wiley - Interscience, New York (1966).
Low - frequency spectrometers A review with detailed list of references is provided by G.R. Eaton and S.S. Eaton,
EPR Spectrometers at frequencies below X - band, in Biological Magnetic Reso-nance , vol. 21 , EPR Instrumental Methods (eds C.J. Bender and L.J. Berliner), Kluwer Academic/Plenum Publishers, New York (2004), p. 59.
High - frequency spectrometers A good outline is provided by J. van Tol, in Multi - frequency EPR Workshop , 29 July
2001 (unpublished); see also Very High Frequency ( VHF ) ESR/EPR, in Biologi-cal Magnetic Resonance , vol. 22 (eds O. Grinberg and L.J. Berliner), Kluwer Academic/Plenum Publishers, New York (2004), which contains a number of review articles.
1.4 Applications of EPR
EPR is used to determine the electronic structure of free radical, transition - metal and rare - earth ions, to study the interaction between molecules, and to measure nuclear and electronic magnetic moments. It has some key advantages over NMR, because the electron has a much greater magnetic moment than a nucleus, and is thus more sensitive per spin. In time - domain experiments, such as free - induction
16 1 Introduction
decays, spin - echoes, or 2 - D spectroscopy, the time scale in EPR is nanoseconds as compared to milliseconds for NMR. Being sensitive to materials containing even trace amounts of paramagnetic ions, EPR fi nds applications in the fi elds of physics, chemistry, biology, medicine, archeology, geology, mineralogy, radiation damage, and radiation dosimetry, among others. Apart from the applications described below, particular mention is made here of the topics included in Part Three of this book, which describes some applications of EPR. These are:
• The precise determination of fi ne - and hyperfi ne - structure spin - Hamiltonian parameters, especially large zero - fi eld splitting ( ZFS ) parameters and elements of �g2 - tensors using high - frequency EPR.
• The study of copper - coordination environments.
• Measurements of relaxation times.
• Chemically induced dynamic nuclear polarization, dynamic electron polariza-tion, and dynamic nuclear polarization.
• The study of nanomaterials.
• Microscopic quantum tunneling and single - molecule magnets.
Some features of EPR relevant to its applications are briefl y described as follows. EPR spectra in single crystals, containing small concentrations of paramagnetic ions substituting for regular diamagnetic ions, provide the maximum amount of information. Such spectra, which consist of numerous lines, change with the orientation of the magnetic fi eld with respect to the crystal axes, and are thus anisotropic . The presence of numerous lines in the EPR spectra is due to the inter-actions of the orbital moments of electrons with the electric potential due to the local atoms surrounding the electrons, as well as to hyperfi ne interactions between the paramagnetic electrons and nuclear magnetic moments of the paramagnetic ions and surrounding atoms. On the other hand, organic molecules, containing small fractions of free radicals produced by ionizing radiation, also provide detailed information from their spectra. Symmetric (or nearly symmetric) characteristic hyperfi ne patterns are observed in the case of free radicals. The electron distribu-tion throughout a molecule may be determined from a knowledge of hyperfi ne interactions with nuclei, the spins and magnetic moments of which are known. In addition, structural information may be deduced from EPR spectra, since hyperfi ne interactions vary as the inverse of the cube of the distance between the center of the free radical and the nucleus. The changes in magnitude of the hyper-fi ne splitting and g - shift have been used to monitor features of local surroundings, such as its polarity. Furthermore, unpaired electron spins from different nitrox-ides, either on the same or on different molecules, interact weakly through long - range magnetic dipolar interactions, or strongly through short - range Heisenberg spin - exchange interactions. These latter interactions have been used in fl uid media to monitor microscopic translational dynamics. Dipolar interactions have been used in frozen or very viscous media to measure distances, either with CW - EPR or pulsed EPR, especially in two dimensions, such as 2 - D ELDOR, which is very
1.4 Applications of EPR 17
sensitive to translational and rotational motions. This is because 2 - D ELDOR also supplies off - diagonal (cross) peaks that directly report on the translational and rotational motions of labeled biomolecules. On the other hand, DQC is a new and powerful application of pulsed EPR for distance measurements between interact-ing spins in frozen samples. Thus, distances can be measured to 8 nm, comparable to the capabilities of the FET technique. The EPR spectra of transition - metal ions and rare - earth ions exhibit a much greater anisotropy than that exhibited by free radicals, because the former possess intrinsic anisotropy of the electron magnetic moments, and experience additional interactions when there are present more than one unpaired electron in the unfi lled electronic shells. In solutions, the EPR spectra of free radicals can become quite simple due to motional averaging; only in the extreme case in which all anisotropies are fully averaged will the high - fi eld limit be satisfi ed and no overlap of transitions occur. At temperatures intermediate to room temperature, however, where rapid motional averaging of the EPR spec-trum takes place, and/or at the freezing point of the solution, where a powder - like spectrum is observed, information can be obtained from EPR spectra regarding slow molecular motions. Moreover, the spectra change dramatically as the tum-bling motion of the probe slows, which in turn results in a great sensitivity to fl uidity in the neighborhood of the spin probe. This is especially important for nitroxide spin labels that have been attached selectively to different parts of mac-romolecules, such as the components of natural and synthetic phospholipid mem-branes, liquid crystals and proteins. Important structural and functional information can be obtained from such measurements in this way.
In physics, EPR has been exploited to provide a theoretical basis for studying the modifi cation of electronic structures by the surrounding atoms. To this end, the diamagnetic host crystals can be doped with paramagnetic impurities, such as transition - metal or rare - earth ions. In particular, it is possible to study phase tran-sitions in solids, and the interactions that exist in pairs and triads of paramagnetic ions. Studies of other topics in physics to which EPR has been applied include superparamagnetism, ferro - and antiferro - magnetism, susceptibility, semiconduc-tors, quantum dots, quantum wires, and defect centers.
In chemistry, EPR has been applied to characterize free radicals, to study organic reactions, and to investigate the electronic properties of paramagnetic inorganic molecules. All of this information can be exploited to understand molecular struc-ture. Studies of some other topics in chemistry to which EPR has been applied include reaction kinetics, organometallic compounds, and molecular magnets.
In biology, EPR has been used widely to study transition - metal ions (e.g., Cu, Mn, Ni, Co, Mo, Fe), as well as complexes in proteins (enzymes), nitroxide spin labels attached to cysteine or nucleic acids, enzyme reactions, protein folding, amino acid radicals of the protein backbone (e.g., tyrosine, tryptophan, and glycine), hemes and FeS clusters in electron - transfer reactions in protein, and the dynamics of proteins, protein - bound cofactor radicals (e.g., semiquinones and fl avins), and radicals produced during reaction processes in proteins and other biomolecules. Special reagents have been developed to study spin - label molecules of interest, that are of special interest in biology. Specifi cally designed nonreactive
18 1 Introduction
radical molecules can be attached to specifi c sites in a biological cell; this is termed site - directed spin labeling , whereby the EPR spectra of these spin labels, or spin probes, can provide information on their environments. Currently, more than 20 proteins that function in the mitochondrial respiratory chains of mammals have been identifi ed using EPR, and this has been invaluable in elucidating the details of their electron - transfer processes. In order to increase the natural concentration of free radicals in cells to levels detectable with EPR, the cells can be subjected to irradiation or ionizing radiation, or rendered unstable by lowering their tempera-ture. The nitroxide radical (NO · ), in which an electron is delocalized between N and O atoms, produces EPR spectra the shapes of which are sensitive to the viscos-ity, polarity, and structure of the surrounding media. Thus, nitroxide radicals have been used extensively as molecular probes; in this case, they are referred to as spin probes or spin labels , because they can be bound to proteins or lipids, so as to provide information concerning the local mobility of the polypeptide chain, liquid - crystal structure, and the mobility of lipids in biomembranes. EPR has also been applied in conjunction with site - directed spin labeling to study the structure and confor-mational dynamics of a wide range of systems, including high - molecular - weight soluble proteins, membrane proteins, nucleic acids, and nucleic acid – protein com-plexes (Hubbell et al. , 2000). The technique of spin trapping enables the detection of oxygen - generated active radicals, which is extremely important in biology. For this, a nitrone compound is allowed to interact with a free short - lived radical; the latter serves as a trap and is transformed into a spin adduct – a long - lived nitroxyl - like radical – the EPR spectrum of which has been shown to be unique for a given active radical or family of radicals. Based on their chemical nature, spin traps form two basic classes, namely nitrons compounds (e.g., C - phenyl - N - tert - butyl ; PBN ) and nitroso compounds (e.g., 5,5 - dimethyl - pirrolin - 1 - oxyl ; DMPO ). The rate of reaction with radicals, the stability of the formed spin adducts, and the variability in the spectra of spin adducts for the separate radicals each differ for the different spin traps. This, in turn, allows the precise identifi cation and determination of free radical types based on the EPR spectra of spin adducts, by using data banks that contain the parameters of EPR spectra of spin adducts. Recently, multifre-quency EPR at high magnetic fi elds has been exploited to obtain detailed informa-tion regarding the structure and dynamics of transient radicals and radical pairs that occur in biological electron and ion (electron) - transfer processes (Mobius et al. , 2005). In this manner, it is possible to acquire a much better understanding of the relationship between structure dynamics, and the function of molecular switches. Advanced EPR techniques are also able to provide the essential ingredi-ents of structure – function relationships for the electron - transfer intermediates of the photocycle. In addition to information obtained by EPR on photosynthetic reaction centers, that obtained for site - specifi cally, spin - labeled bacteriorhodospin proton pump and the colicin ion - channel forming toxin, represent the potential of high - frequency EPR ( HF - EPR ) in characterizing the key factors that control vectorial transfer process in proteins. An understanding of these factors is espe-cially important for the molecular engineering community, to modulate such transfer processes by the desired point mutations. Interdisciplinary applications
1.4 Applications of EPR 19
of EPR have also been made to investigate photosynthetic systems and transient paramagnetic chromophores in light - driven processes.
EPR imaging ( EPRI ) is the spatial discrimination, in one to three spatial dimen-sions, of EPR signals due to paramagnetic species. Thus, it can be used to image the distribution of paramagnetic centers in solids, the spatial degradation of poly-mers, and spin - trapped endogenous free radicals either in vitro or in vivo . Further, by using stable paramagnetic molecules or particles as probes, such parameters as oxidation status, pH and oxygen concentration in biological samples and living animals can be determined by using EPRI. The biomedical applications of EPRI can be listed as: (i) EPRI of skin; (ii) whole - body in - vivo imaging of exogenous nitroxide probes; (iii) assessment of oxidative stress or redox status; (iv) imaging of nitroxide generation in vivo ; (v) imaging of oxygen concentrations; and (vi) imaging of free radicals in plants.
The nonbiological applications of EPR may be listed as follows: (i) the study of polymer degradation; (ii) imaging of the distribution of the paramagnetic center diamond, including the defects formed by radiation damage; and (iii) the spatial study of radiation dosimetry.
It should be noted that the oxygen molecule, in being paramagnetic, interacts with the nitroxide radical, making its EPR spectrum broader; this forms the basis of biological oximetry , which can be carried out in vivo . Thus, it is possible to record three - dimensional ( 3 - D ) images of biological tissue, and to characterize changes in the transport and distribution of oxygen in liver, brain, and other organs of laboratory animals as a result of different pathology, or after drug treatment and/or surgery.
During recent years, new instrumentation has greatly enhanced the capability of EPR applications to study basic molecular mechanisms in membranes and proteins by using nitroxide spin labels, in particular with high - fi eld/HF - EPR and 2 - D Fourier transform EPR. Specifi c applications of this development have been made to accurately determine distances in biomolecules, to unravel details of the complex dynamics in proteins, to characterize the dynamic structure of membrane domains, and to discriminate between bulk lipids and boundary lipids that coat transmembrane peptides or proteins. Other applications have provided time reso-lution to studies of the functional dynamics of proteins.
EPR is very sensitive for the detection of free radicals and paramagnetic metal ions, which are intermediates or participants in many catalytic processes. Thus, EPR has been applied to the detection of paramagnetic intermediates on the surface of palladium catalysts during heterolytic hydrogenation reactions. In con-junction with spin trapping, EPR provides a convenient simple method for detect-ing hydrogen atoms generated by the dissociative chemiadsorption of hydrogen onto alumina - supported palladium catalysts ( < 0.4% Pd) at room temperature. The occurrence of deuterium/hydrogen spillover onto the alumina surface by H/D atom transfer to surface hydroxy groups has been demonstrated directly by using deuterium (D 2 ). Both, alkyl and aromatic free - radical intermediates formed at a catalyst surface have also been observed using EPR (for more details, see Carley et al. , 1994, as cited below).
20 1 Introduction
Other applications of EPR have included the studies of: metal clusters; colloids and interfaces; single - molecule magnets; coal, graphite, and fossil fuels; electro-chemically generated radical ions and complexes; ferromagnets, antiferromagnets, and superparamagnets; glasses and spin glasses; geological and mineralogical systems, as well as precious stones such as amethyst, beryl and chrisoberyl, diamond, emerald, opal, ruby, rock crystal ( α - quartz), sapphire, topaz, tourmaline, turquoise, and zircon; liquid crystals; point defects in semiconductors, such as alkali halides, oxides, and semiconductors; polymers; radiation damage and dating, and the irradiation of food; spin traps; and trapped atoms and molecules (a detailed listing is provided by Weil, 2007).
1.4.1 Pertinent Literature
The references cited below (each of which has the relevant applications listed in brackets) represent a typical selection of articles on the applications of EPR dis-cussed in this section. Whilst, by any means, this is not an exhaustive list, the references will provide access to much more information on this topic.
1.5 Scope of This Book
In accordance with the title of the book, the central theme here is multifrequency EPR. Thus, all chapters in the book are written in such a manner that they cover all aspects of multifrequency; this is highlighted particularly in Chapters 1 and 2 . Although a large majority of the material in this book is based on CW - EPR, a section on pulsed spectrometers is also included. Likewise, a chapter on pulsed EPR is also included in Part Two, which covers molecular motions and distance measurements, using the techniques of ELDOR, DQC, and DEER.
With regards to data tabulations, Part Three incorporates a review of multifre-quency relaxation data, while experimental multifrequency EPR considerations are discussed in Part One. One important topic of the book is the analysis of EPR data to evaluate spin - Hamiltonian parameters, and the simulation of EPR spectra for single crystals, powder, and amorphous samples in Part Two. To this end, spin - Hamiltonians appropriate to various point - group symmetries, and a listing of the matrix elements of spin operators is included. Some typical applications of EPR are described in detail in Part Three. Finally, cutting - edge topics in EPR and the future of EPR – which today is of particular importance – form the discussion in Part Four. In preparing this volume, every effort has been made to include listings of pertinent literature that is relevant to each topic, to provide the reader with access to the EPR literature at large. Notably, the book should provide a reasonably up - to - date coverage of the necessary multifrequency EPR background, pertinent literature, and research topics of current interest not only to graduate and post-doctoral students, but also to advanced research workers.
Further Reading 21
Acknowledgments
I am grateful to Professors C.P. Poole, Jr and Gareth Eaton for helpful comments to improve the presentation of the chapter, and to the Natural Sciences and Engi-neering Research Council ( NSERC ) of Canada for partial fi nancial support.
Further Reading
Beerton , K. and Stesmans , A. ( 2005 ) Q. Sci. Rev. , 24 , 223 . (EPR dating)
Berliner , L.J. (ed.) ( 1976 ) Spin Labeling – Theory and Applications , Academic Press , New York . (spin labels)
Berliner , L.J. (ed.) ( 1979 ) Spin Labeling II – Theory and Applications , Academic Press , New York . (spin labels)
Blank , A. , Dunnum , C.R. , Borbat , P.B. , and Freed , J.H. ( 2004 ) A three - dimensional electron spin resonance microscope . Rev. Sci. Instrum. , 75 , 3050 . (EPR microscopy)
Borbat , P.B. , Costa - Filho , A.J. , Earle , K.A. , Moscicki , J.K. , and Freed , J.H. ( 2001 ) Science , 291 , 206 . (membranes and proteins)
Bourgoin , J. and Lannoo , M. ( 1983 ) Point Defects in Semiconductors , Springer , Berlin . (semiconductors)
Buettner , G.R. ( 1987 ) Free Radical. Biol. Med. , 3 , 259 . (spin traps)
Bulthuis , J. , Hilbers , C.W. , and MacLean , C.M. ( 1972 ) NMR and ESR in liquid crystals , in Magnetic Resonance , vol. 4 (ed. C.A. McDowell ), MTP International Review of Science, Series One , Butterworths , London , p. 201 . (liquid crystals)
Calas , G. ( 1988 ) Rev. Mineral. (Spectrosc. Methods Miner. Geol.) , 18 , 513 . (geological systems)
Carley , A.F. , Edwards , H.A. , Mile , B. , Roberts , M.W. , Rowlands , C.C. , Hancock , F.E. , and Jackson , S.D. ( 1994 ) J. Chem. Sci. Faraday Trans. , 90 , 3341 . (free radicals on the surface of a catalyst)
Chumak , V.V. , Sholom , S.V. , Bakhnova , E.V. , Pasalskaya , L.F. , and Musijachenko , A.V. ( 2005 ) Appl. Radiat. Isotopes , 62 , 141 . (high - precision EPR dosimetry)
Clarkson , R.B. , Ceroke , P. , Norby , S. - W. , and Odinstov , B.M. ( 2003 ) Biol. Magn. Reson. , 18 , 233 . (use of particulate paramagnetic
materials in EPR oximetry: coals, lithium phthalocynine, and carbon chars) (coal and charcoal)
Crawford , J.H. , Jr and Slifkin , L.M. ( 1972 ) Point Defects in Solids , vol. 1 , Plenum Press , New York . (point defects in alkali halides and oxides)
Dinse , K. - P. ( 2000 ) Electron Paramagn. Reson. , 17 , 78 . (trapped atoms and molecules)
Eaton , G.R. , Eaton , S.S. , and Salikhov , K.M. (eds) ( 1997 ) Foundations of Modern EPR , World Scientifi c , Singapore . (this is a collection of articles, many of which deal with applications)
Foster , M.A. ( 1979 ) Magnetic Resonance in Medicine and Biology , Academic Press , New York . (biological applications)
Fraissard , P. and Resing , H.A. (eds) ( 1980 ) Magnetic Resonance in Colloid and Interface Science , Reidel , Hingham, MA, USA . (colloids)
Griscom , D.L. ( 1980 ) J. Non - Cryst. Solids , 40 , 211 . (glasses)
Halliwell , B. and Gooderidge , B. ( 1999 ) Free Radicals in Biology and Medicine , 3rd edn, Oxford University , Oxford . (nitroxides)
Hubbell , W.L. , Cafi sco , D.S. , and Altenbach , C. ( 2000 ) Nat. Struct. Biol. , 7 , 735 . (identifying conformational changes of proteins with site - directed spin - labeling)
Ikeya , M. ( 1989 ) Ann. Sci. , 5 , 5 . (dating and dosimetry)
Janzen , E.G. and Haire , D.L. ( 1990 ) Two decades of spin - trapping , in Advances in Free Radical Chemistry , vol. 1 (ed. D.D. Tanner ), JAI Press , Greenwich, CT, USA , pp. 253 – 295 . (spin traps)
Kennedy , T.A. ( 1981 ) Magn. Reson. Rev. , 7 , 41 . (semiconductors)
Kochirngsky , N. and Swartz , H. ( 1995 ) Nitroxide Spin Labels. Reactions in Biology and Chemistry , CRC Press . (nitroxides)
22 1 Introduction
Layadi , A. and Artman , J.O. ( 1997 ) J. Phys. D Appl. Phys. , 30 , 3312 . (ferromagnets)
Li , L. , Shi , Q. , Mino , M. , Yamazaki , Y. , and Imada , I. ( 2005 ) J. Phys. Condens. Matter , 17 , 2749 . (antiferromagnets)
Lurie , D.J. ( 2002 ) Techniques and applications of EPR imaging . Electron Paramagn. Reson. , 18 , 137 . (EPR imaging)
Marfunin , A.S. ( 1994 ) Advanced Mineralogy , Springer - Verlag , Germany . (mineralogy)
Mile , B. , Howard , J. , Histed , M. , Morris , H. , and Hampson , C.A. ( 1991 ) Faraday Discuss. , 92 , 129 . (clusters)
M ö bius , K. , Savitsky , A. , Schnegg , A. , Plato , M. , and Fuchs , M. ( 2005 ) Phys. Chem. Chem. Phys. , 7 , 19 . (biological systems: characterization of molecular switches for electron ion transfer)
Oshio , H. and Nakano , M. ( 2005 ) Chem. Eur. J. , 11 , 5178 . (high - spin single - molecule magnets)
Petrakis , L. and Fraissard , J.P. ( 1984 ) Magnetic Resonance: Introduction, Advanced Topics and Applications to Fossil Energy , NATO ASI series C124 , Reidel , Dordrecht, Netherlands . (clusters)
Poole , C.P. , Jr , Farach , H.A. , and Bishop , T.P. ( 1977 ) Magn. Reson. Rev. , 4 , 137 ; 4 , 225 (1977). (minerals)
Rhodes , C.J. ( 2000 ) Toxicology of the Human Environment – The Critical Role of Free Radicals , Taylor and Francis , London . (free radicals in biology and use of EPR)
Schlick , S. and Jeschke , G. ( 2004 ) Electron Spin Resonance , in Encyclopedia of Polymer Science and Engineering (ed. J.I. Kroschwitz ), Wiley - Interscience , New York , pp. 5 – 37 . (polymers)
Sharma , V.K. and Baiker , A. ( 1981 ) J. Chem. Phys. , 75 , 5596 . (super - paramagnets)
Symons , M. ( 1978 ) Chemical and Biological Aspects of Electron Spin Resonance Spectroscopy , John Wiley & Sons, Inc. , New York . (chemical and biochemical applications)
Wadhawan , J.D. and Compton , R.G. ( 2002 ) EPR Spectroscopy in Electrochemistry , in Encyclopedia of Electrochemistry , vol. 2 , Interfacial Kinetics and Mass Transport (eds A.J. Bard , M. Strassman , and E.J. Calvo ), Wiley - VCH Verlag GmbH , Weinheim, Germany , Sec. 3.2, pp. 170 – 220 . (electrochemical EPR)
Weil , J.A. ( 2000 ) A demi - century of magnetic defects in α - quartz , in Defects in SiO2 and Related Dielectrics: Science and Technology (eds G. Pacchioni , L. Skuja , and D.L. Griscom ), Kluwer Academic , Dordrecht, Netherlands , p. 197 ff . (point defects)
Weil , J.A. and Bolton , J.R. ( 2007 ) Electron Paramagnetic Resonance: Elementary Theory and Practical Applications , 2nd edn, John Wiley & Sons, Inc. , New York , pp. 414 – 421 . (a collection of references on various applications of EPR; some, but not all, of which are included here)
Wieser , A. and Regulla , D.F. ( 1990 ) Radiat. Prot. Dosim. , 34 , 291 . (EPR dosimetry)
Zitdinov , A.M. and Kainara , V.V. ( 2002 ) The nature of conduction ESR linewidth temperature dependence in Graphite , in EPR in the 21st Century (eds A. Kawamori , J. Yamauchi , and H. Ohta ), Elsevier , Amsterdam, Netherlands , pp. 293 – 297 . (graphite)