Embed Size (px)
Citation preview

41
P. Dimitrov / Tourism & Management Studies, Vol. 9, Issue 1 (2013) 41-47
Long-run forecasting of the number of the ecotourism arrivals in the municipality of Stambolovo, Bulgaria
Previsão de longo prazo do número de chegadas de ecoturistas no município de Stambolovo, Bulgária
Preslav Dimitrov
South-West University “Neofit Rilski”, Blagoevgrad, Bulgaria, [email protected]
ABSTRACT
Most of the Bulgarian rural municipalities need to back up their investment decisions in tourism infrastructure by preliminary analysis and forecasts. The present paper regards several major problems in the application of exponential smoothing methods for the purpose of the long-run forecasting for the needs of the mountainous municipality of Stambolovo, Bulgaria, such as: (i) the problem of determining the time series pattern; or the so-called “forecast profile”; (ii) the selection of a suitable forecasting method; (iii) Calculating of short-run and long-run forecasts; and (iv) the comparison of the results of the forecast techniques on the basis of the errors in the forecasts. A specially designed model for estimation of the weight coefficient needed for determining the size of the rural tourism and ecotourism sectors of this very same municipality, located near Bulgaria’s border with Greece and Turkey, is being presented.
Keywords: Forecasting, exponential smoothing, ecotourism.
RESUMO
A maioria dos municípios rurais búlgaros necessita de basear as suas decisões de investimento em infra-estrutura turísticas em análise preliminar e previsões. O presente trabalho aborda vários problemas na aplicação dos métodos de suavização exponencial com a finalidade de previsão de longo prazo para as necessidades do município montanhoso de Stambolovo, Bulgária, tais como: (i) o problema de determinar o padrão de séries temporais; ou o chamado "perfil de previsão", (ii) a seleção de um método de previsão adequado, (iii) Cálculo das previsões de curto prazo e de longo prazo, e (iv) a comparação entre os resultados das técnicas de previsão com base nos erros das previsões. Apresentamos aqui um modelo especialmente concebido para a estimativa do coeficiente de peso necessário para determinar o tamanho dos setores de turismo rural e ecoturismo deste mesmo município, localizado perto da fronteira da Bulgária com a Grécia e a Turquia.
Palavras-chave: Previsão, suavização exponencial, ecoturismo.
1. Introduction
Most of the Bulgarian rural municipalities located in the border regions with Greece and Turkey are facing the necessity to develop its tourism potential as a main and sometimes the only economic alternative to their feeble agricultural sectors. The investment decisions of the municipalities in this regard often need to be backed up by preliminary analysis and forecasts. This is especially valid for the business plans which have to be prepared by the municipalities for acquiring EU and central government funding for the construction of tourism information centres, hiking pathways and other tourism infrastructure.
The municipality of Stambolovo, Bulgaria is one of the numerous municipalities in the country struggling to provide alternative to the agriculture source of employment for its population. The municipality of Stambolovo is located in the
Haskovo region of Bulgaria and it has a territory of 277 sq. km. It is entirely situated in the most South-Eastern part of the Rodopi Mountains and it is some 22 km away from the regional centre of Haskovo. The municipality is also a part of the “Rodopi” tourism region (or the “Rodopi” tourism “locus” according to the Bulgarian Tourism Act), which was visited in 2009 by 8.6% and in 2010 by 10.5% of all the Bulgarians who had their summer vacation within the country. In 2010 the tourism region, to which the municipality of Stambolovo belongs, was visited by 13% of all the foreign tourists who visited Bulgaria in the summer tourism season (Graphic 1).
In the meantime, in 2011 the municipality of Stambolovo incidentally recorded 3184 night stays in the hotel accommodation structures on its territory. And if it is assumed that the average number of the tourists’ stay comprises two nights, mainly due to weekend trips undertaken to the municipality, one can estimate the average number of the tourism arrivals in the municipality of Stambolovo at some 1592 arrivals.
Graphic 1: The tourism regions of Bulgaria and the municipality of Stambolovo’s geographic situation
Source: Dimitrov, P. (2012), modification based on the data and map prepared by the Ministry of Economy,
Energy and Tourism of the Republic of Bulgaria
42
P. Dimitrov / Tourism & Management Studies, Vol. 9, Issue 1 (2013) 41-47
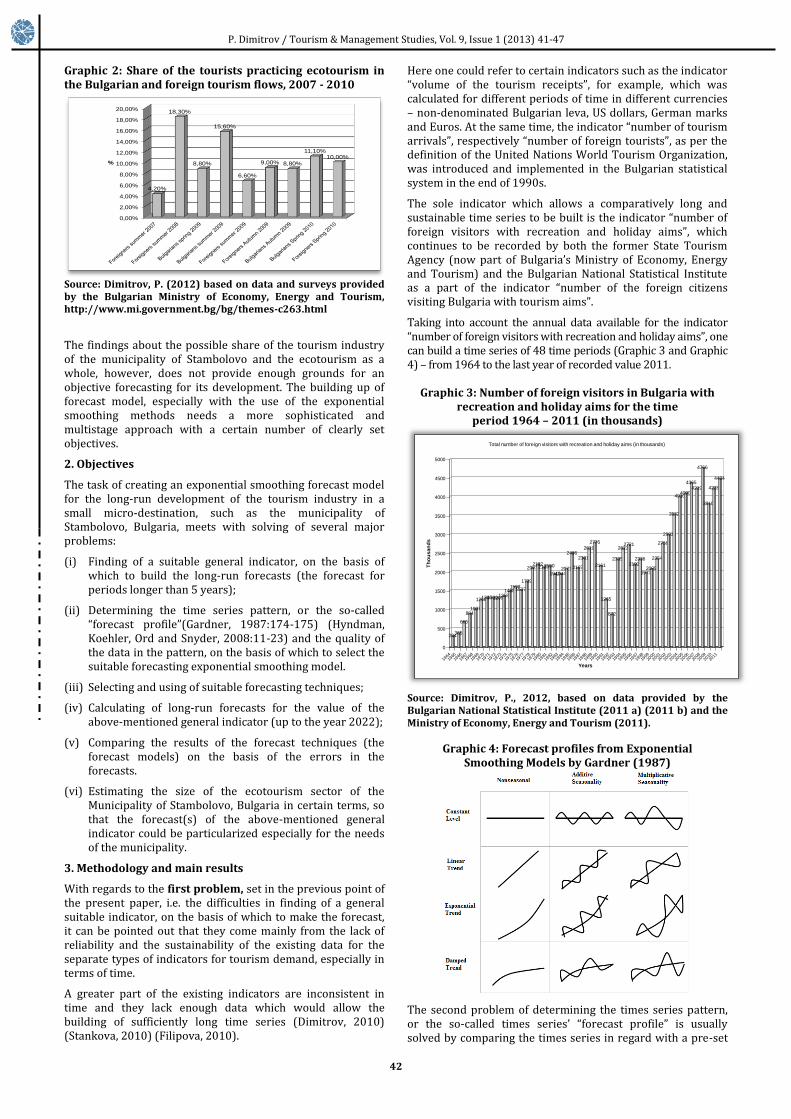
Graphic 2: Share of the tourists practicing ecotourism in the Bulgarian and foreign tourism flows, 2007 - 2010
Source: Dimitrov, P. (2012) based on data and surveys provided by the Bulgarian Ministry of Economy, Energy and Tourism, http://www.mi.government.bg/bg/themes-c263.html
The findings about the possible share of the tourism industry of the municipality of Stambolovo and the ecotourism as a whole, however, does not provide enough grounds for an objective forecasting for its development. The building up of forecast model, especially with the use of the exponential smoothing methods needs a more sophisticated and multistage approach with a certain number of clearly set objectives.
2. Objectives
The task of creating an exponential smoothing forecast model for the long-run development of the tourism industry in a small micro-destination, such as the municipality of Stambolovo, Bulgaria, meets with solving of several major problems:
(i) Finding of a suitable general indicator, on the basis of which to build the long-run forecasts (the forecast for periods longer than 5 years);
(ii) Determining the time series pattern, or the so-called “forecast profile”(Gardner, 1987:174-175) (Hyndman, Koehler, Ord and Snyder, 2008:11-23) and the quality of the data in the pattern, on the basis of which to select the suitable forecasting exponential smoothing model.
(iii) Selecting and using of suitable forecasting techniques;
(iv) Calculating of long-run forecasts for the value of the above-mentioned general indicator (up to the year 2022);
(v) Comparing the results of the forecast techniques (the forecast models) on the basis of the errors in the forecasts.
(vi) Estimating the size of the ecotourism sector of the Municipality of Stambolovo, Bulgaria in certain terms, so that the forecast(s) of the above-mentioned general indicator could be particularized especially for the needs of the municipality.
3. Methodology and main results
With regards to the first problem, set in the previous point of the present paper, i.e. the difficulties in finding of a general suitable indicator, on the basis of which to make the forecast, it can be pointed out that they come mainly from the lack of reliability and the sustainability of the existing data for the separate types of indicators for tourism demand, especially in terms of time.
A greater part of the existing indicators are inconsistent in time and they lack enough data which would allow the building of sufficiently long time series (Dimitrov, 2010) (Stankova, 2010) (Filipova, 2010).
Here one could refer to certain indicators such as the indicator “volume of the tourism receipts”, for example, which was calculated for different periods of time in different currencies – non-denominated Bulgarian leva, US dollars, German marks and Euros. At the same time, the indicator “number of tourism arrivals”, respectively “number of foreign tourists”, as per the definition of the United Nations World Tourism Organization, was introduced and implemented in the Bulgarian statistical system in the end of 1990s.
The sole indicator which allows a comparatively long and sustainable time series to be built is the indicator “number of foreign visitors with recreation and holiday aims”, which continues to be recorded by both the former State Tourism Agency (now part of Bulgaria’s Ministry of Economy, Energy and Tourism) and the Bulgarian National Statistical Institute as a part of the indicator “number of the foreign citizens visiting Bulgaria with tourism aims”.
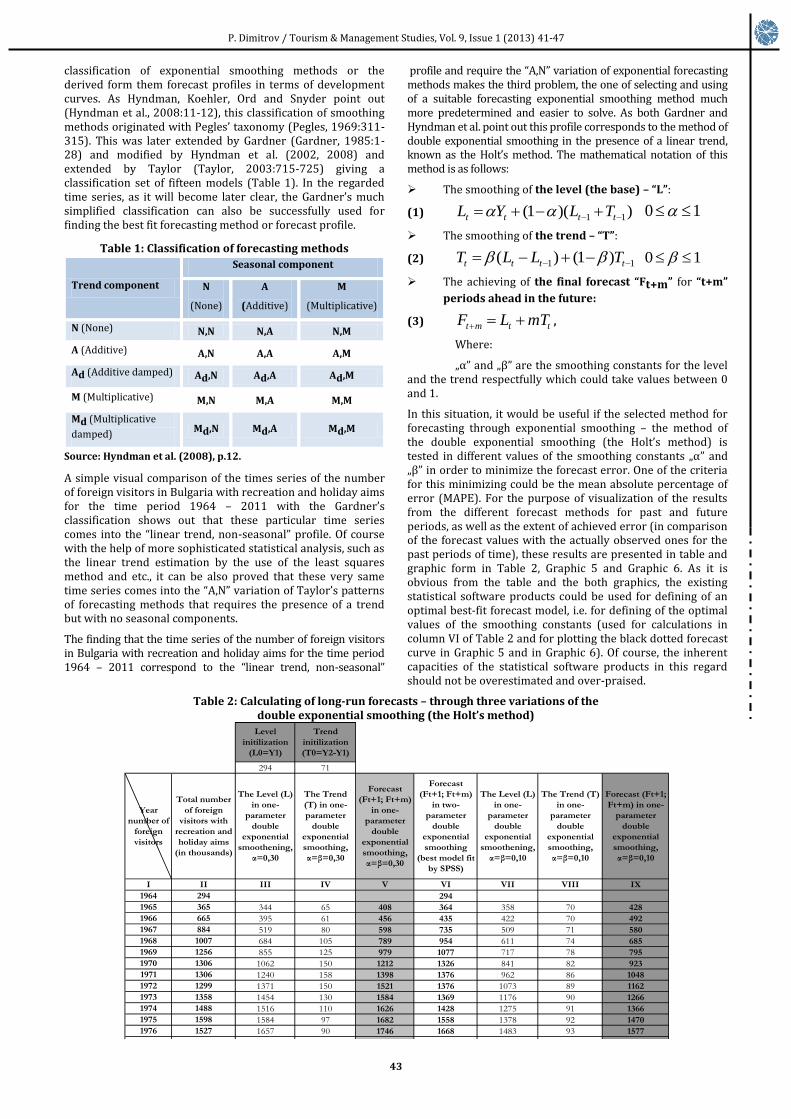
Taking into account the annual data available for the indicator “number of foreign visitors with recreation and holiday aims”, one can build a time series of 48 time periods (Graphic 3 and Graphic 4) – from 1964 to the last year of recorded value 2011.
Graphic 3: Number of foreign visitors in Bulgaria with recreation and holiday aims for the time
period 1964 – 2011 (in thousands)
Source: Dimitrov, P., 2012, based on data provided by the Bulgarian National Statistical Institute (2011 a) (2011 b) and the Ministry of Economy, Energy and Tourism (2011).
Graphic 4: Forecast profiles from Exponential Smoothing Models by Gardner (1987)
The second problem of determining the times series pattern, or the so-called times series’ “forecast profile” is usually solved by comparing the times series in regard with a pre-set
0,00%
2,00%
4,00%
6,00%
8,00%
10,00%
12,00%
14,00%
16,00%
18,00%
20,00%
4,20%
18,30%
8,80%
15,60%
6,60%
9,00% 8,80%
11,10%10,00%
%
294365
665
8841007
125613061306129913581488
15981527
1739
20972192
21252150
194219442077
2496
2107
2361
2619
2776
2161
1265
872
2335
26232721
21922336
19732085
2354
2756
2993
3532
40104090
43654219
4766
3810
4228
4484
0
500
1000
1500
2000
2500
3000
3500
4000
4500
5000
Th
ou
sa
nd
s
196419
6519
6619
6719
6819
6919
7019
7119
7219
7319
7419
7519
7619
7719
7819
7919
8019
8119
8219
8319
8419
8519
8619
8719
8819
8919
9019
9119
9219
9319
9419
9519
9619
9719
9819
9920
0020
0120
0220
0320
0420
0520
0620
0720
0820
0920
1020
11
Years
Total number of foreign visitors with recreation and holiday aims (in thousands)
43
P. Dimitrov / Tourism & Management Studies, Vol. 9, Issue 1 (2013) 41-47
classification of exponential smoothing methods or the derived form them forecast profiles in terms of development curves. As Hyndman, Koehler, Ord and Snyder point out (Hyndman et al., 2008:11-12), this classification of smoothing methods originated with Pegles’ taxonomy (Pegles, 1969:311-315). This was later extended by Gardner (Gardner, 1985:1-28) and modified by Hyndman et al. (2002, 2008) and extended by Taylor (Taylor, 2003:715-725) giving a classification set of fifteen models (Table 1). In the regarded time series, as it will become later clear, the Gardner’s much simplified classification can also be successfully used for finding the best fit forecasting method or forecast profile.
Table 1: Classification of forecasting methods
Trend component
Seasonal component
N
(None)
A
(Additive)
M
(Multiplicative)
N (None) N,N N,A N,M
A (Additive) A,N A,A A,M
Ad (Additive damped) Ad,N Ad,A Ad,M
M (Multiplicative) M,N M,A M,M
Md (Multiplicative
damped) Md,N Md,A Md,M
Source: Hyndman et al. (2008), p.12.
A simple visual comparison of the times series of the number of foreign visitors in Bulgaria with recreation and holiday aims for the time period 1964 – 2011 with the Gardner’s classification shows out that these particular time series comes into the “linear trend, non-seasonal” profile. Of course with the help of more sophisticated statistical analysis, such as the linear trend estimation by the use of the least squares method and etc., it can be also proved that these very same time series comes into the “A,N” variation of Taylor’s patterns of forecasting methods that requires the presence of a trend but with no seasonal components.
The finding that the time series of the number of foreign visitors in Bulgaria with recreation and holiday aims for the time period 1964 – 2011 correspond to the “linear trend, non-seasonal”
profile and require the “A,N” variation of exponential forecasting methods makes the third problem, the one of selecting and using of a suitable forecasting exponential smoothing method much more predetermined and easier to solve. As both Gardner and Hyndman et al. point out this profile corresponds to the method of double exponential smoothing in the presence of a linear trend, known as the Holt’s method. The mathematical notation of this method is as follows:
The smoothing of the level (the base) – “L”:
(1) ))(1( 11 tttt TLYL 10
The smoothing of the trend – “Т”:
(2) 11 )1()( tttt TLLT 10
The achieving of the final forecast “Ft+m” for “t+m”
periods ahead in the future:
(3) ttmt mTLF ,
Where:
„α” and „β” are the smoothing constants for the level and the trend respectfully which could take values between 0 and 1.
In this situation, it would be useful if the selected method for forecasting through exponential smoothing – the method of the double exponential smoothing (the Holt’s method) is tested in different values of the smoothing constants „α” and „β” in order to minimize the forecast error. One of the criteria for this minimizing could be the mean absolute percentage of error (MAPE). For the purpose of visualization of the results from the different forecast methods for past and future periods, as well as the extent of achieved error (in comparison of the forecast values with the actually observed ones for the past periods of time), these results are presented in table and graphic form in Table 2, Graphic 5 and Graphic 6. As it is obvious from the table and the both graphics, the existing statistical software products could be used for defining of an optimal best-fit forecast model, i.e. for defining of the optimal values of the smoothing constants (used for calculations in column VI of Table 2 and for plotting the black dotted forecast curve in Graphic 5 and in Graphic 6). Of course, the inherent capacities of the statistical software products in this regard should not be overestimated and over-praised.
Table 2: Calculating of long-run forecasts – through three variations of the double exponential smoothing (the Holt’s method)
Level
initilization
(L0=Y1)
Trend
initilization
(T0=Y2-Y1)
294 71
Year
number of
foreign
visitors
Total number
of foreign
visitors with
recreation and
holiday aims
(in thousands)
The Level (L)
in one-
parameter
double
exponential
smoothening,
α=0,30
The Trend
(T) in one-
parameter
double
exponential
smoothing,
α=β=0,30
Forecast
(Ft+1; Ft+m)
in one-
parameter
double
exponential
smoothing,
α=β=0,30
Forecast
(Ft+1; Ft+m)
in two-
parameter
double
exponential
smoothing
(best model fit
by SPSS)
The Level (L)
in one-
parameter
double
exponential
smoothening,
α=β=0,10
The Trend (T)
in one-
parameter
double
exponential
smoothing,
α=β=0,10
Forecast (Ft+1;
Ft+m) in one-
parameter
double
exponential
smoothing,
α=β=0,10
I II III IV V VI VII VIII IX
1964 294 294
1965 365 344 65 408 364 358 70 428
1966 665 395 61 456 435 422 70 492
1967 884 519 80 598 735 509 71 580
1968 1007 684 105 789 954 611 74 685
1969 1256 855 125 979 1077 717 78 795
1970 1306 1062 150 1212 1326 841 82 923
1971 1306 1240 158 1398 1376 962 86 1048
1972 1299 1371 150 1521 1376 1073 89 1162
1973 1358 1454 130 1584 1369 1176 90 1266
1974 1488 1516 110 1626 1428 1275 91 1366
1975 1598 1584 97 1682 1558 1378 92 1470
1976 1527 1657 90 1746 1668 1483 93 1577
1977 1739 1680 70 1750 1597 1572 93 1665
1978 2097 1747 69 1816 1809 1672 94 1766
1979 2192 1900 94 1994 2167 1799 97 1896
1980 2125 2054 112 2166 2262 1926 100 2025
1981 2150 2153 108 2262 2195 2035 101 2136
1982 1942 2228 98 2327 2220 2138 101 2239
1983 1944 2211 64 2275 2012 2209 98 2307
1984 2077 2176 34 2209 2014 2271 95 2366
1985 2496 2170 22 2192 2147 2337 92 2428
1986 2107 2283 49 2332 2566 2435 92 2527
1987 2361 2265 29 2294 2177 2485 88 2573
1988 2619 2314 35 2349 2431 2552 86 2638
1989 2776 2430 59 2489 2689 2636 86 2722
1990 2161 2575 85 2661 2846 2727 86 2814
1991 1265 2511 40 2551 2232 2748 80 2828
1992 872 2165 -76 2090 1336 2672 64 2736
1993 2335 1724 -185 1539 942 2550 46 2595
1994 2623 1778 -113 1665 2404 2569 43 2612
1995 2721 1952 -27 1925 2693 2613 43 2656
1996 2192 2164 44 2208 2791 2663 44 2706
1997 2336 2203 43 2246 2263 2655 39 2693
1998 1973 2273 51 2324 2406 2658 35 2693
1999 2085 2219 19 2238 2043 2621 28 2648
2000 2354 2192 6 2198 2155 2592 22 2614
2001 2756 2245 20 2264 2424 2588 20 2608
2002 2993 2412 64 2476 2826 2623 21 2644
2003 3532 2631 110 2741 3063 2679 24 2703
2004 4010 2979 182 3160 3602 2786 33 2819
2005 4090 3415 258 3673 4080 2938 45 2983
2006 4365 3798 296 4094 4160 3093 56 3149
2007 4219 4175 320 4495 4435 3271 68 3339
2008 4766 4412 295 4707 4289 3427 77 3503
2009 3810 4725 300 5025 4836 3630 89 3719
2010 4228 4661 191 4852 3881 3728 90 3818
2011 4484 4665 135 4800 4298 3859 94 3954
2012 4705 106 4811 4554 4007 100 4106
2013 4918 4624 4206
2014 5024 4694 4306
2015 5131 4764 4405
2016 5237 4834 4505
2017 5344 4904 4605
2018 5450 4974 4704
2019 5557 5045 4804
2020 5663 5115 4904
2021 5770 5185 5004
2022 5876 5255 5103
44
P. Dimitrov / Tourism & Management Studies, Vol. 9, Issue 1 (2013) 41-47
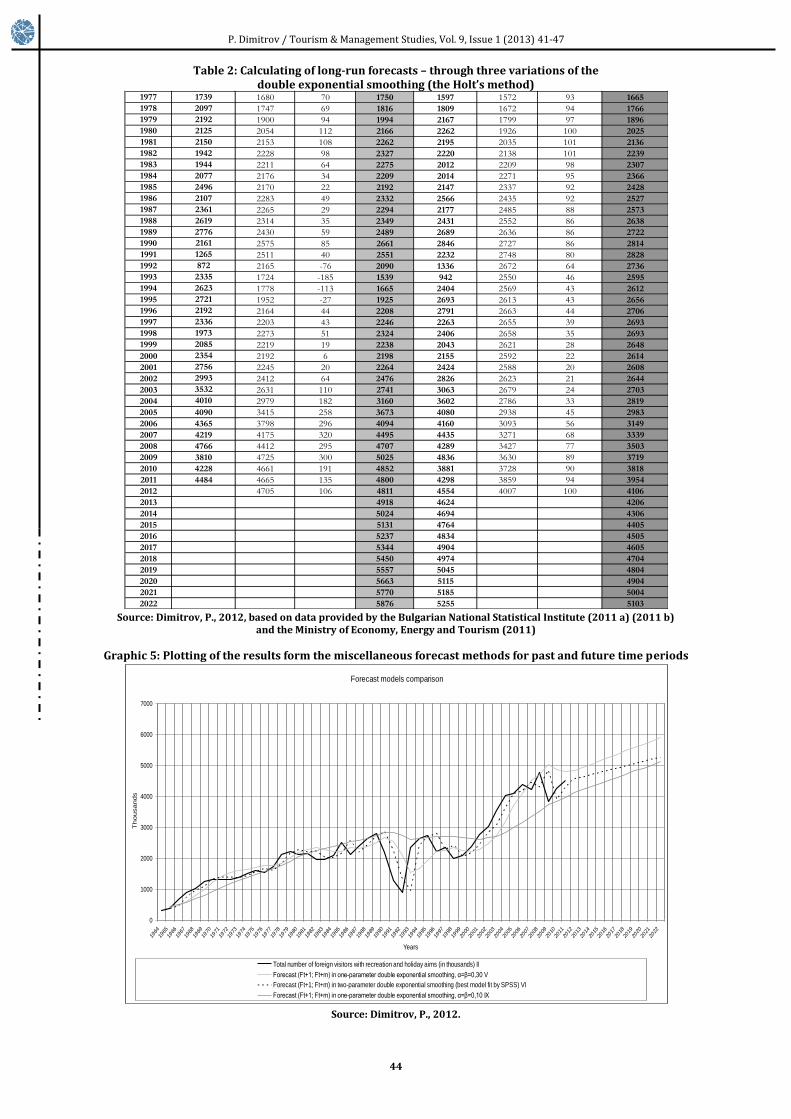
Table 2: Calculating of long-run forecasts – through three variations of the double exponential smoothing (the Holt’s method)
Source: Dimitrov, P., 2012, based on data provided by the Bulgarian National Statistical Institute (2011 a) (2011 b)
and the Ministry of Economy, Energy and Tourism (2011)
Graphic 5: Plotting of the results form the miscellaneous forecast methods for past and future time periods
Source: Dimitrov, P., 2012.
Level
initilization
(L0=Y1)
Trend
initilization
(T0=Y2-Y1)
294 71
Year
number of
foreign
visitors
Total number
of foreign
visitors with
recreation and
holiday aims
(in thousands)
The Level (L)
in one-
parameter
double
exponential
smoothening,
α=0,30
The Trend
(T) in one-
parameter
double
exponential
smoothing,
α=β=0,30
Forecast
(Ft+1; Ft+m)
in one-
parameter
double
exponential
smoothing,
α=β=0,30
Forecast
(Ft+1; Ft+m)
in two-
parameter
double
exponential
smoothing
(best model fit
by SPSS)
The Level (L)
in one-
parameter
double
exponential
smoothening,
α=β=0,10
The Trend (T)
in one-
parameter
double
exponential
smoothing,
α=β=0,10
Forecast (Ft+1;
Ft+m) in one-
parameter
double
exponential
smoothing,
α=β=0,10
I II III IV V VI VII VIII IX
1964 294 294
1965 365 344 65 408 364 358 70 428
1966 665 395 61 456 435 422 70 492
1967 884 519 80 598 735 509 71 580
1968 1007 684 105 789 954 611 74 685
1969 1256 855 125 979 1077 717 78 795
1970 1306 1062 150 1212 1326 841 82 923
1971 1306 1240 158 1398 1376 962 86 1048
1972 1299 1371 150 1521 1376 1073 89 1162
1973 1358 1454 130 1584 1369 1176 90 1266
1974 1488 1516 110 1626 1428 1275 91 1366
1975 1598 1584 97 1682 1558 1378 92 1470
1976 1527 1657 90 1746 1668 1483 93 1577
1977 1739 1680 70 1750 1597 1572 93 1665
1978 2097 1747 69 1816 1809 1672 94 1766
1979 2192 1900 94 1994 2167 1799 97 1896
1980 2125 2054 112 2166 2262 1926 100 2025
1981 2150 2153 108 2262 2195 2035 101 2136
1982 1942 2228 98 2327 2220 2138 101 2239
1983 1944 2211 64 2275 2012 2209 98 2307
1984 2077 2176 34 2209 2014 2271 95 2366
1985 2496 2170 22 2192 2147 2337 92 2428
1986 2107 2283 49 2332 2566 2435 92 2527
1987 2361 2265 29 2294 2177 2485 88 2573
1988 2619 2314 35 2349 2431 2552 86 2638
1989 2776 2430 59 2489 2689 2636 86 2722
1990 2161 2575 85 2661 2846 2727 86 2814
1991 1265 2511 40 2551 2232 2748 80 2828
1992 872 2165 -76 2090 1336 2672 64 2736
1993 2335 1724 -185 1539 942 2550 46 2595
1994 2623 1778 -113 1665 2404 2569 43 2612
1995 2721 1952 -27 1925 2693 2613 43 2656
1996 2192 2164 44 2208 2791 2663 44 2706
1997 2336 2203 43 2246 2263 2655 39 2693
1998 1973 2273 51 2324 2406 2658 35 2693
1999 2085 2219 19 2238 2043 2621 28 2648
2000 2354 2192 6 2198 2155 2592 22 2614
2001 2756 2245 20 2264 2424 2588 20 2608
2002 2993 2412 64 2476 2826 2623 21 2644
2003 3532 2631 110 2741 3063 2679 24 2703
2004 4010 2979 182 3160 3602 2786 33 2819
2005 4090 3415 258 3673 4080 2938 45 2983
2006 4365 3798 296 4094 4160 3093 56 3149
2007 4219 4175 320 4495 4435 3271 68 3339
2008 4766 4412 295 4707 4289 3427 77 3503
2009 3810 4725 300 5025 4836 3630 89 3719
2010 4228 4661 191 4852 3881 3728 90 3818
2011 4484 4665 135 4800 4298 3859 94 3954
2012 4705 106 4811 4554 4007 100 4106
2013 4918 4624 4206
2014 5024 4694 4306
2015 5131 4764 4405
2016 5237 4834 4505
2017 5344 4904 4605
2018 5450 4974 4704
2019 5557 5045 4804
2020 5663 5115 4904
2021 5770 5185 5004
2022 5876 5255 5103
Forecast models comparison
0
1000
2000
3000
4000
5000
6000
7000
1964
1965
1966
1967
1968
1969
1970
1971
1972
1973
1974
1975
1976
1977
1978
1979
1980
1981
1982
1983
1984
1985
1986
1987
1988
1989
1990
1991
1992
1993
1994
1995
1996
1997
1998
1999
2000
2001
2002
2003
2004
2005
2006
2007
2008
2009
2010
2011
2012
2013
2014
2015
2016
2017
2018
2019
2020
2021
2022
Years
Th
ou
sa
nd
s
Total number of foreign visitors with recreation and holiday aims (in thousands) II
Forecast (Ft+1; Ft+m) in one-parameter double exponential smoothing, α=β=0,30 V
Forecast (Ft+1; Ft+m) in two-parameter double exponential smoothing (best model fit by SPSS) VI
Forecast (Ft+1; Ft+m) in one-parameter double exponential smoothing, α=β=0,10 IX

45
P. Dimitrov / Tourism & Management Studies, Vol. 9, Issue 1 (2013) 41-47
Graphic 6: Double exponential smoothing through SPSS – best-fit model in regard to the mean absolute percentage of error (MAPE)
Source: Dimitrov, P., 2012.
Table 2, Graphic 5 and 6 provide also a solution for the third and the fourth problems set for solving in the present paper, i.e. iii “Calculating of long-run forecasts for the value of the above-mentioned general indicator (up to the year 2022)”; and iv “Comparing the results of the forecast techniques (the forecast models) on the basis of the errors in the forecasts”.
Based on the results in Table 2 and Graphic 5, one can outline three major types of forecasts for the number of the foreign visitors with recreation and holiday aims for 2022, as follows:
A pessimistic forecast (the forecast with the lowest value) – calculated by the method of the one-parameter double exponential smoothing with α=β=0.10:
5 103 000 foreign visitors;
The forecast (calculated by the use of SPSS) with the lowest mean absolute percentage of error (MAPE) – calculated by the method of the double exponential
smoothing with α=0.999 and β=7.384x10⁻⁵:
5 255 000 foreign visitors;
The most optimistic forecast (the forecast with the highest value) – calculated by the method of the one-parameter double exponential smoothing with α=β=0.30:
5 876 000 foreign visitors.
All these forecasts, as well as the forecasts presented in Table 2 and Graphic 5, have one major disadvantage – they are produced for the general indicator “number of foreign visitors in Bulgaria with recreation and holiday aims”, which means that they refer to the whole of Bulgarian tourism industry and
not to the sub-sector of ecotourism and the part of which belong to the small rural and mountainous municipality of Stambolovo. In order to overcome this disadvantage and solve problem v “estimating the size of the ecotourism sector of the Municipality of Stambolovo, so that the forecast(s) of the general indicator could be particularized especially for the needs of the municipality”, a certain modification is needed.
One way of doing so is by the use of a weight coefficient which shall indicate the share of the foreign visitors with intention to practice ecotourism in the municipality of Stambolovo. Or, as it has been mentioned in the initial part of this paper, an estimation of the sizes of the Bulgarian ecotourism tourism is needed to make the above general indicator more particularized (task v). Thus, equation (3) can be modified into equation (4), as follows:
(4) ttetlm
et
mt mTLKKF ,
Where:
Kеt is the coefficient of the share of foreign visitors
with ecotourism aims (Table 3).
Klm is the coefficient of the share of foreign visitors
with aims to practice and experience tourism at the local tourism receiving market of the municipality of Stambolovo (Table 4).
Neither the Bulgarian National Statistical Institute (NSI), nor the Bulgarian Ministry of Economy, Energy and Tourism, nor

46
P. Dimitrov / Tourism & Management Studies, Vol. 9, Issue 1 (2013) 41-47
any other Bulgarian government institution keeps a regular statistical record of the foreign visitors with ecotourism tourism aims. However, as it was already pointed in Graphic 2, there are six consequent surveys on the foreign visitors in both the winter and conducted by the different market research companies in Bulgaria. These six surveys, though based on samples of approximately 3000 foreign citizens visiting Bulgaria, provide two sets of important figures: (i) a percentage share of the foreign visitors practicing ecotourism
activities in the months of the winter tourism season and (ii) a percentage share of the foreign visitor practicing spa and wellness activities in the months of the summer tourism season. Based on these two sets of figures, a model for calculating the Ket (the coefficient of the share of foreign
visitors with ecotourism aims) can be built (Table 3).
Table 3: Ket calculation model
Ecotourism, agregate percentage shares:
Average %
share of
the
observed
periods -
Ket
Calculation
periods
Tourism
subtype
2007 year 2008 year 2009 year 2010 year
Summer
2007
Summer
2008
Winter
2009
Summer
2009
Autumn
2009
Spring
2010
Ecotourism 4,20 18,30 10,30 6,60 9,00 10,00
Total: 4,20 18,30 10,30 6,60 9,00 10,00
Annual average: 4,20 18,30 8,63 10,00 10,28
Source: Dimitrov, P., 2012, Data by the Bulgarian Ministry of Economy, Energy and Tourism (2011).
The model (Table 4) for calculating the coefficient of the share of foreign visitors with aims to practice and experience tourism at the local tourism receiving market of the municipality of Stambolovo (Klm) is based on the data provided for: (i) the last observed percentage value of the foreign visitors in the region in regard to their overall number
(i.e. the size of the market segment of the region, Graphic 1) (ii) The last recorded non-rounded value in the time series of the number of the foreign visitors with recreation and holiday aims (Graphic 3); and (iii) the last recorded value of the tourism arrivals in the municipality of Stambolovo, as pointed in the beginning of the present paper.
Table 4: The model for calculating the coefficient of the share of foreign visitors with aims to practice and experience tourism at the local tourism receiving market of the municipality of Stambolovo (Klm)
The last observed percentage
value of the foreign visitors in
the Rodopi region in regard to
their overall number (i.e the size
of the market segment of the
region)
The last recorded non-
rounded value in the time
serries of the number of the
foreign visitors with
recreationa and holiday
aims
The number of the
foreign visitiors with
recreation and holiday
aims who visited the
Rodopi region (I x II)
The last recorded
value of the tourism
arrivals in the
municipality of
Stambolovo
The % value of
Klm for the
municipality of
Stambolovo
(III/IV)
I II III 4 5
13,00% 4484248 582952 1592 0,27%
Source: Dimitrov, P., 2012, Data by the Bulgarian Ministry of Economy, Energy and Tourism (2011) and the municipality of Stambolovo
The models, presented in Table 4 and 5, have of course many weak points. The first consideration in this regard is the fact that the coefficient Ket is calculated on the assumption that it
will remain constant in value throughout all the forecast periods. The only reason for accepting of such a rough assumption is the scarcity of statistical records on which to build a separate model for the development of the coefficient in the course of time. The second week point is that the coefficient Ket is calculated on the basis of data received from
sample surveys, which on the other hand are conducted by different companies and thus there are: (i) probability errors in the data collected; and (ii) some, though not quite big, differences in the size of the samples and in the methodologies of surveys. The third week point comes in the fact that due to the already mentioned lack of previous data only four consequent years have been used for the calculation of the coefficient Ket. Despite all these weak points, the model for
calculating of Ket helps to overcome the entire lack of regular
statistic data for the ecotourism in Bulgaria. As for the model for calculating the coefficient Klm, it is quite a simplified way
for acquiring the share of foreign visitors with aims to practice and experience tourism at the municipality of Stambolovo by multiplication and extrapolation of the existing data.
Having calculated the values of Ket and Klm and using
equation (4), as well as the data in Graphic 3 and 5 and Table 2, the forecasts of the number of the foreign visitors with spa and wellness tourism aims to Bulgaria for 2022 can be easily made. An even simpler way to do some of the necessary calculations is to multiply the already presented pessimistic, most optimistic and lowest MAPE level forecasts for the general indicator “number of foreign visitors with recreation and holiday aims” by the decimal value of Ket, i.e. 0.1028 and
the decimal value of Klm, i.e. 0.0027 respectfully, as follows:
The pessimistic forecast for 2022 (the forecast with the lowest value) calculated by the method of the one-parameter double exponential smoothing with α=β=0.10:
FetT+22 = 0.1028 x 0.0027 x 5 103 000 = 1 416 foreign
visitors with ecotourism aims;

47
P. Dimitrov / Tourism & Management Studies, Vol. 9, Issue 1 (2013) 41-47
The forecast (calculated by the use of SPSS) with the lowest
mean absolute percentage of error (MAPE) – calculated by the method of the double exponential smoothing with
α=0.999 and β=7.384x10⁻⁵:
FetT+22 = 0.1028 x 0.0027 x 5 255 000 = 1 459 foreign
visitors with ecotourism aims;
The most optimistic forecast (the forecast with highest value) – calculated by the method of the one-parameter double exponential smoothing with α=β=0.30:
FetT+22 = 0.1028 x 0.0027 x 5 876 000 = 1 631 foreign visitors
with ecotourism aims. 4. Conclusions
The presented pessimistic, most optimistic and lowest MAPE level forecasts for the number of foreign visitors arrivals in the municipality of Stambolovo with aims to practice ecotourism suggest that by 2022 it will vary roughly between 1 416 and 1 631. The municipality’s authorities, however, believe that these forecasts of quite a low level of foreign tourism arrivals make can be overcome by using EU funds for building of a local tourism information centre, which could also assist the local tourism industry in preparing and planning of its advertising and promotion campaigns.
The presented in the paper forecasting technology, though having many shortcomings, could be applied also for municipalities and other regional units in other countries, which have unsteady and insufficient statistical records on their ecotourism. The main precondition for using this forecasting technology is to have a sustainable time series of a general tourism indicator such as “number of foreign visitors” and at least some clue about both the size of the ecotourism as a part of this very same indicator and the size of the incoming in the municipality tourist flows. References
Brown, R. G. (1959). Statistical Forecasting for Inventory Control. New York: McGraw-Hill.
Brown, R. G. (1963). Smoothing, Forecasting, and Prediction of Discrete Time Series. New Jersey: Prentice-Hall.
Dimitrov, P., (2012). Long-term Forecasting of the Spa and Wellness sub sector of the Bulgarian Tourism Industry. Tourism & Management Studies, 7, 140-148.
Dimitrov, P. (2010). Short-run forecasting of tourism arrivals in separate sectors of Bulgarian tourism industry. Paper presented at the scientific conference Proceedings of the International Scientific Conference Alternatives for Development of the Modern Tourism, Bulgaria, 378-389.
Filipova M., (2010). Peculiarities of Project Planning in Tourism. Perspectives of Innovations Economics and Business, 4(1), 57-59.
Gardner, E. S. (1985). Exponential Smoothing: the state of the art. Journal of Forecasting, 4, 1-28.
Gardner, E. S. (1987). Smoothing methods for short-term planning and control. In S. Makridakis & C. S. Wheelright (Ed.), The Handbook of forecasting – A Manager’s Guide, (pp. 174 -175). New Jersey: John Wiley & Sons.
Hyndman, R., Koehler, A., Keith Ord, J. & Snyder, R. (2008). Forecasting with Exponential Smoothing – The State Space Approach. Berlin: Springer.
National Statistical Institute (2011 a). Statistical Yearbooks of the People’s Republic of Bulgaria for the period 1964-1989. Retrieved September 29, 2011 from http://www.nsi.bg.
National Statistical Institute (2011 b). Statistical Yearbooks of the Republic of Bulgaria for the period 1990-1999. available Retrieved September 29, 2011 from http://www.nsi.bg.
Ministry of Economy, Energy and Tourism (2011). The foreign and the Bulgarian Tourists in Bulgaria – General Observations and Attitudes.
Retrieved June 29, 2012 from http://www.mi.government.bg/files/useruploads/files/turism_-_statistika_i_analizi/prouchvania_proekti/prouchvane_chujdenci_bulgarians_20092010_obshtinabljudenia.pdf.
Pegles, C. (1969). Exponential forecasting: some new variations. Management Science, 15(5), 311-315.
Stankova, M. (2010). The Tourism Regions in Bulgaria - Concepts and Challenges. Journal of Tourism & Hospitality Management, 16(1), 109-117.
Taylor, J. W. (2003). Exponential Smoothing with a damped multiplicative trend. International Journal of Forecasting, 19, 715-725. Article history
Received: 01 July 2012 Accepted: 04 September 2012


![Bulgaria [autosaved]](https://img.pdfslide.net/doc/110x75/55614018d8b42a9b248b5585/bulgaria-autosaved.jpg)