Embed Size (px)
Citation preview
1
Introduction to the System of Introduction to the System of Environmental-Economic Accounting for Water Environmental-Economic Accounting for Water
Part IIPart II
Training Session on the System of Environmental-Economic Training Session on the System of Environmental-Economic Accounting for Water (SEEAW) for the Arab Gulf CountriesAccounting for Water (SEEAW) for the Arab Gulf Countries
August 25-28, 2008August 25-28, 2008UN House- Beirut-LebanonUN House- Beirut-Lebanon
Michael VardonMichael VardonUnited Nations Statistics DivisionUnited Nations Statistics Division
2
OutlineOutline• The economy
• Statistical units, enterprises and establishments • Classification of units to industry
• The environment• SEEAW
• Development • Structure standard tables• Indicators • Countries implementing SEEAW
• Lessons from implementation• Work by UNSD
3
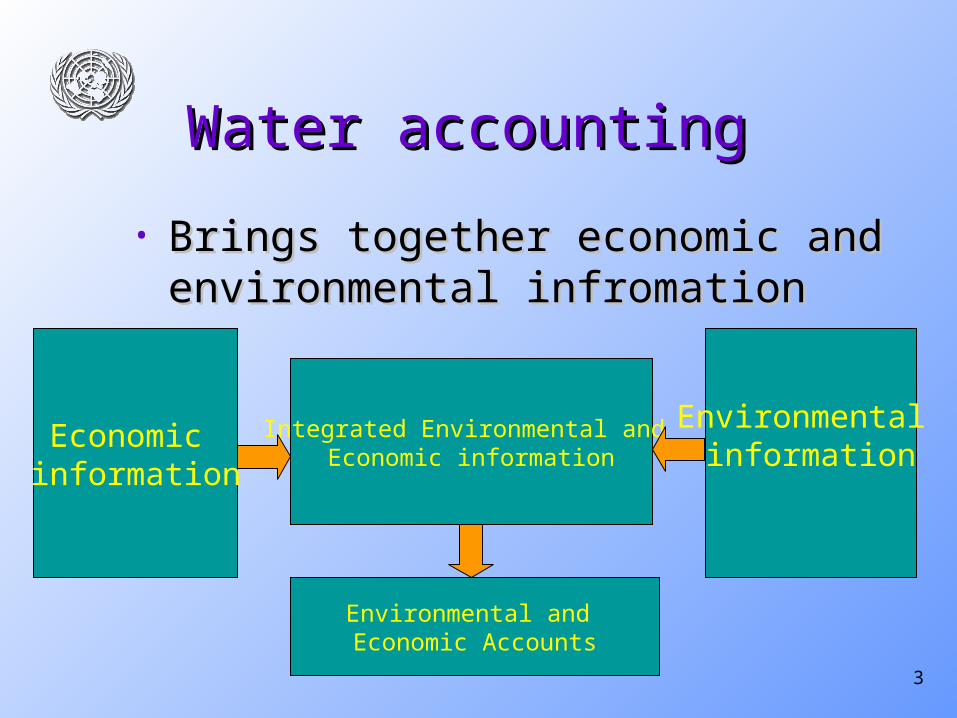
Water accountingWater accounting
• Brings together economic and Brings together economic and environmental infromationenvironmental infromation
Economic information
Integrated Environmental and Economic information
Environmental information
Environmental and Economic Accounts
4
Need to understand the building Need to understand the building blocks of environment and blocks of environment and economic statisticseconomic statistics
• These are large fields and require These are large fields and require knowledge and experience to fully masterknowledge and experience to fully master
• It is possible to understand the basics It is possible to understand the basics relatively quicklyrelatively quickly
5
Statistical UnitsStatistical Units
A statistical unit is an entity about which information is sought and for which statistics are ultimately compiled. It is the unit at the basis of statistical aggregates to which tabulated data refer.
These units can be divided into two categories: (a) observation units – identifiable legal/organizational or physical entities which are able, actually or potentially, to report data about their activities;
(b) analytical units – entities created by statisticians (also referred to as statistical constructs), often by splitting or combining observation units in order to compile more detailed and more homogeneous statistics than it is possible by using data on observation units. Analytical units are not able to report data themselves about their activities, but there exist indirect methods of statistical estimation.
http://unstats.un.org/unsd/isdts/docs/StatisticalUnits.pdf
6
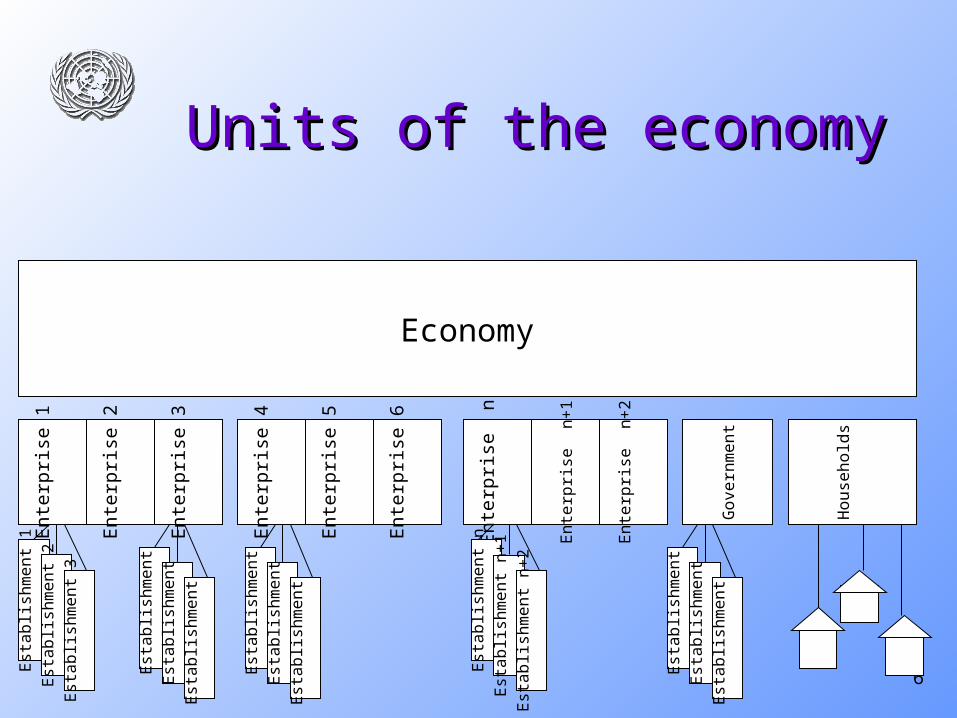
Units of the economyUnits of the economy
Economy
Ent
erpr
ise
1
Ent
erpr
ise
2
Ent
erpr
ise
5
Ent
erpr
ise
3
Ent
erpr
ise
4
Est
abli
shm
ent 1
Ent
erpr
ise
6
Ent
erpr
ise
n+
1
Ent
erpr
ise
n
Ent
erpr
ise
n+
2
Est
abli
shm
ent 2
Est
abli
shm
ent 3
Est
abli
shm
ent
Est
abli
shm
ent
Est
abli
shm
ent
Est
abli
shm
ent n
Est
abli
shm
ent n
+1
Est
abli
shm
ent n
+2
Hou
seho
lds
Gov
ernm
ent
Est
abli
shm
ent
Est
abli
shm
ent
Est
abli
shm
ent
Est
abli
shm
ent
Est
abli
shm
ent
Est
abli
shm
ent
7
EnterprisesEnterprises
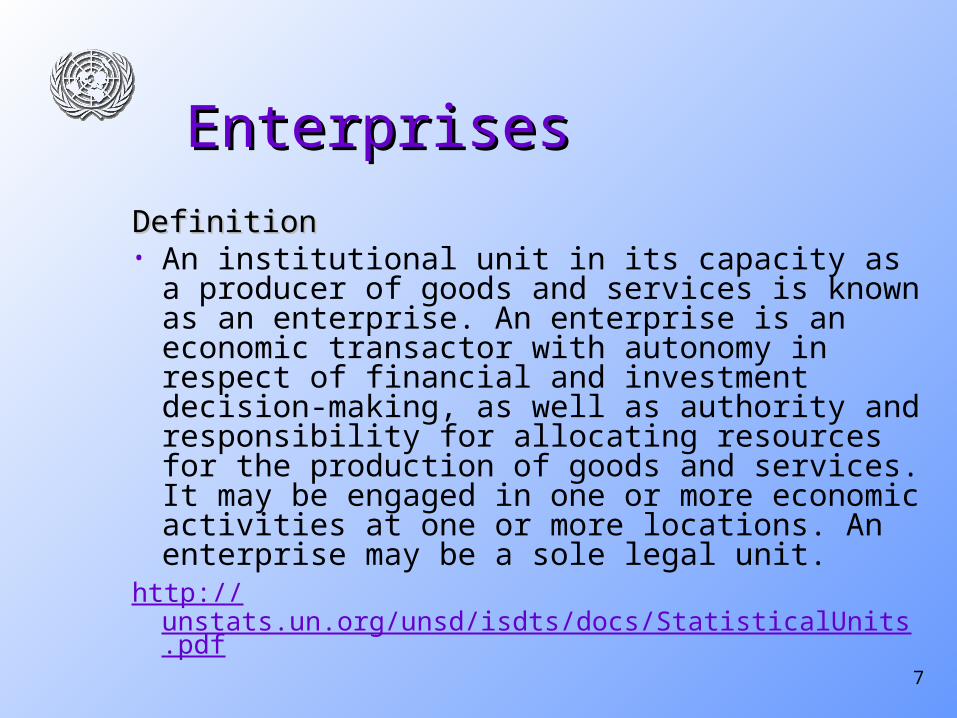
DefinitionDefinition• An institutional unit in its capacity as a producer
of goods and services is known as an enterprise. An enterprise is an economic transactor with autonomy in respect of financial and investment decision-making, as well as authority and responsibility for allocating resources for the production of goods and services. It may be engaged in one or more economic activities at one or more locations. An enterprise may be a sole legal unit.
http://unstats.un.org/unsd/isdts/docs/StatisticalUnits.pdf
8
EstablishmentsEstablishments
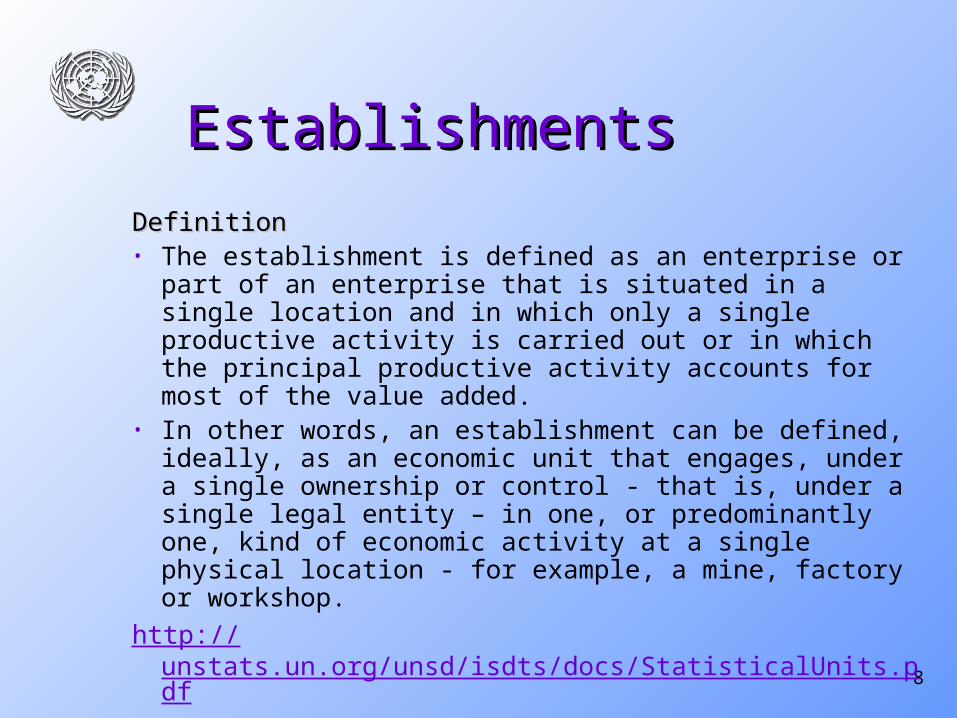
DefinitionDefinition• The establishment is defined as an enterprise or part of an
enterprise that is situated in a single location and in which only a single productive activity is carried out or in which the principal productive activity accounts for most of the value added.
• In other words, an establishment can be defined, ideally, as an economic unit that engages, under a single ownership or control - that is, under a single legal entity – in one, or predominantly one, kind of economic activity at a single physical location - for example, a mine, factory or workshop.
http://unstats.un.org/unsd/isdts/docs/StatisticalUnits.pdf
9
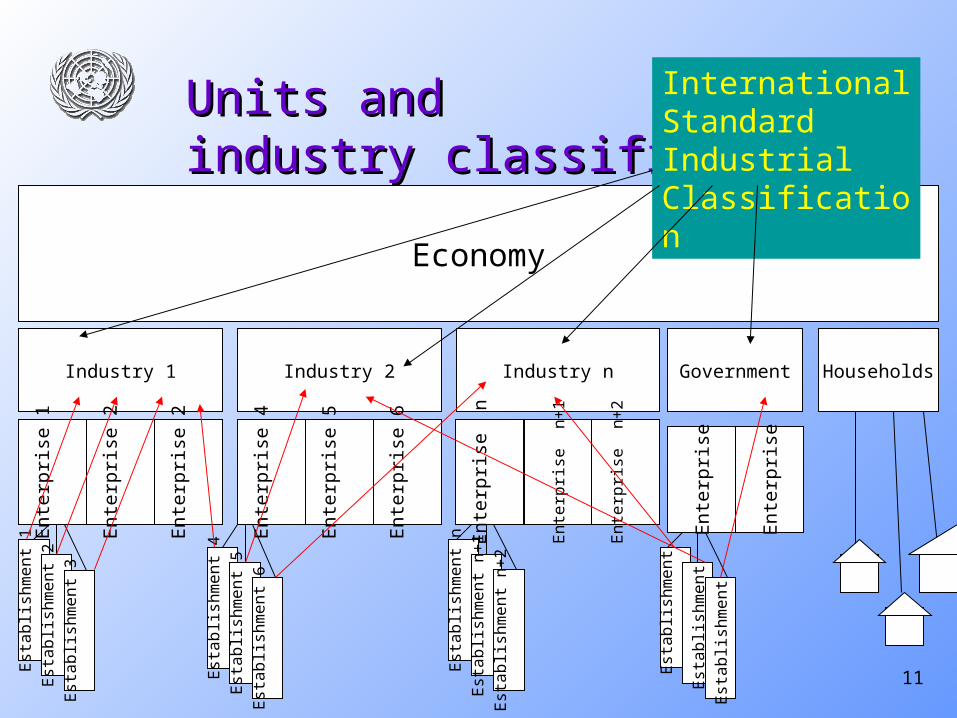
Industrial Classification – what is Industrial Classification – what is an industry?an industry?
• An industry is a grouping of establishments engaged in the same or similar kinds of activities
• The classification used in national accounts and water accounts is the International Standard Industrial Classification (ISIC)
10
ISIC – International Standard ISIC – International Standard Industrial ClassificationIndustrial Classification
• Enterprises and establishments are classified using ISIC Revision 4 according to the goods and services they produce
http://unstats.un.org/unsd/cr/registry/default.asphttp://unstats.un.org/unsd/cr/registry/default.asp • Sometimes all establishments of an enterprise are Sometimes all establishments of an enterprise are
classified to the same ISIC codeclassified to the same ISIC code• Sometimes establishments of the one enterprise Sometimes establishments of the one enterprise
are classified to different ISIC classes.are classified to different ISIC classes.
11
Units and Units and industry classificationindustry classification
Industry 1
Economy
Ent
erpr
ise
1
Industry 2 Industry n
Ent
erpr
ise
2
Ent
erpr
ise
5
Ent
erpr
ise
4
Est
abli
shm
ent 1
Ent
erpr
ise
6
Ent
erpr
ise
n+
1
Ent
erpr
ise
n
Ent
erpr
ise
n+
2
Est
abli
shm
ent 2
Est
abli
shm
ent 3
Est
abli
shm
ent 4
Est
abli
shm
ent 5
Est
abli
shm
ent 6
Est
abli
shm
ent n
Est
abli
shm
ent n
+1
Est
abli
shm
ent n
+2
International Standard Industrial Classification
Government Households
Ent
erpr
ise
2
Ent
erpr
ise
Ent
erpr
ise
Est
abli
shm
ent
Est
abli
shm
ent
Est
abli
shm
ent
12
National AccountsNational Accounts
• National Accounts aggregate the information on National Accounts aggregate the information on the economy, obtained from the units of the the economy, obtained from the units of the economy, into a standard format from which well economy, into a standard format from which well known indicators are derivedknown indicators are derived
• Gross Domestic Product is the best known of the Gross Domestic Product is the best known of the indicators from the national accountsindicators from the national accounts
• Use of international standard System of National Use of international standard System of National Accounts (SNA), classifications (e.g. ISIC) and Accounts (SNA), classifications (e.g. ISIC) and table formats allows for meaningful comparisons table formats allows for meaningful comparisons over time and between countriesover time and between countries
13
The environmentThe environment
• The environment has 4 componentsThe environment has 4 components• Land Land • Atmosphere (Air)Atmosphere (Air)• WaterWater• Life (biodiversity)Life (biodiversity)
• Energy, and solar energy are also important in Energy, and solar energy are also important in environment statisticsenvironment statistics
• The components of the environment interact with The components of the environment interact with each other and with the economyeach other and with the economy
14
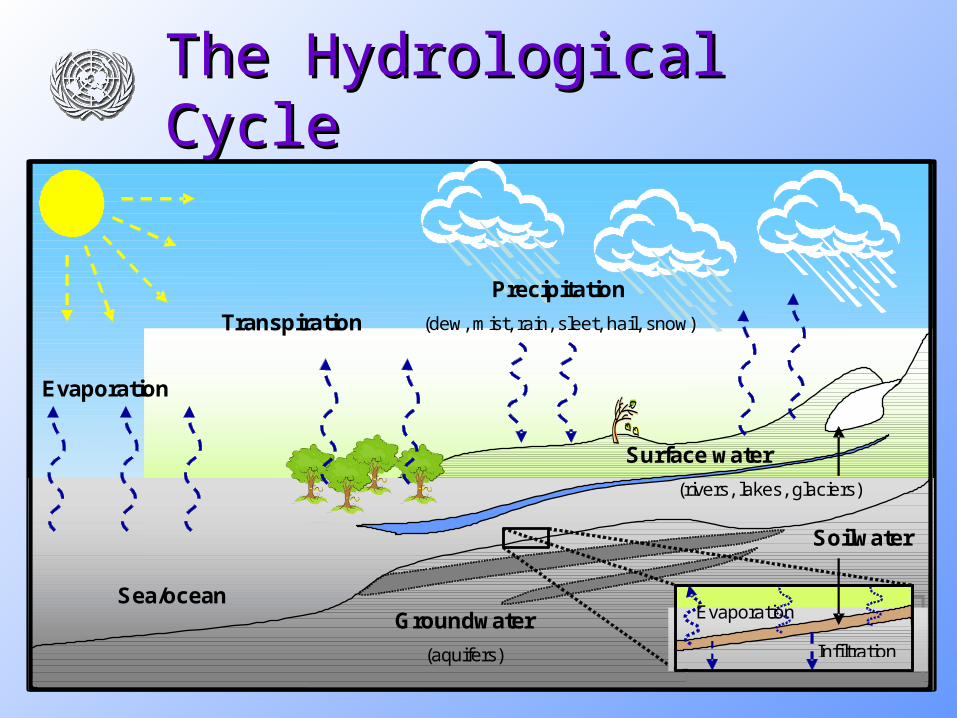
The Hydrological CycleThe Hydrological Cycle
Evaporation
Transpiration
Precipitation
(dew, mist, rain, sleet, hail, snow)
Groundwater
(aquifers)
Surface water
(rivers, lakes, glaciers)
Sea/ocean
Infiltration
Evaporation
Soilwater
15
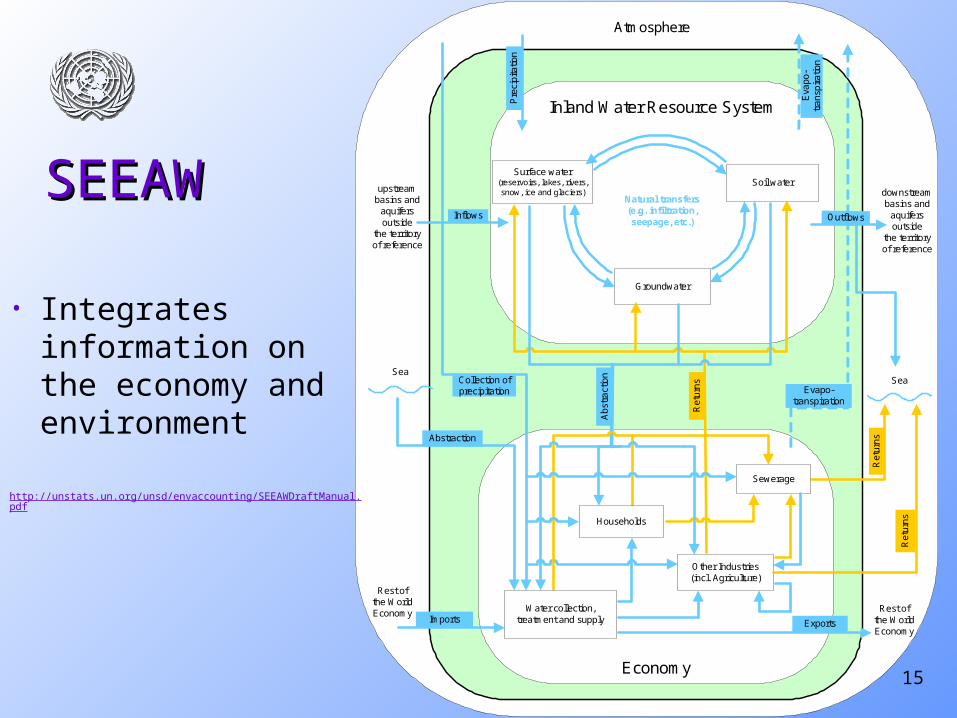
SEEAWSEEAW
Economy
Exports
Evapo-transpiration
Other Industries(incl. Agriculture)
Imports
Abstraction
Sea
Atmosphere
Collection ofprecipitation
Households
Abs
trac
tion
Water collection,treatment and supply
Inland Water Resource System
Surface water(reservoirs, lakes, rivers,snow, ice and glaciers)
Soil water
Groundwater
upstreambasins and
aquifersoutside
the territoryof reference
Natural transfers(e.g. infiltration,seepage, etc.)
Sea
Inflows
downstreambasins and
aquifersoutside
the territoryof reference
Outflows
Pre
cipi
tatio
n
Eva
po-
tra
nspi
ratio
n
Sewerage
Rest ofthe WorldEconomy Rest of
the WorldEconomy
Re
turn
s
Ret
urn
s
Ret
urn
s
• Integrates information on the economy and environment
http://unstats.un.org/unsd/envaccounting/SEEAWDraftManual.pdf
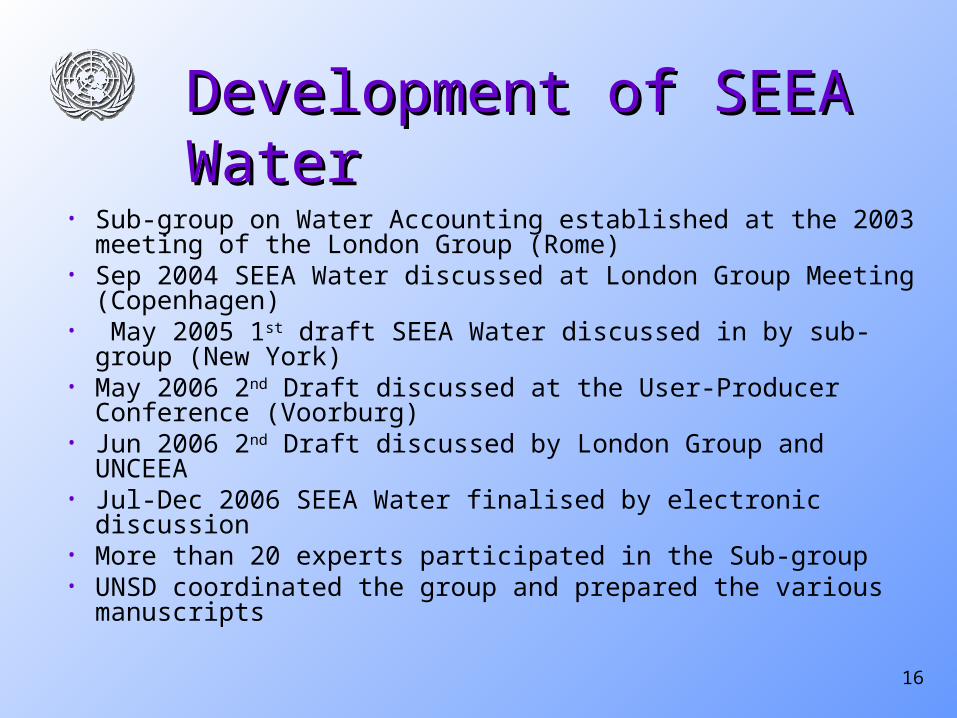
16
Development of SEEA WaterDevelopment of SEEA Water• Sub-group on Water Accounting established at the 2003 meeting
of the London Group (Rome)• Sep 2004 SEEA Water discussed at London Group Meeting
(Copenhagen)• May 2005 1st draft SEEA Water discussed in by sub-group (New
York)• May 2006 2nd Draft discussed at the User-Producer Conference
(Voorburg)• Jun 2006 2nd Draft discussed by London Group and UNCEEA• Jul-Dec 2006 SEEA Water finalised by electronic discussion• More than 20 experts participated in the Sub-group• UNSD coordinated the group and prepared the various
manuscripts
17
SEEA Water – an interim SEEA Water – an interim international statistical standardinternational statistical standard
• Part 1 of SEEA Water was adopted by the United Nations Statistical Commission in March 2007 as an interim statistical standard
• Part 2 contains the elements of SEEA Water for which there is less country experience and there is still some debate
• SEEA Water has been recognized as useful by the users of information
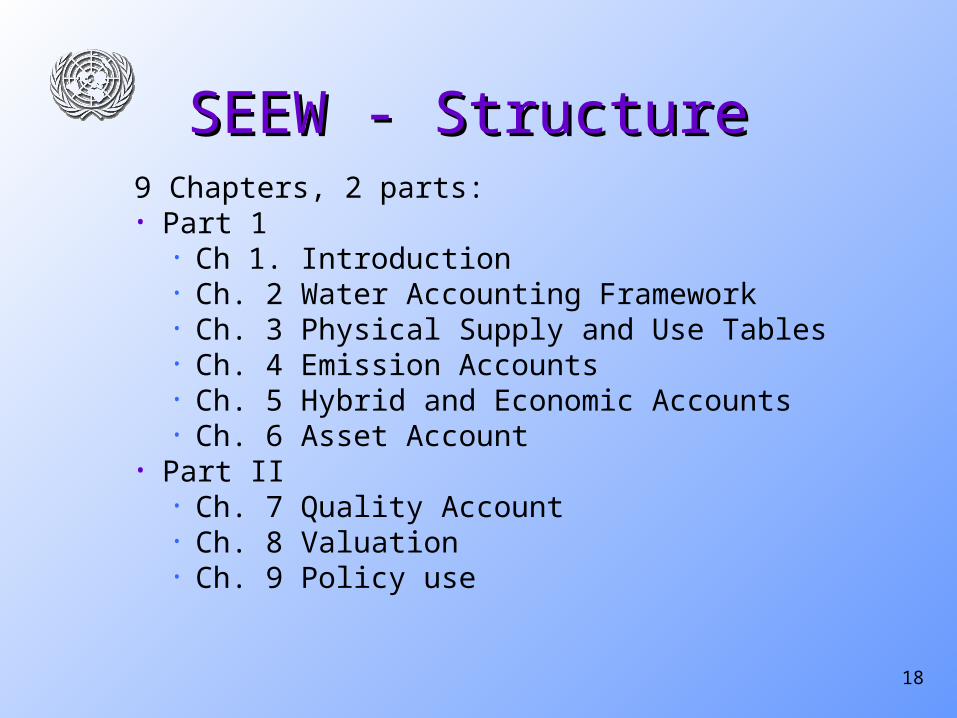
18
SEEW - StructureSEEW - Structure9 Chapters, 2 parts:• Part 1
• Ch 1. Introduction• Ch. 2 Water Accounting Framework• Ch. 3 Physical Supply and Use Tables• Ch. 4 Emission Accounts• Ch. 5 Hybrid and Economic Accounts• Ch. 6 Asset Account
• Part II• Ch. 7 Quality Account• Ch. 8 Valuation• Ch. 9 Policy use
19
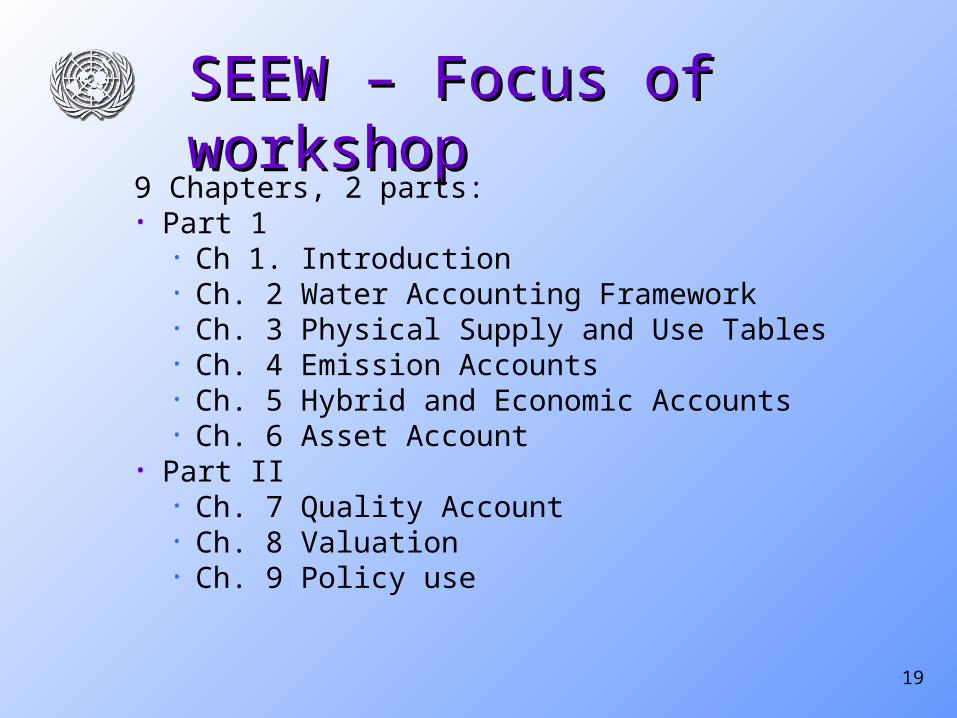
SEEW – Focus of workshopSEEW – Focus of workshop9 Chapters, 2 parts:• Part 1
• Ch 1. Introduction• Ch. 2 Water Accounting Framework• Ch. 3 Physical Supply and Use Tables• Ch. 4 Emission Accounts• Ch. 5 Hybrid and Economic Accounts• Ch. 6 Asset Account
• Part II• Ch. 7 Quality Account• Ch. 8 Valuation• Ch. 9 Policy use
20
12 Standard Tables12 Standard Tables
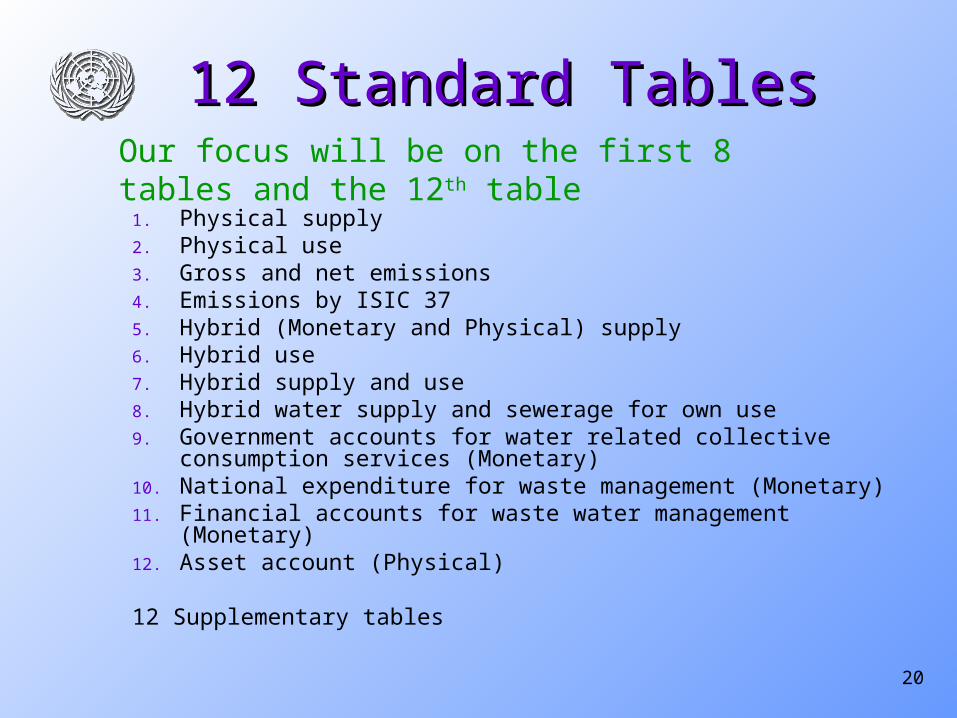
1. Physical supply 2. Physical use3. Gross and net emissions4. Emissions by ISIC 375. Hybrid (Monetary and Physical) supply6. Hybrid use7. Hybrid supply and use8. Hybrid water supply and sewerage for own use9. Government accounts for water related collective consumption services
(Monetary)10. National expenditure for waste management (Monetary)11. Financial accounts for waste water management (Monetary)12. Asset account (Physical)
12 Supplementary tables
Our focus will be on the first 8 tables and the 12th table
21
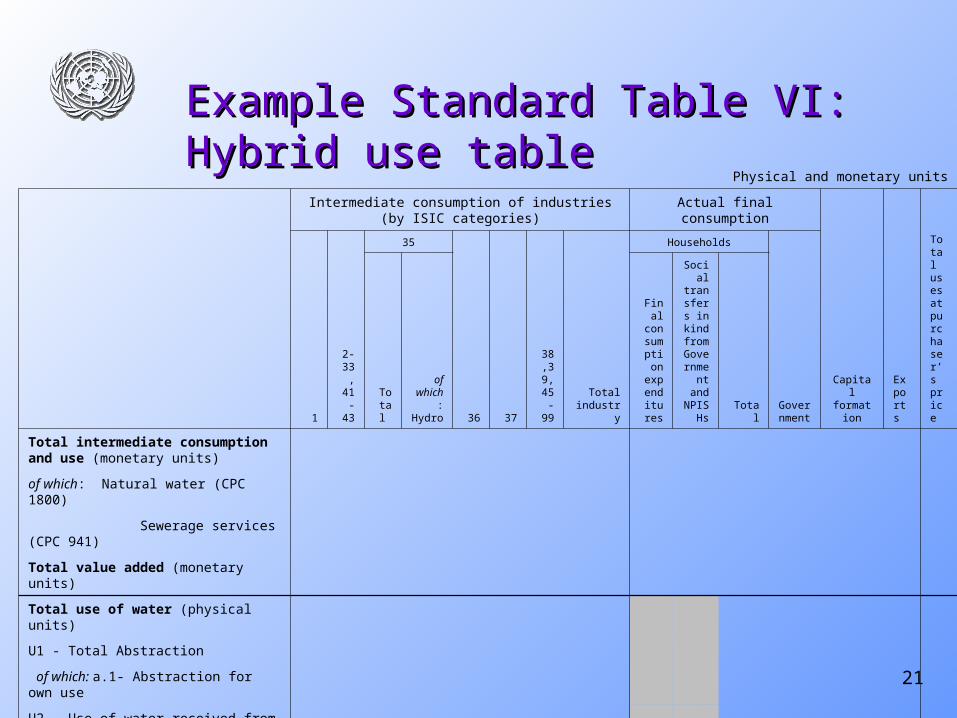
Example Standard Table VI: Example Standard Table VI: Hybrid use tableHybrid use table
Physical and monetary units
Intermediate consumption of industries (by ISIC categories) Actual final consumption
Capital formation
Exports
Total uses at purchaser’s price1
2-33, 41-43
35
36 37
38,39, 45-99
Total industry
Households
Government
Total
of which: Hydro
Final consumpt
ion expenditu
res
Social
transfers in kind from
Government and NPIS
Hs Total
Total intermediate consumption and use (monetary units)
of which: Natural water (CPC 1800)
Sewerage services (CPC 941)
Total value added (monetary units)
Total use of water (physical units)
U1 - Total Abstraction
of which: a.1- Abstraction for own use
U2 - Use of water received from other economic units
22
Supplementary tables and further Supplementary tables and further disaggregation of data itemsdisaggregation of data items
• The 12 SEEAW standard tables are the The 12 SEEAW standard tables are the minimum data that countries are minimum data that countries are encouraged to compileencouraged to compile
• Supplementary tables are presentedSupplementary tables are presented• Data items and industries can be further Data items and industries can be further
disaggregateddisaggregated
23
Example of disaggregated dataExample of disaggregated data
• The industry 12 SEEAW standard tables are The industry 12 SEEAW standard tables are the minimum data that countries are the minimum data that countries are encouraged to compileencouraged to compile
• Supplementary tables are presentedSupplementary tables are presented• Data items and industries can be further Data items and industries can be further
disaggregateddisaggregated
24
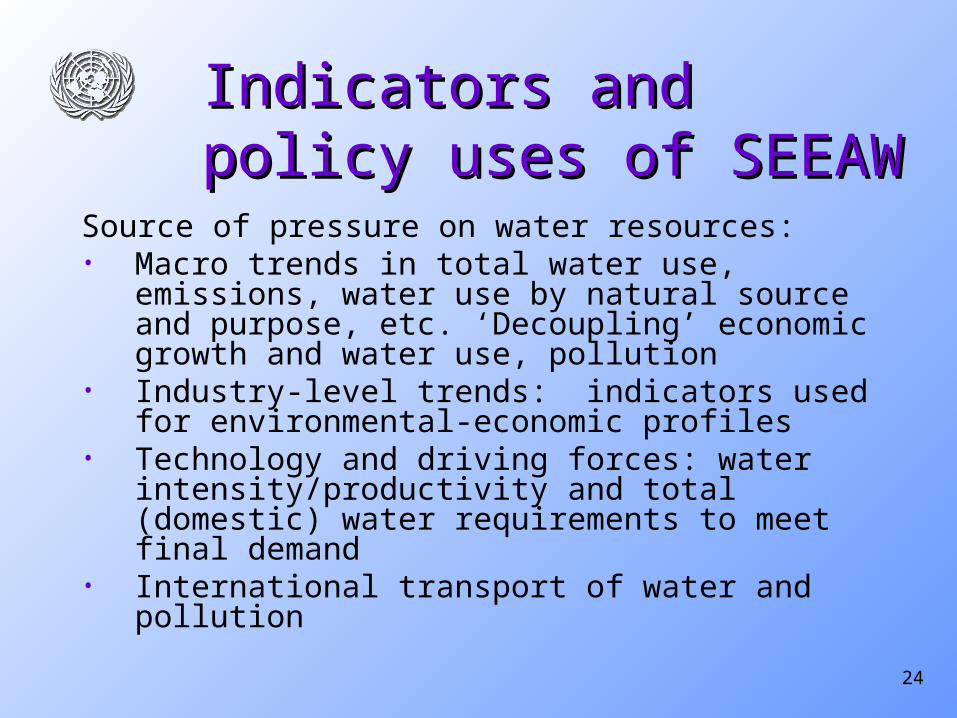
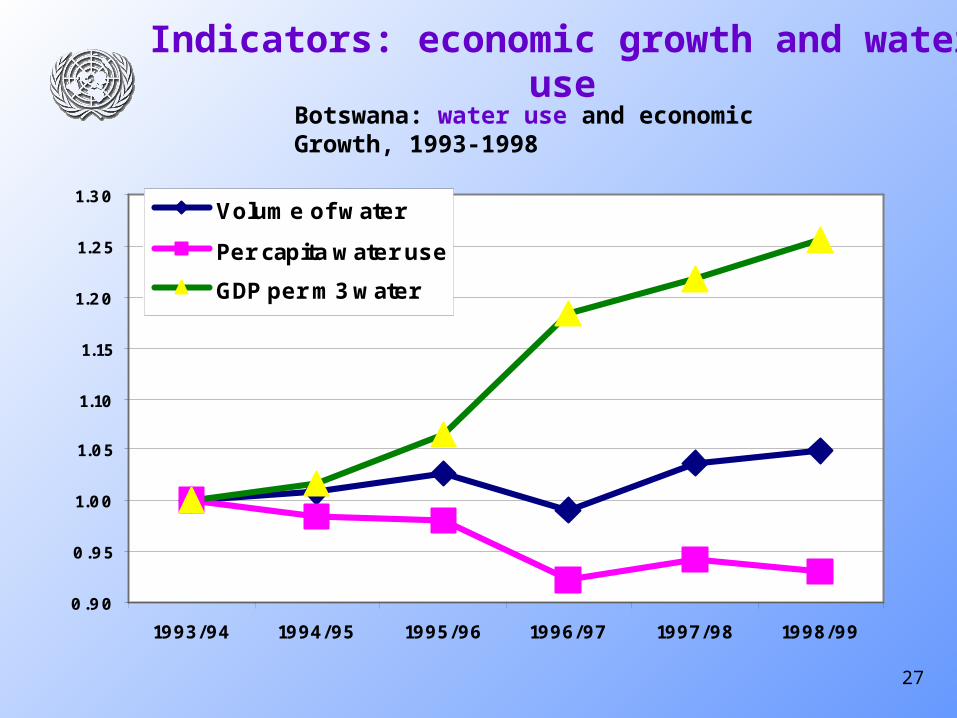
Source of pressure on water resources: • Macro trends in total water use, emissions, water
use by natural source and purpose, etc. ‘Decoupling’ economic growth and water use, pollution
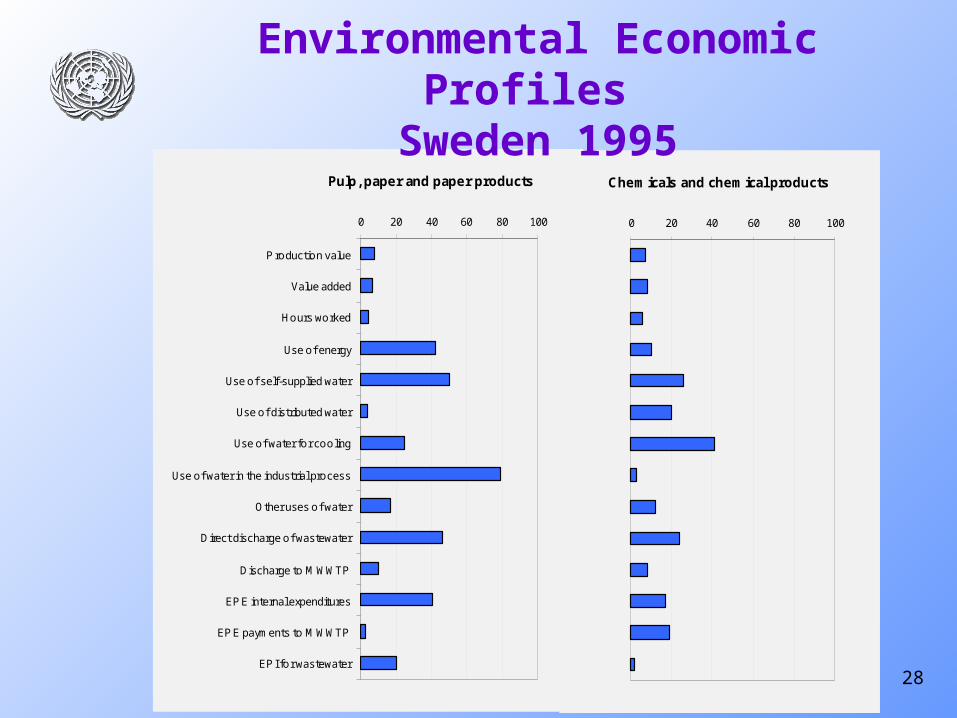
• Industry-level trends: indicators used for environmental-economic profiles
• Technology and driving forces: water intensity/productivity and total (domestic) water requirements to meet final demand
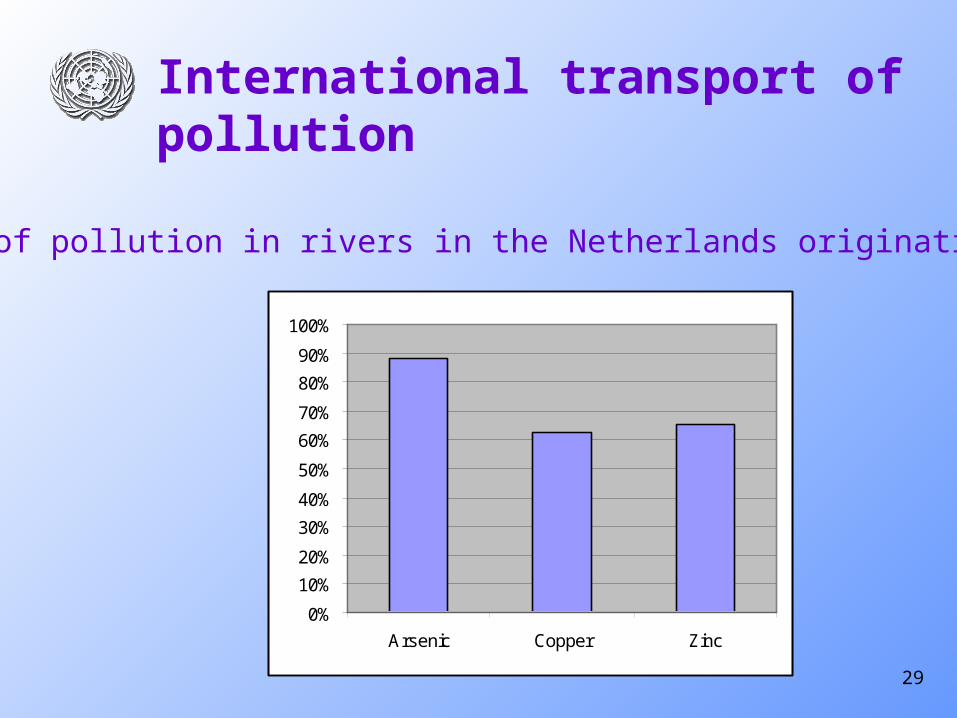
• International transport of water and pollution
Indicators and policy uses of Indicators and policy uses of SEEAWSEEAW
25
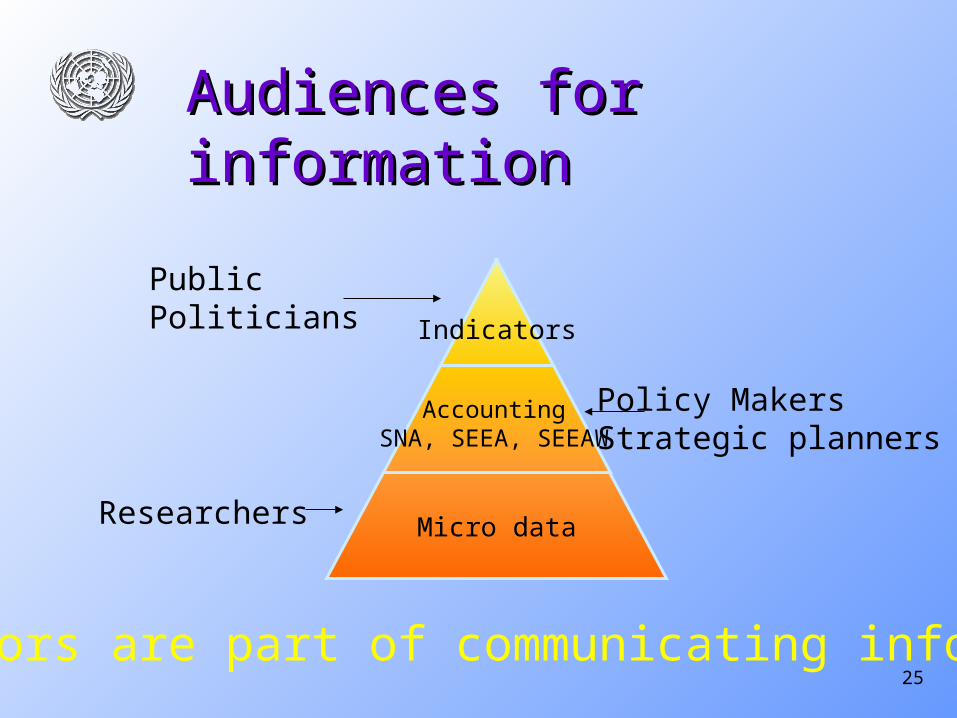
Audiences for informationAudiences for information
Indicators
Micro data
AccountingSNA, SEEA, SEEAW
PublicPoliticians
Policy MakersStrategic planners
Researchers
Indicators are part of communicating information
26
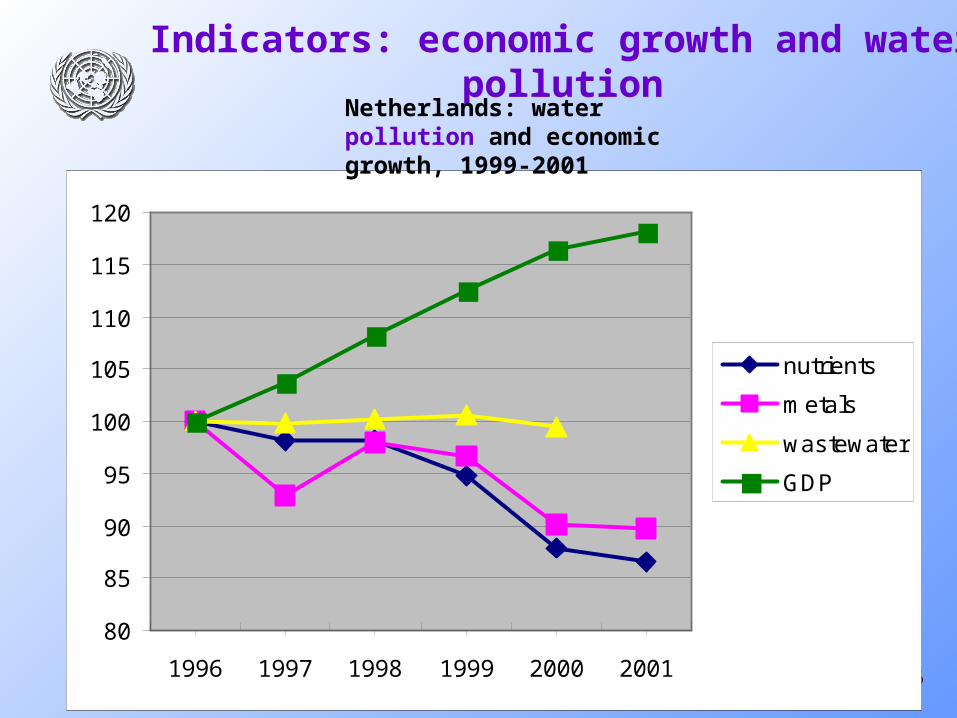
Indicators: economic growth and water pollution
80
85
90
95
100
105
110
115
120
1996 1997 1998 1999 2000 2001
nutrients
metals
wastewater
GDP
Netherlands: water pollution and economic growth, 1999-2001
27
Indicators: economic growth and water use
0.90
0.95
1.00
1.05
1.10
1.15
1.20
1.25
1.30
1993/94 1994/95 1995/96 1996/97 1997/98 1998/99
Volume of water
Per capita water use
GDP per m3 water
Botswana: water use and economicGrowth, 1993-1998
28
Pulp, paper and paper products
0 20 40 60 80 100
P roduction value
Value added
Hours worked
Use of energy
Use of self-supplied water
Use of distributed water
Use of water for cooling
Use of water in the industrial process
Other uses of water
Direct discharge of wastewater
Discharge to MWWTP
EP E internal expenditures
EP E payments to MWWTP
EP I for wastewater
Chemicals and chemical products
0 20 40 60 80 100
Environmental Economic Profiles Sweden 1995
29
International transport of pollution
0%
10%
20%
30%
40%
50%
60%
70%
80%
90%
100%
Arsenic Copper Zinc
Share of pollution in rivers in the Netherlands originating abroad
30
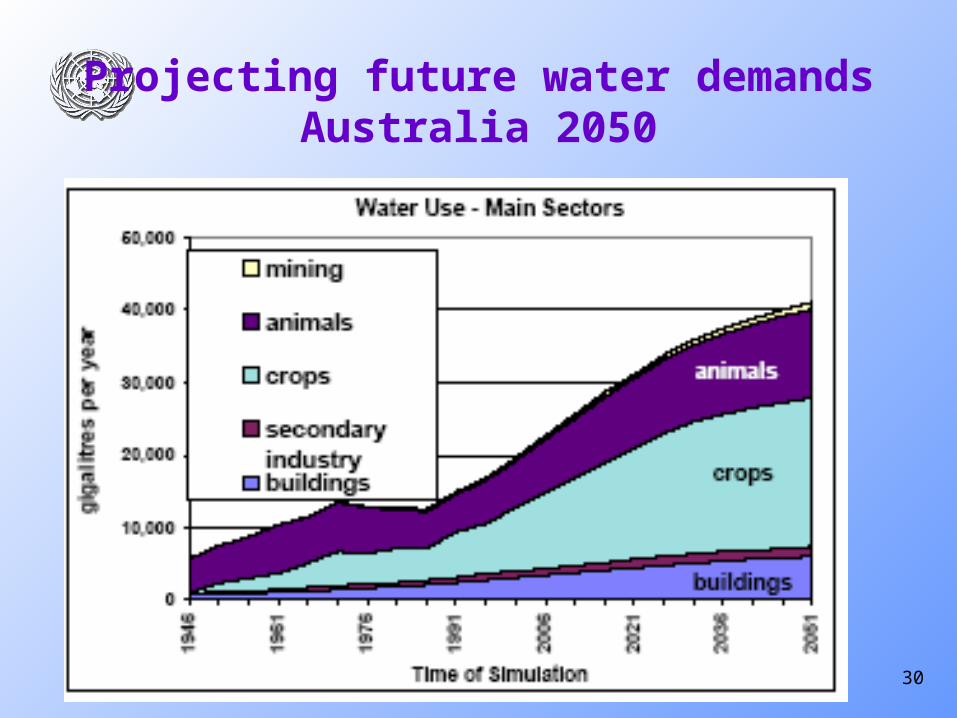
Projecting future water demandsAustralia 2050
31
Key lessons from countries Key lessons from countries implementing SEEA Waterimplementing SEEA Water
1. Build on existing statistical/scientific knowledge and information2. Cooperation essential• Within statistical offices• Between statistical offices, water departments, economic/planning
departments and agricultural departments• With the water supply industry• With the scientific and research communities• Between users and producers of information3. A phased approach is needed• Start with issues of most importance. In general for water scarce
countries it has been water supply and use. In industrialized countries it has been water pollution.
4. Pilot or experimental accounts are very useful• Users will appreciate the benefits more easily with concrete examples,
even if they are small scale.
32
22 countries have water accounts22 countries have water accounts(As report in the Global Assessment of Environmental (As report in the Global Assessment of Environmental
Statistics and Accounts 2006)Statistics and Accounts 2006)
Australia
Bhutan
Bulgaria
Canada
China
Colombia
Denmark
Dominican Republic
Germany
India
Israel
MexicoMongoliaNauruNetherlandsNew ZealandPapua New GuineaPhilippinesSouth AfricaSpainSwedenTanzania
Countries accounts are at different stages of development
33
11 countries want to develop water 11 countries want to develop water accountsaccounts
(As report in the Global Assessment of Environmental (As report in the Global Assessment of Environmental Statistics and Accounts 2006)Statistics and Accounts 2006)
• BahamasBahamas• BoliviaBolivia• Burkina FasoBurkina Faso• CubaCuba• GeorgiaGeorgia• GuatemalaGuatemala
• JordanJordan• KiribatiKiribati• MauritiusMauritius• TunisiaTunisia• TurkeyTurkey
34
UNSD – current work on water UNSD – current work on water accounts and water statisticsaccounts and water statistics
• Developing International Recommendations for Water Developing International Recommendations for Water StatisticsStatistics
• Developing training materialsDeveloping training materials• Conducting training coursesConducting training courses• Assisting countries with implementation via:Assisting countries with implementation via:
• Country missionsCountry missions• Telephone and emailTelephone and email
• Work with other partners e.g. UN regional commissions and Work with other partners e.g. UN regional commissions and other UN agencies, Medstat, OECD, Eurostat, World Bank, other UN agencies, Medstat, OECD, Eurostat, World Bank, Asian Development Bank.Asian Development Bank.
35
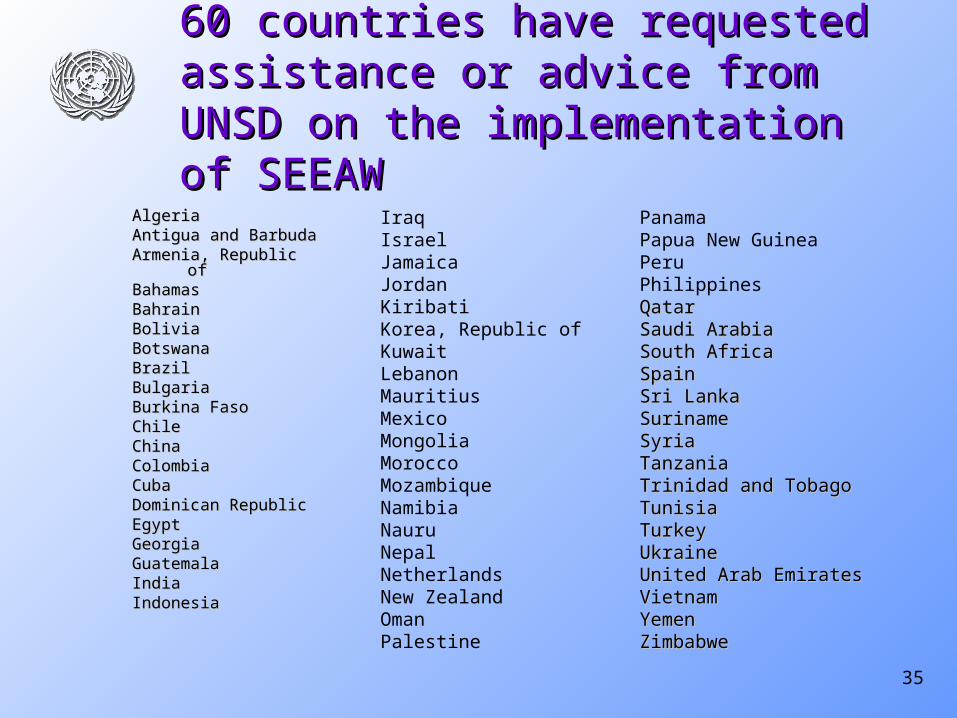
60 countries have requested assistance or 60 countries have requested assistance or advice from UNSD on the implementation advice from UNSD on the implementation of SEEAWof SEEAW
AlgeriaAlgeriaAntigua and BarbudaAntigua and BarbudaArmenia, Republic ofArmenia, Republic ofBahamasBahamasBahrainBahrainBoliviaBoliviaBotswanaBotswanaBrazilBrazilBulgariaBulgariaBurkina FasoBurkina FasoChileChileChinaChinaColombiaColombiaCubaCubaDominican Republic Dominican Republic EgyptEgyptGeorgiaGeorgiaGuatemalaGuatemalaIndiaIndiaIndonesiaIndonesia
IraqIsraelJamaicaJordanKiribatiKorea, Republic of KuwaitLebanonMauritiusMexicoMongoliaMoroccoMozambiqueNamibiaNauruNepalNetherlandsNew ZealandOmanPalestine
PanamaPapua New GuineaPeruPhilippinesQatarQatarSaudi ArabiaSaudi ArabiaSouth AfricaSouth AfricaSpainSpainSri LankaSri LankaSuriname Suriname SyriaSyriaTanzaniaTanzaniaTrinidad and TobagoTrinidad and TobagoTunisiaTunisiaTurkeyTurkeyUkraineUkraineUnited Arab EmiratesUnited Arab EmiratesVietnamVietnamYemenYemenZimbabweZimbabwe
36
International Recommendations International Recommendations for Water Statistics (IRWS)for Water Statistics (IRWS)
• UNSD is developing IRWS UNSD is developing IRWS • The IRWS will define and support the compilation of basic The IRWS will define and support the compilation of basic
statistical data to support the SEEAW and the water statistical data to support the SEEAW and the water indicators used by international agencies (e.g. the FAO, indicators used by international agencies (e.g. the FAO, World Bank and UN MDGs)World Bank and UN MDGs)
• It will provide information on the concepts, sources and It will provide information on the concepts, sources and methods needed for basic water statisticsmethods needed for basic water statistics
• It will also provide practical guidance on the compilation It will also provide practical guidance on the compilation of water accounts and indicatorsof water accounts and indicators
• A draft of the IRWS should be available for discussion in A draft of the IRWS should be available for discussion in mid-2008. mid-2008.
• An expert group meeting is planned to discuss the draftAn expert group meeting is planned to discuss the draft
37
Contact detailsContact details
Michael VardonAdviser on Environmental-Economic AccountingUnited Nations Statistics DivisionNew York 10017 USARoom DC2 1532
Phone: +1 917 367 5391Fax: +1 917 363 1374Email: [email protected]