Embed Size (px)
Citation preview
1
“… it is highly important for us to gain some notion, however imperfect, of the lapse of years.”
Charles Darwin: On the Origin of Species 1859 Chapter 9: On the Imperfection of the Geological Record


3
4
Experience DEEP TIME…with its…
and its PATTERNS of staggered ORIGINS
PATTERNS of FOSSIL AGES
5
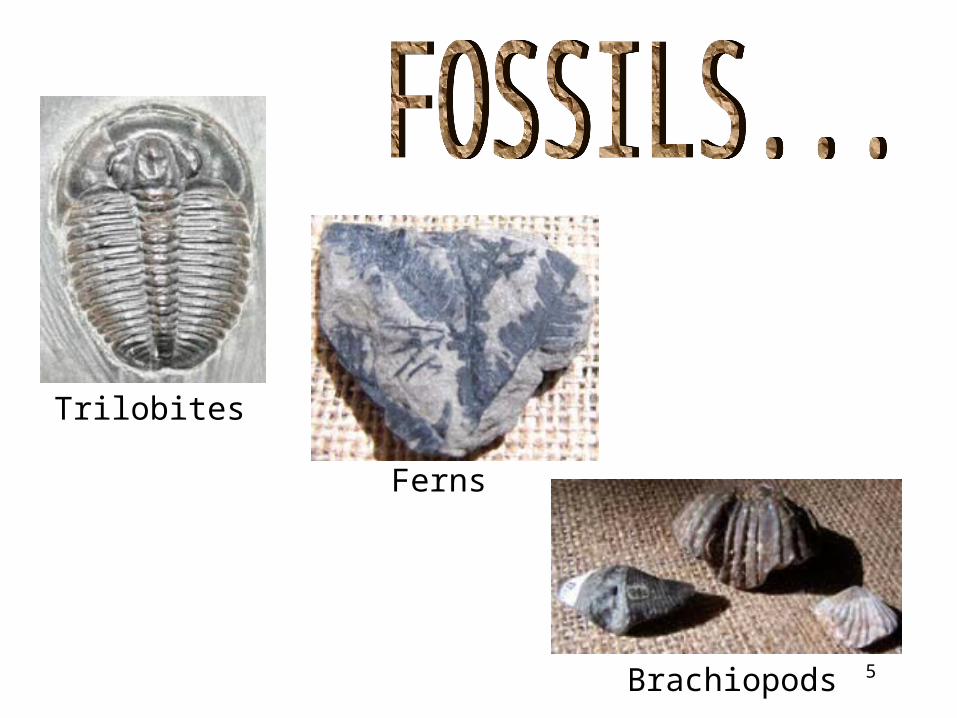
Trilobites
Ferns
Brachiopods
6
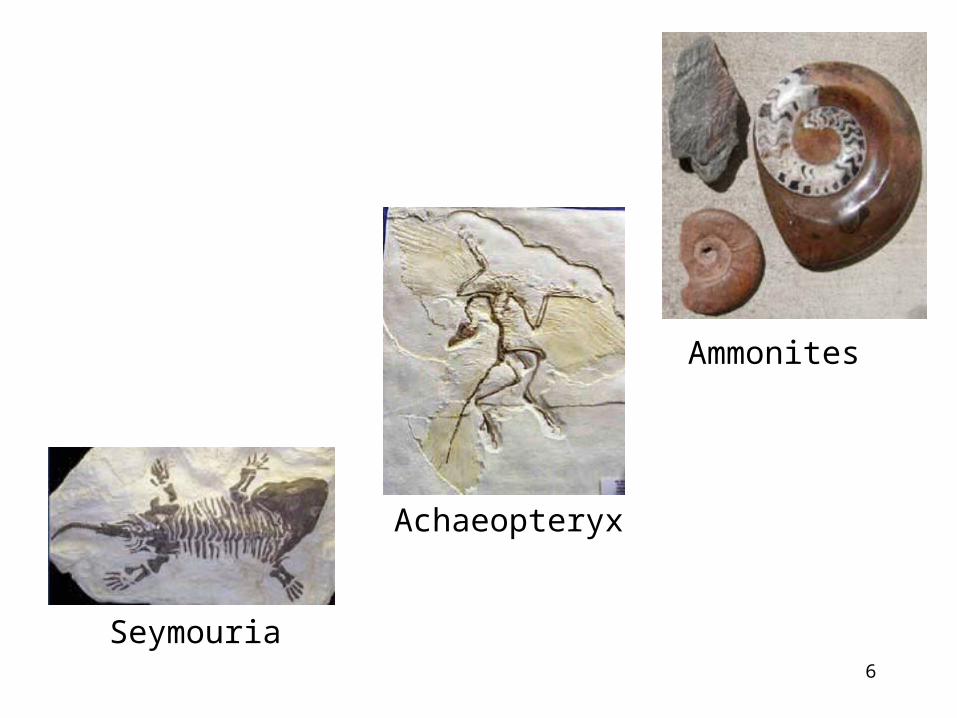
Ammonites
Achaeopteryx
Seymouria

7
When did they live?
Long ago?
How long?
All at once?
When?
8
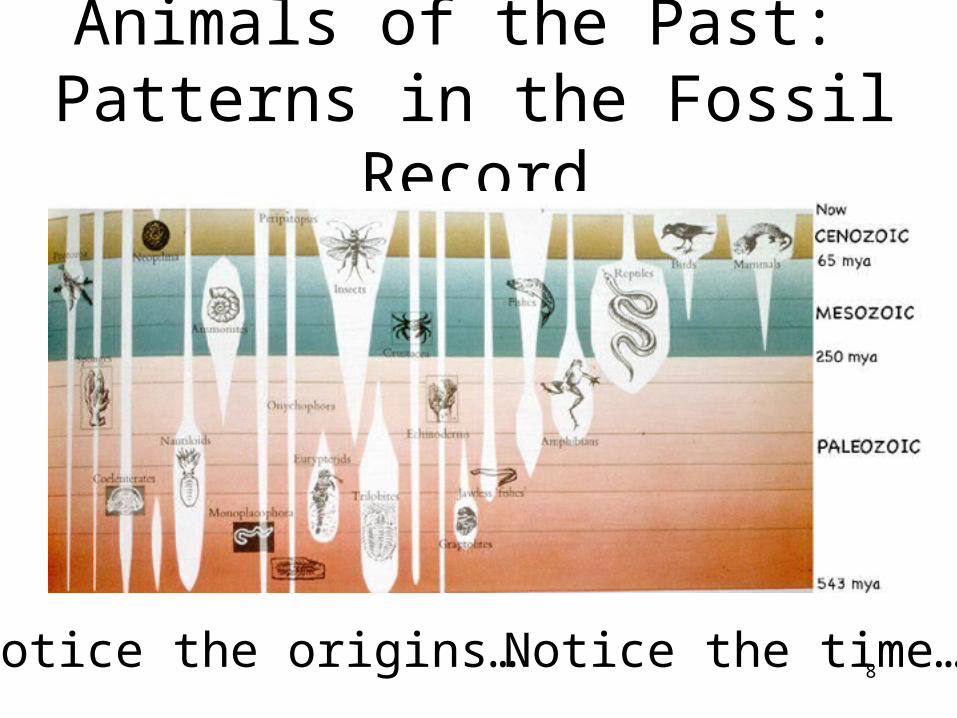
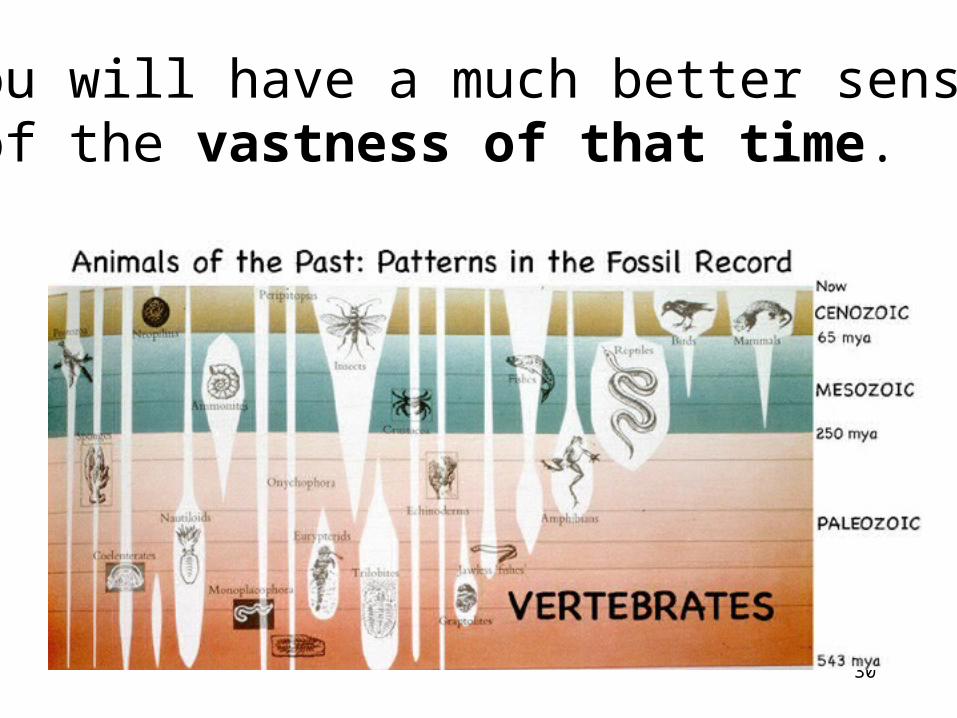
Animals of the Past: Patterns in the Fossil
Record
Notice the origins… Notice the time…
9
What’s “65 mya” ?
65 millions of years ago
How much is 65 mya?
How much is ONE mya?How many human lifetimes is
this?LET’S WORK IT OUT….
10
Here’s One Month…
11
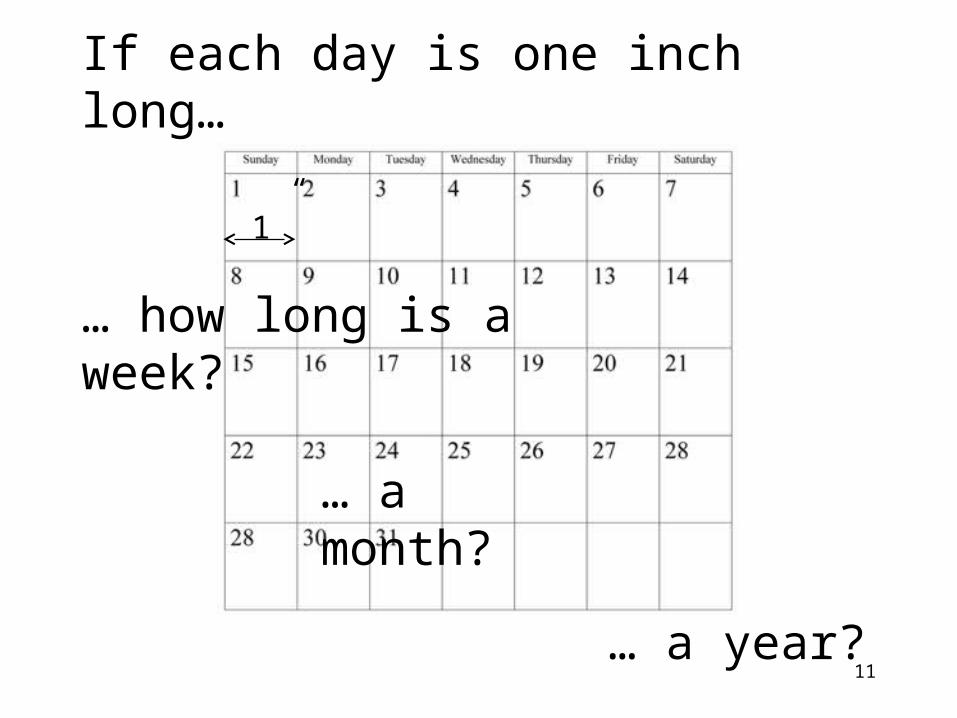
If each day is one inch long…
… how long is a week?
… a month?
… a year?
1”
12
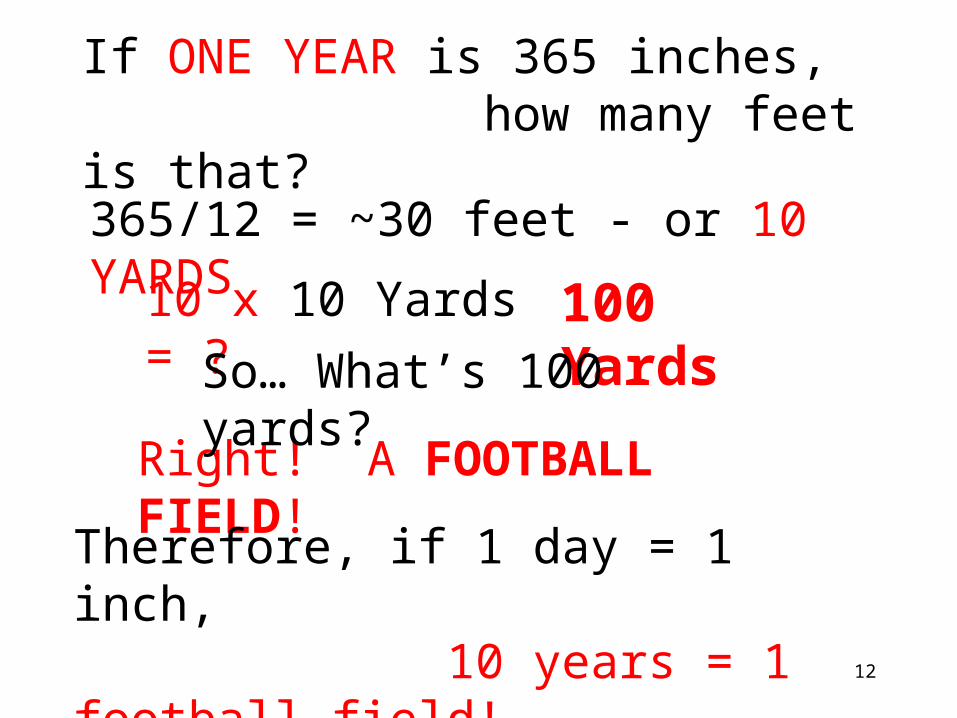
If ONE YEAR is 365 inches, how many feet is that?
365/12 = ~30 feet - or 10 YARDS
Right! A FOOTBALL FIELD!
Therefore, if 1 day = 1 inch, 10 years = 1 football field!
10 x 10 Yards = ?
100 YardsSo… What’s 100
yards?
13
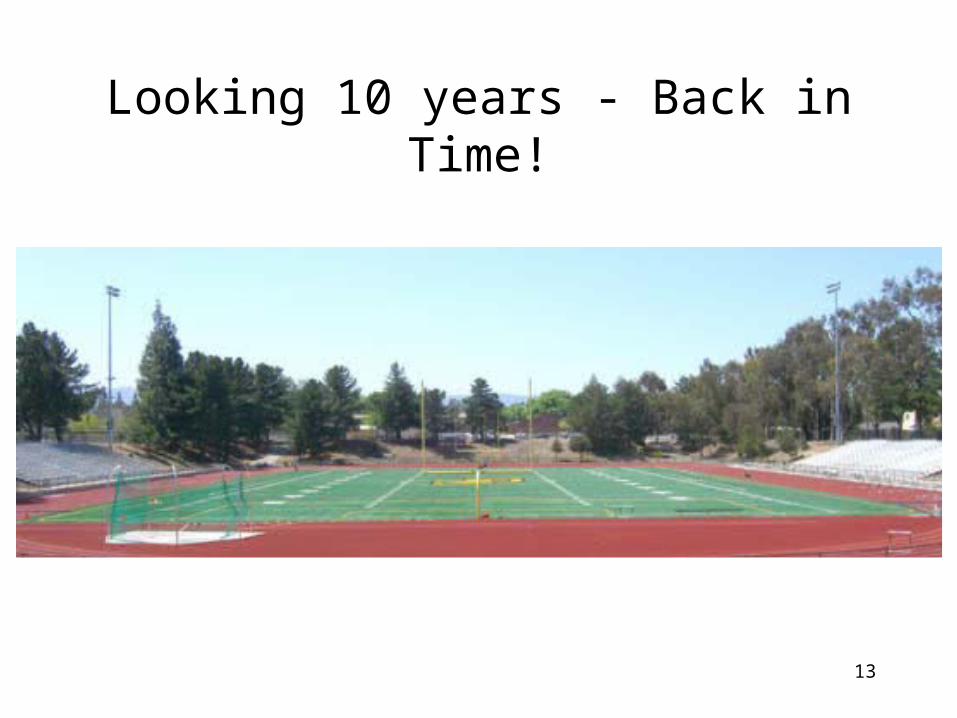
Looking 10 years - Back in Time!
14
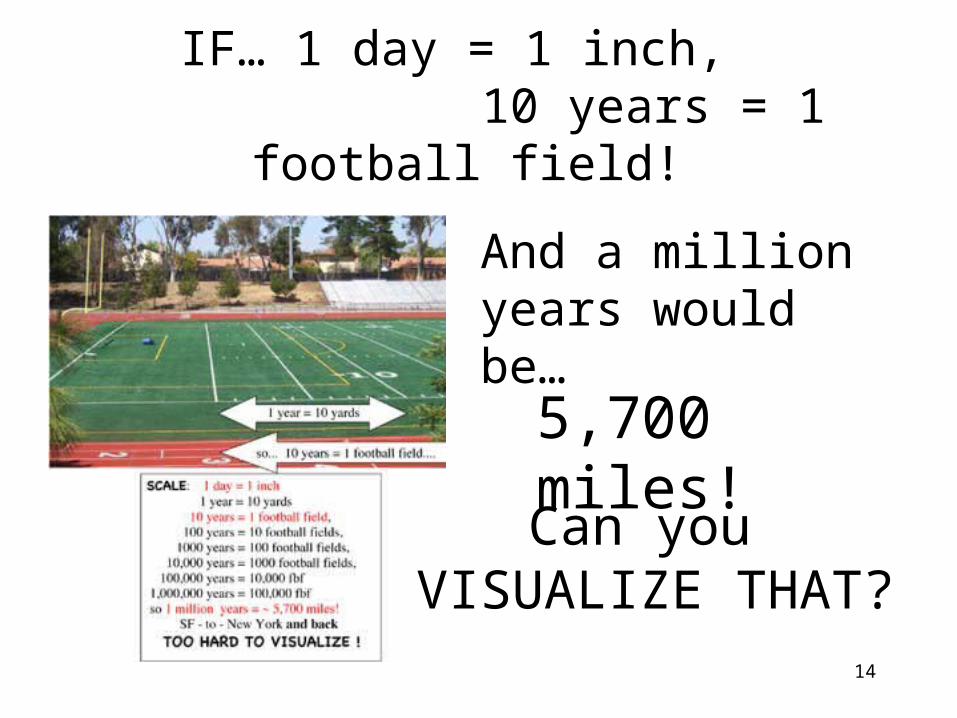
IF… 1 day = 1 inch, 10 years = 1 football
field!
5,700 miles!
And a million years would be…
Can you VISUALIZE THAT?
15
So, let’s try a different scale…
Let’s take 10 years of your life,and reduce it to 1 millimeter!
Not easily…
16
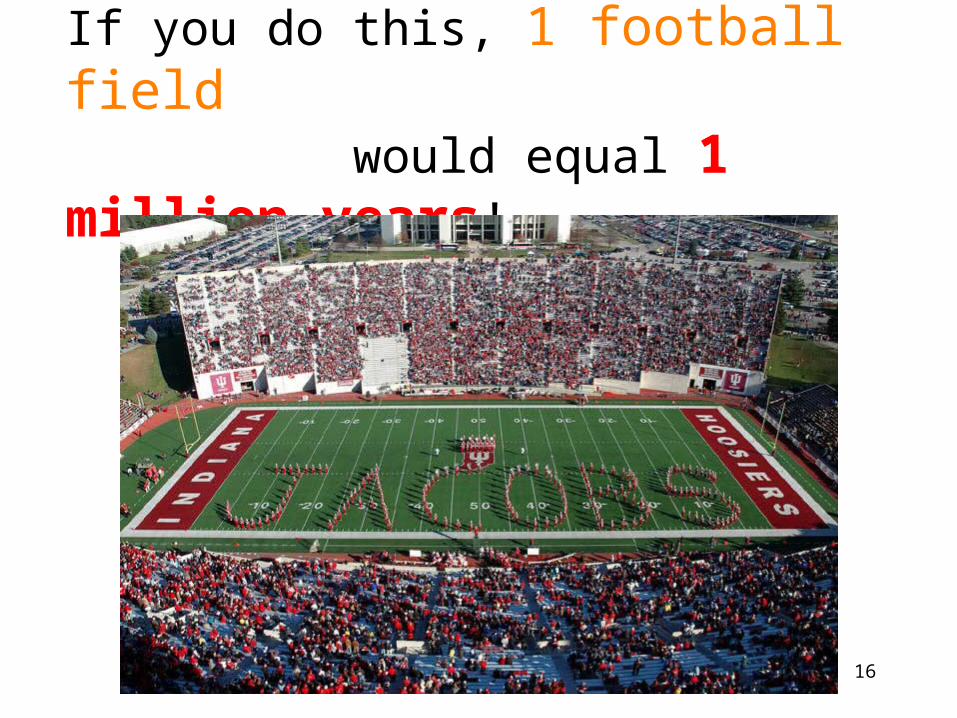
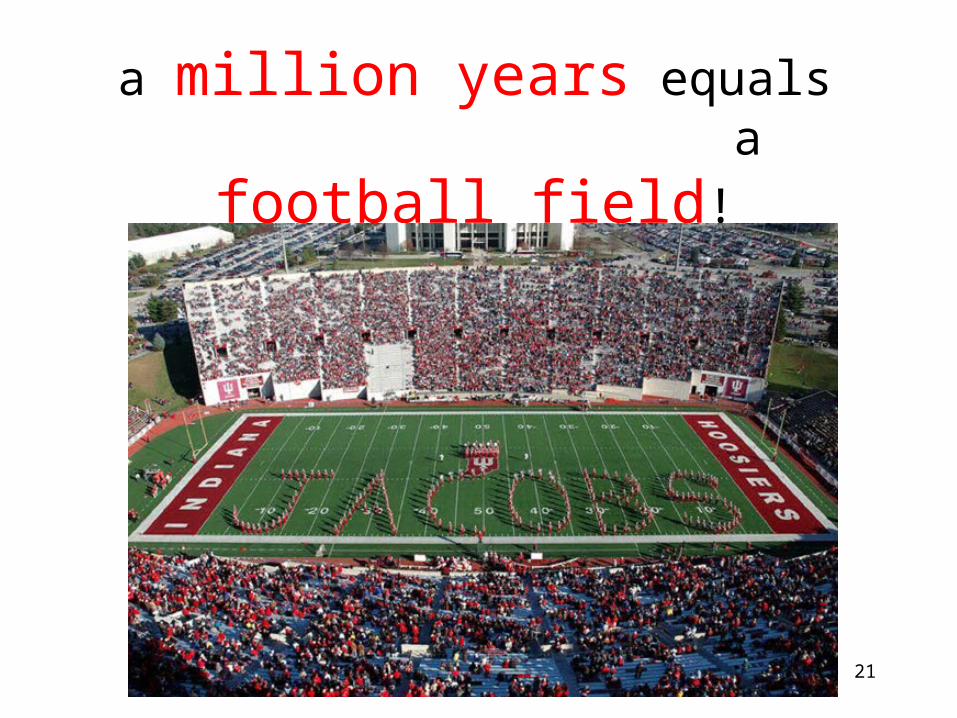
If you do this, 1 football field would equal 1 million years!
17
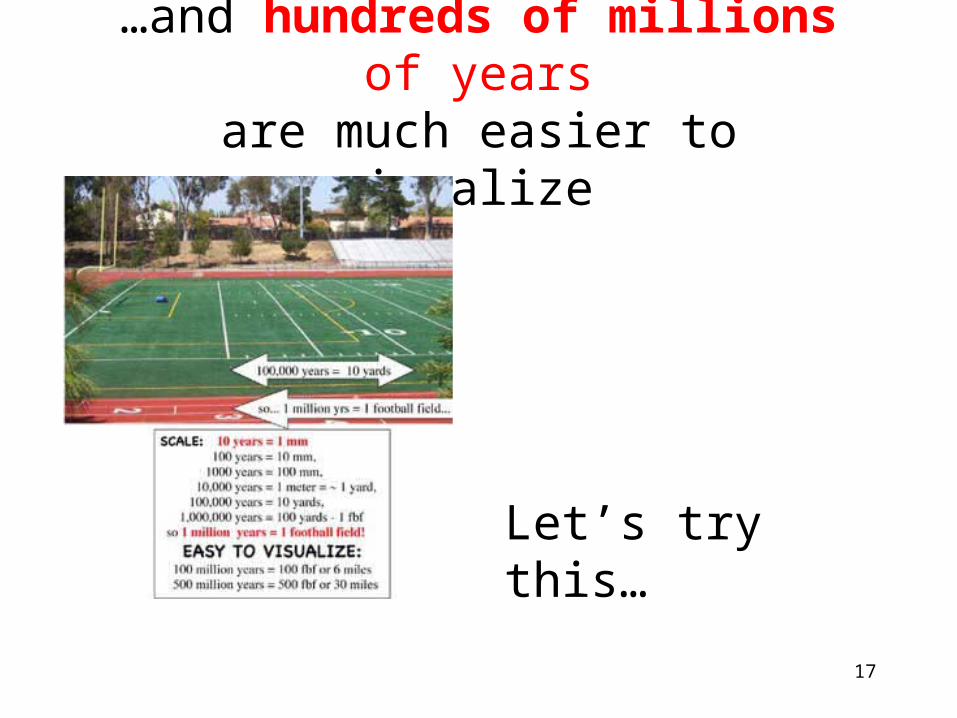
…and hundreds of millions of years
are much easier to visualize
Let’s try this…
18
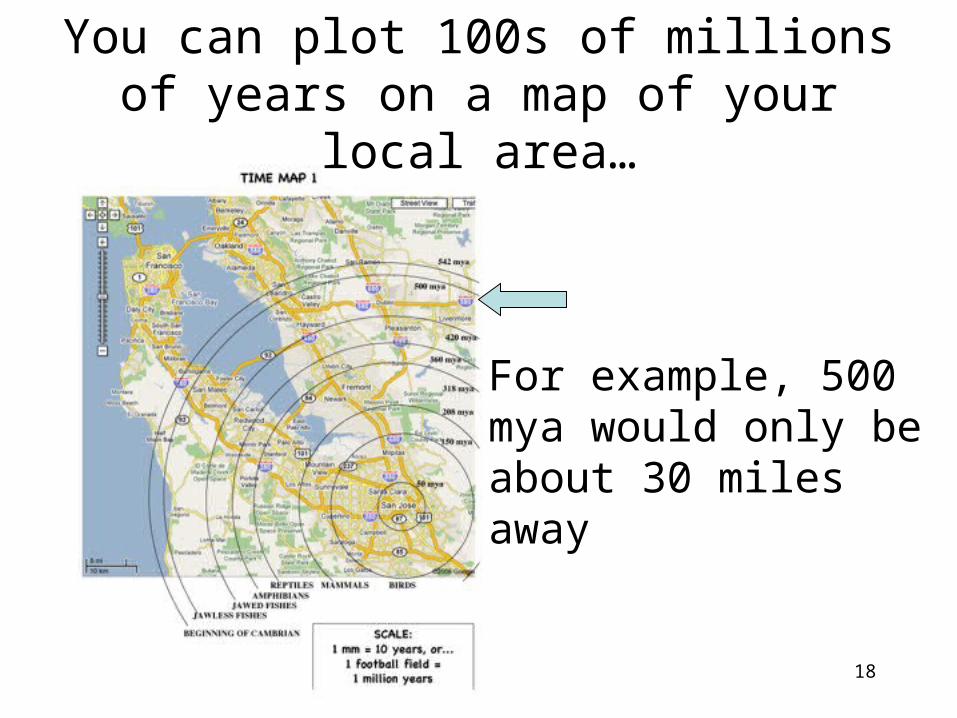
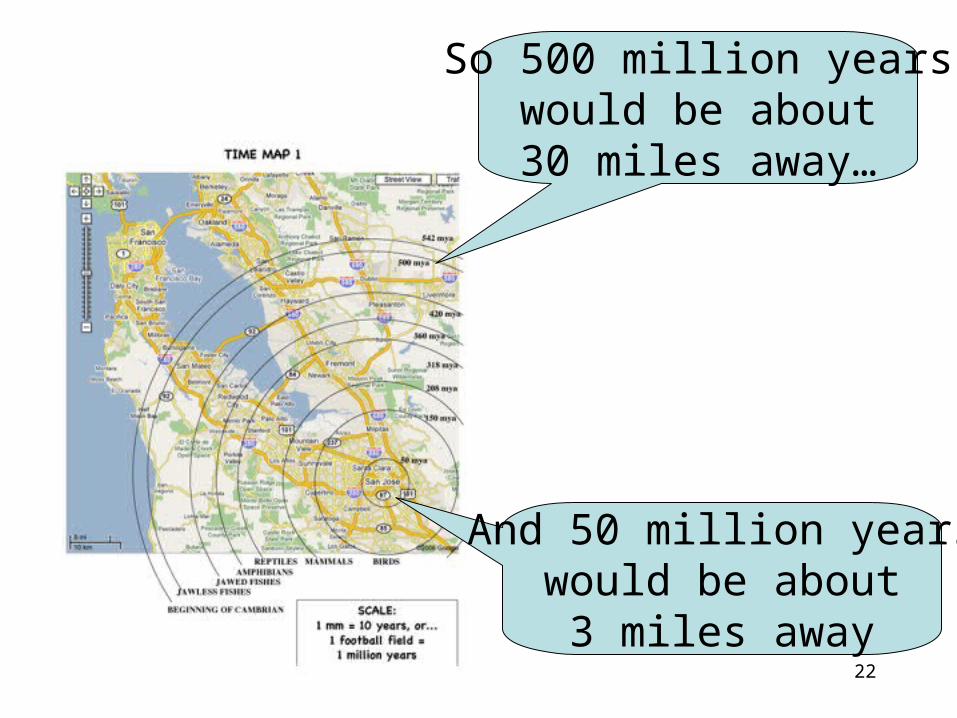
You can plot 100s of millions of years on a map of your local area…
For example, 500 mya would only be about 30 miles away
19
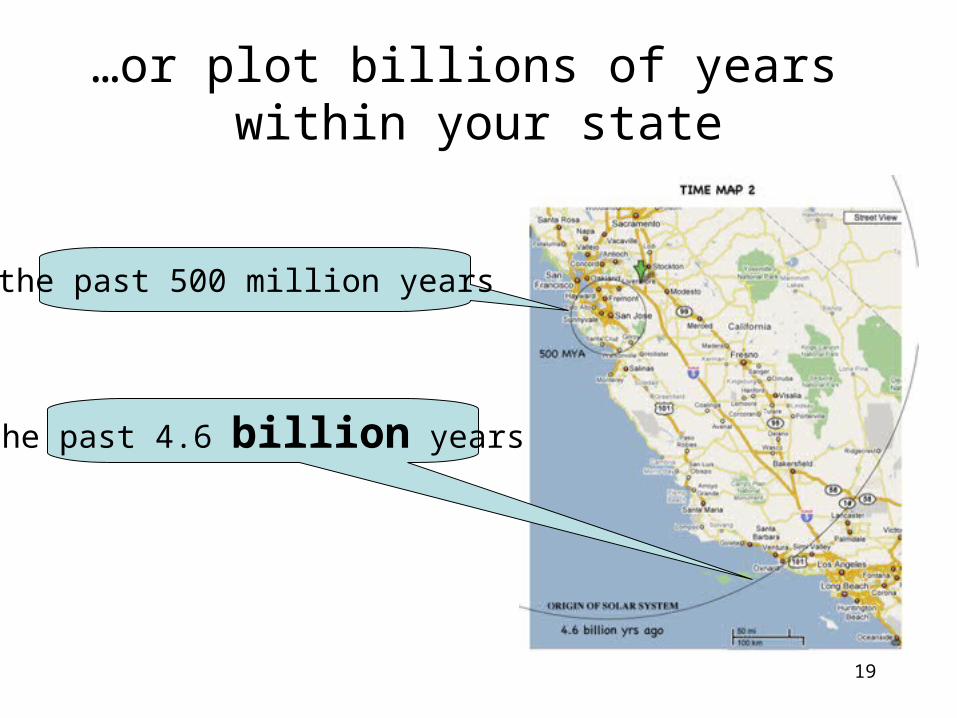
…or plot billions of years within your state
the past 500 million years
the past 4.6 billion years
20
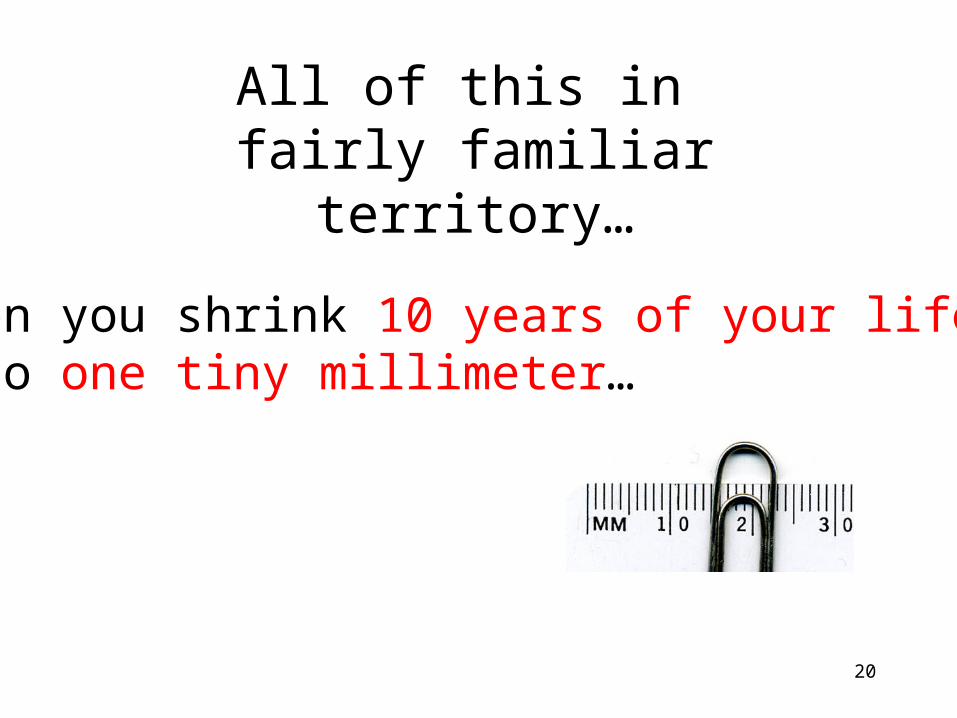
All of this in fairly familiar territory…
When you shrink 10 years of your lifeinto one tiny millimeter…
21
a million years equals
a football field!
22
And 50 million years would be about
3 miles away
So 500 million years would be about 30 miles away…
23
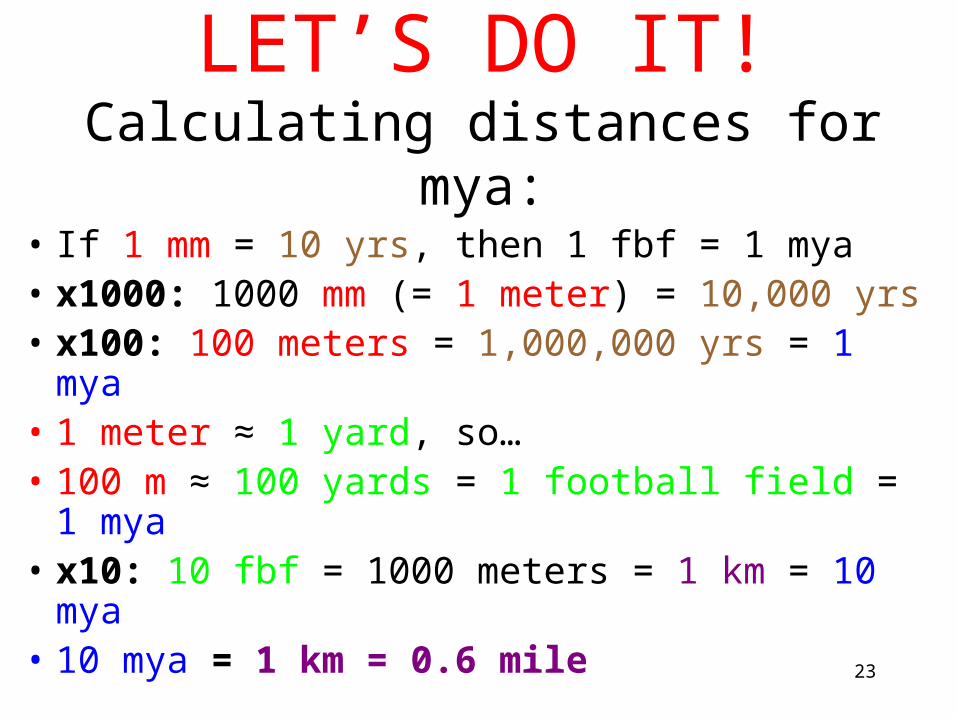
LET’S DO IT!Calculating distances for
mya:• If 1 mm = 10 yrs, then 1 fbf = 1 mya• x1000: 1000 mm (= 1 meter) = 10,000 yrs• x100: 100 meters = 1,000,000 yrs = 1 mya• 1 meter ≈ 1 yard, so…• 100 m ≈ 100 yards = 1 football field = 1
mya• x10: 10 fbf = 1000 meters = 1 km = 10
mya• 10 mya = 1 km = 0.6 mile
24
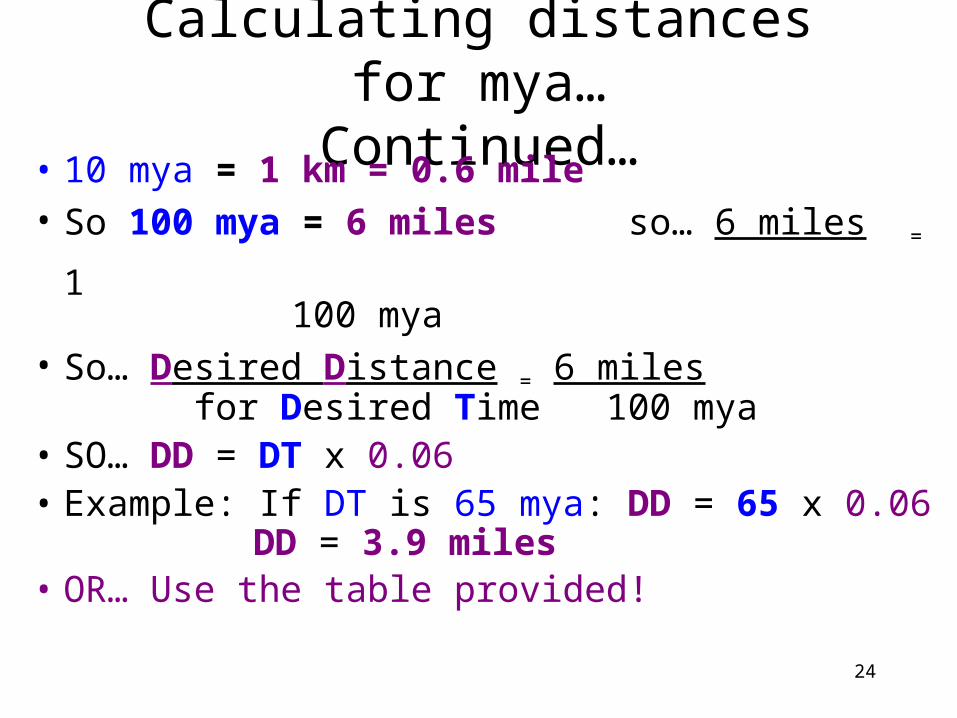
Calculating distances for mya…
Continued…• 10 mya = 1 km = 0.6 mile
• So 100 mya = 6 miles so… 6 miles = 1 100 mya
• So… Desired Distance = 6 miles for Desired Time 100 mya
• SO… DD = DT x 0.06• Example: If DT is 65 mya: DD = 65 x 0.06
DD = 3.9 miles• OR… Use the table provided!
25
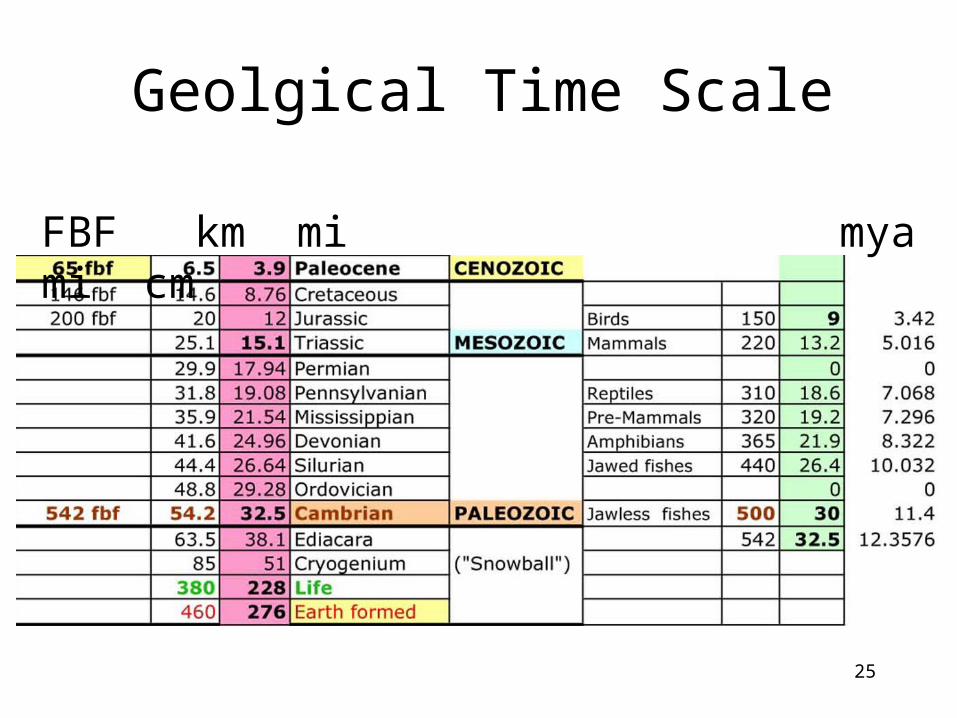
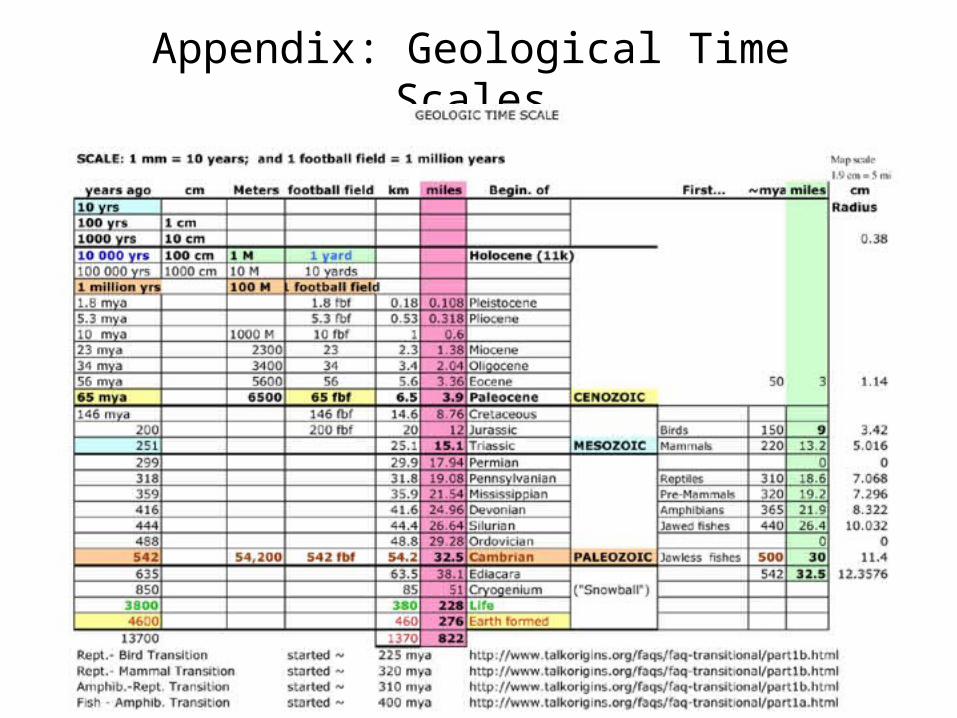
Geolgical Time Scale
FBF km mi mya mi cm
26
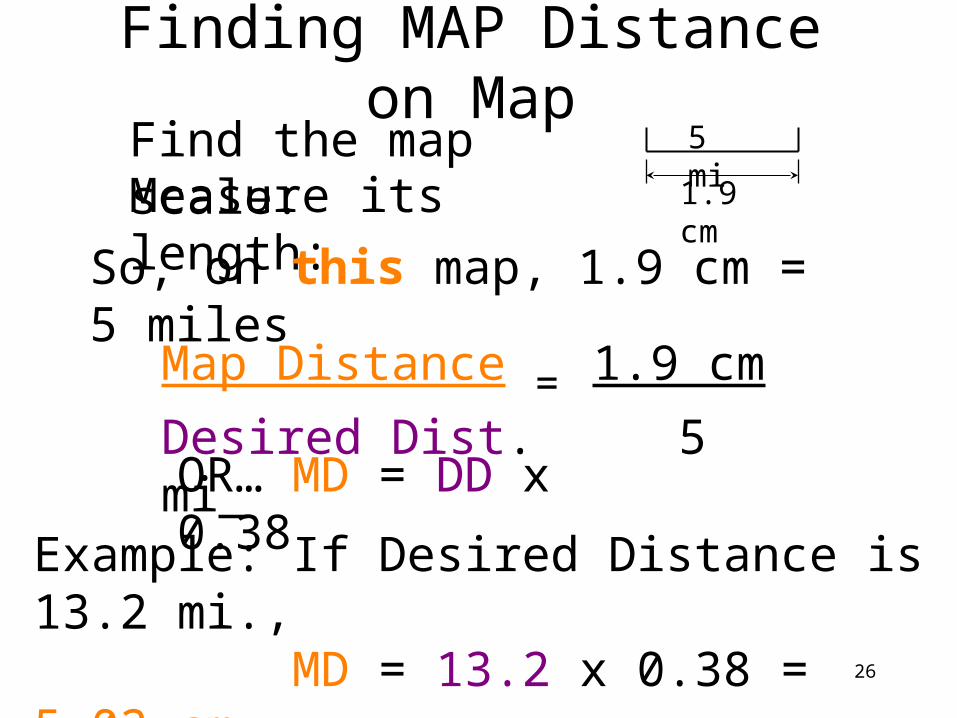
Finding MAP Distance on Map
Find the map scale: 1.9
cm
5 miMeasure its
length:So, on this map, 1.9 cm = 5 miles
Map Distance = 1.9 cm
Desired Dist. 5 mi OR… MD = DD x 0.38 Example: If Desired Distance is 13.2
mi., MD = 13.2 x 0.38 = 5.02 cm
27
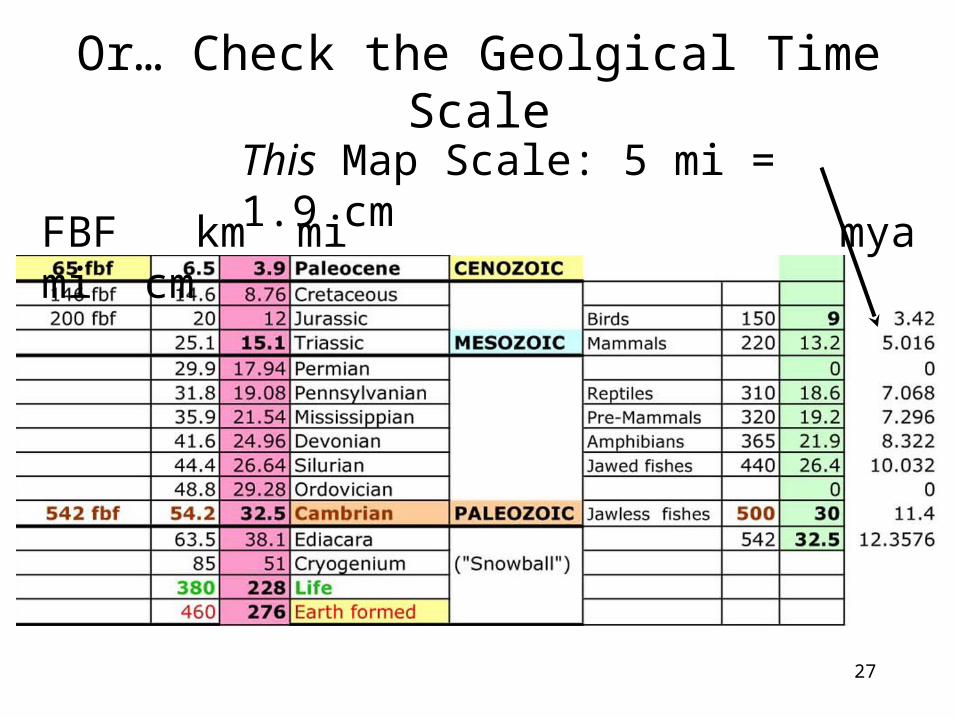
Or… Check the Geolgical Time Scale
FBF km mi mya mi cm
This Map Scale: 5 mi = 1.9 cm
28
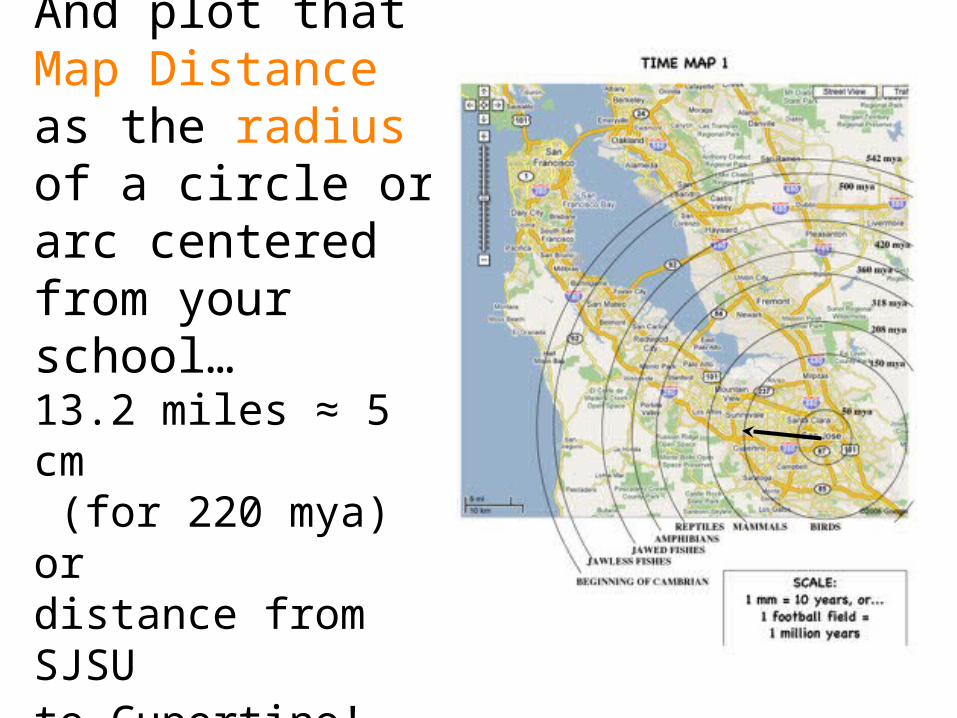
And plot that Map Distance as the radius of a circle or arc centered from your school…13.2 miles ≈ 5 cm
(for 220 mya) ordistance from SJSUto Cupertino!
29
Now, when you see the 10s of millions of years
that separate the origins of the different
classes of vertebrates,
30
you will have a much better sense of the vastness of that time.
31
In order to get more familiar with those vertebrate classes,
and when their first fossils appeared,
You may be asked to make your very own
“Chronology of Fossil Vertebrates”
Your Own Vertebrate Timeline
32
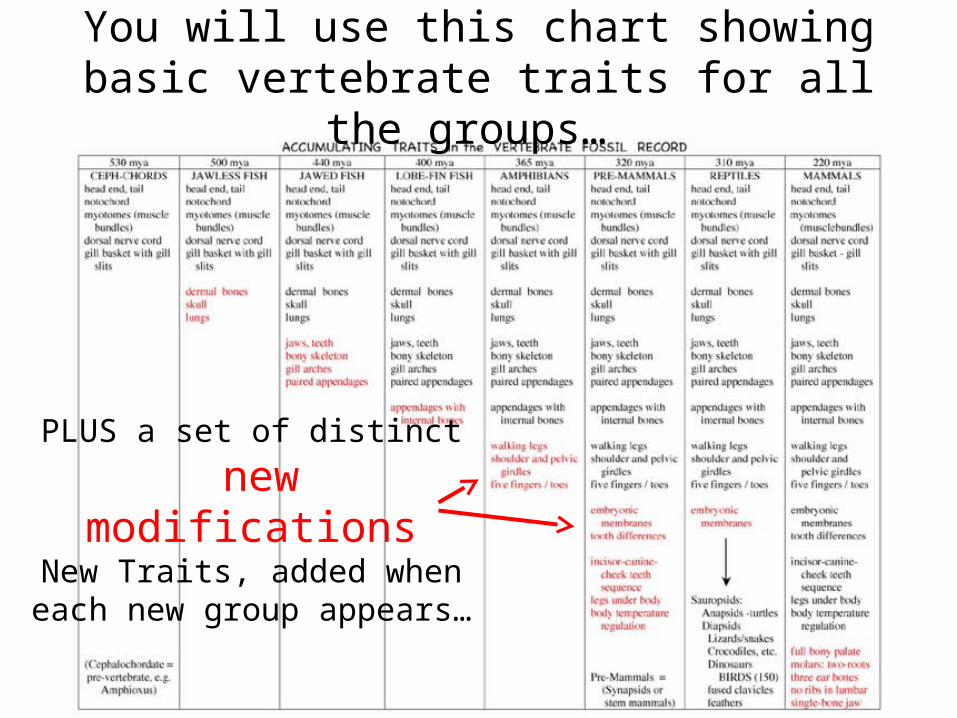
You will use this chart showing basic vertebrate traits for all the groups…
PLUS a set of distinct
new modificationsNew Traits, added when
each new group appears…
33
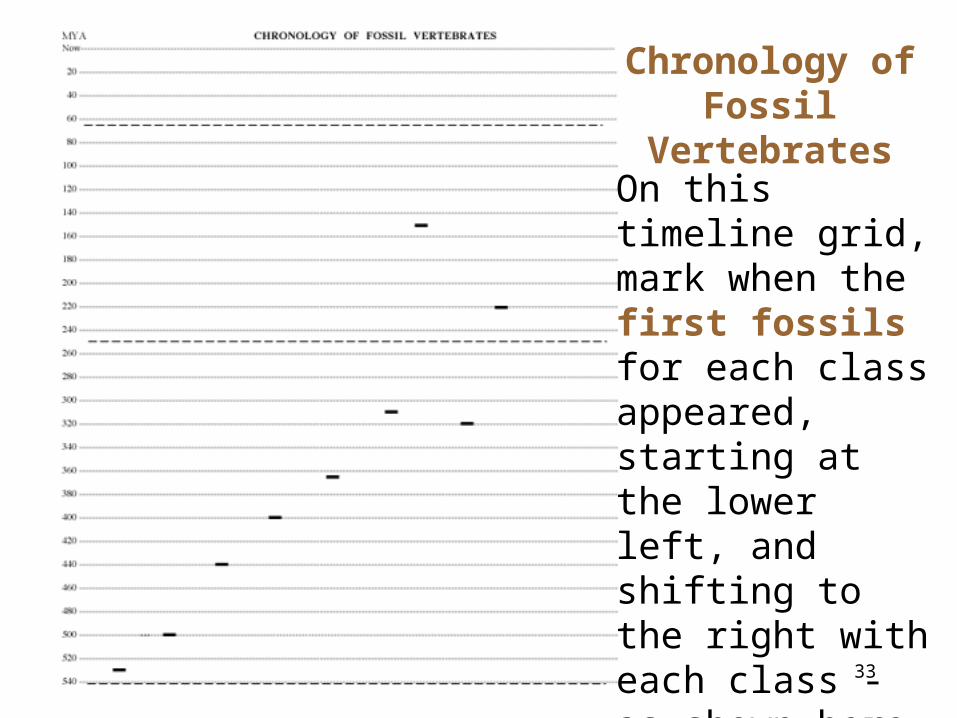
Chronology of Fossil
VertebratesOn this timeline grid, mark when the first fossils for each class appeared, starting at the lower left, and shifting to the right with each class -as shown here…
34
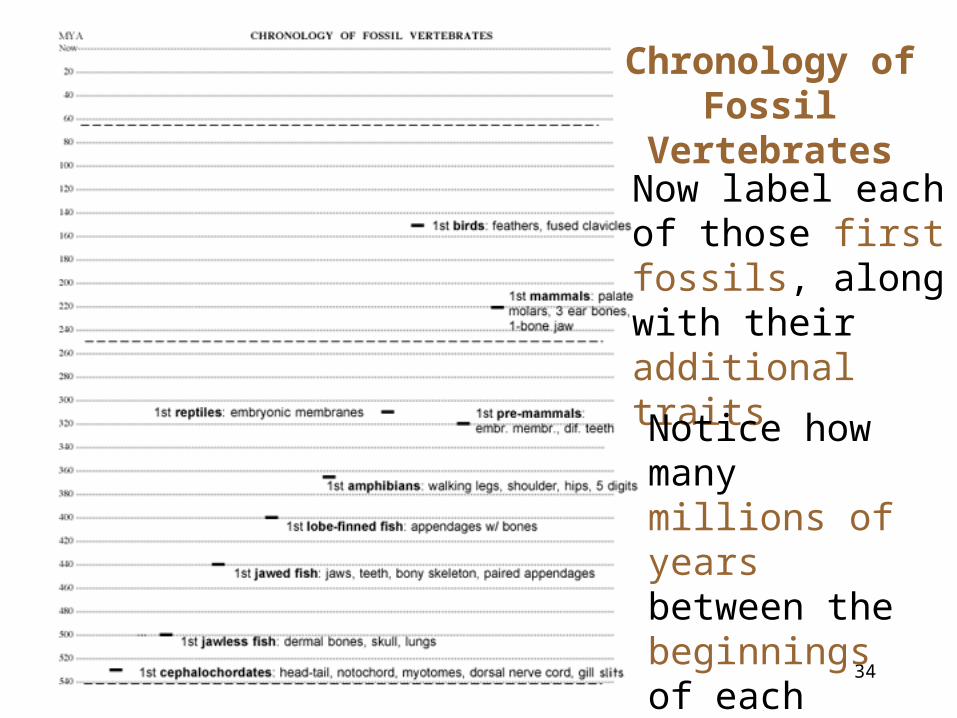
Chronology of Fossil
VertebratesNow label each of those first fossils, along with their additional traits
Notice how many millions of years between the beginnings of each group…
35
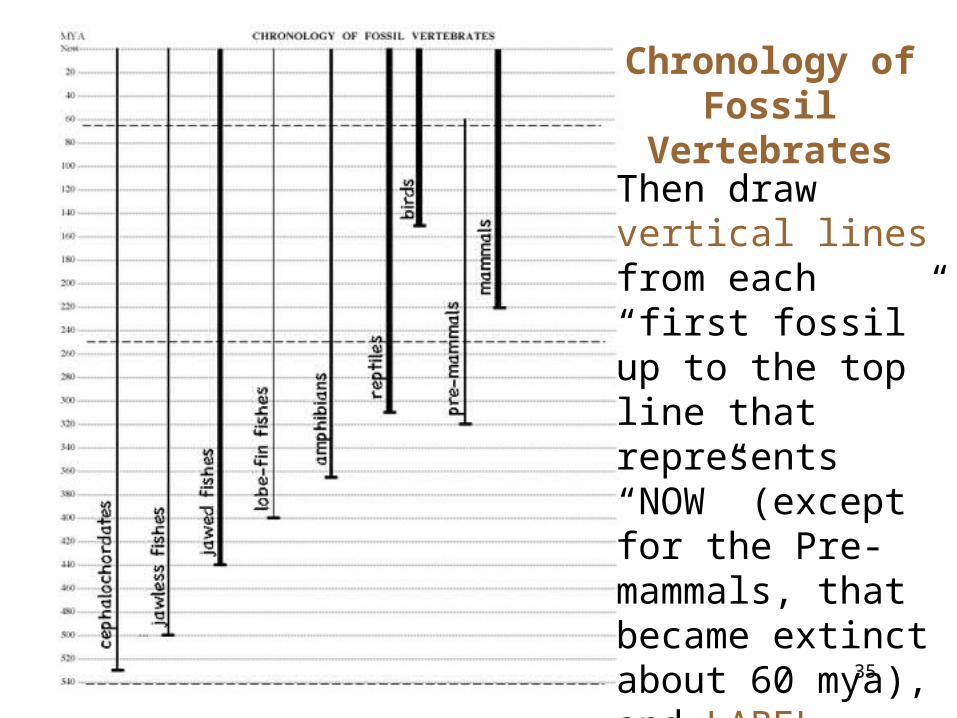
Chronology of Fossil
VertebratesThen draw vertical lines from each “first fossil” up to the top line that represents “NOW” (except for the Pre-mammals, that became extinct about 60 mya), and LABEL EACH.
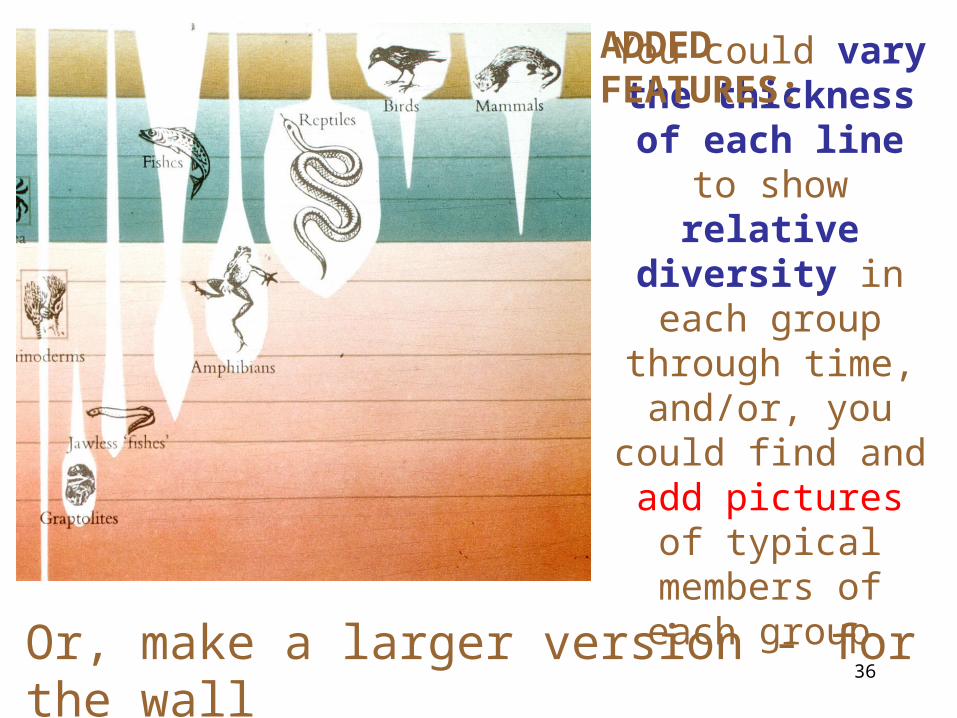
36
You could vary the thickness of each line to show relative diversity in each group
through time, and/or, you
could find and add pictures of
typical members of each group.
ADDED FEATURES:
Or, make a larger version - for the wall
37
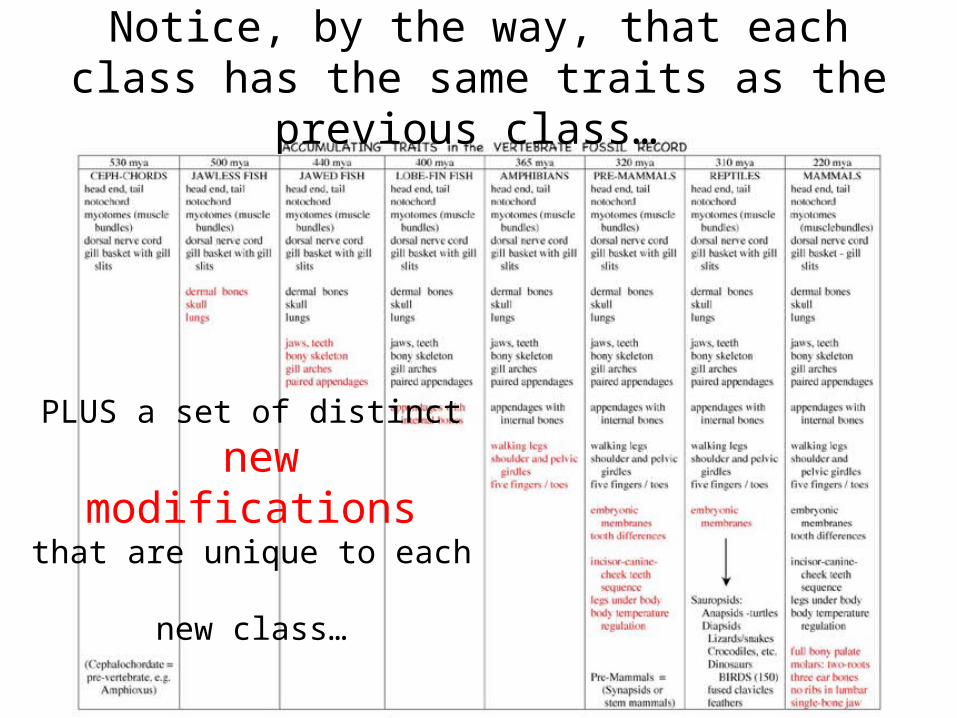
Notice, by the way, that each class has the same traits as the previous class…
PLUS a set of distinct
new modificationsthat are unique to each
new class…
38
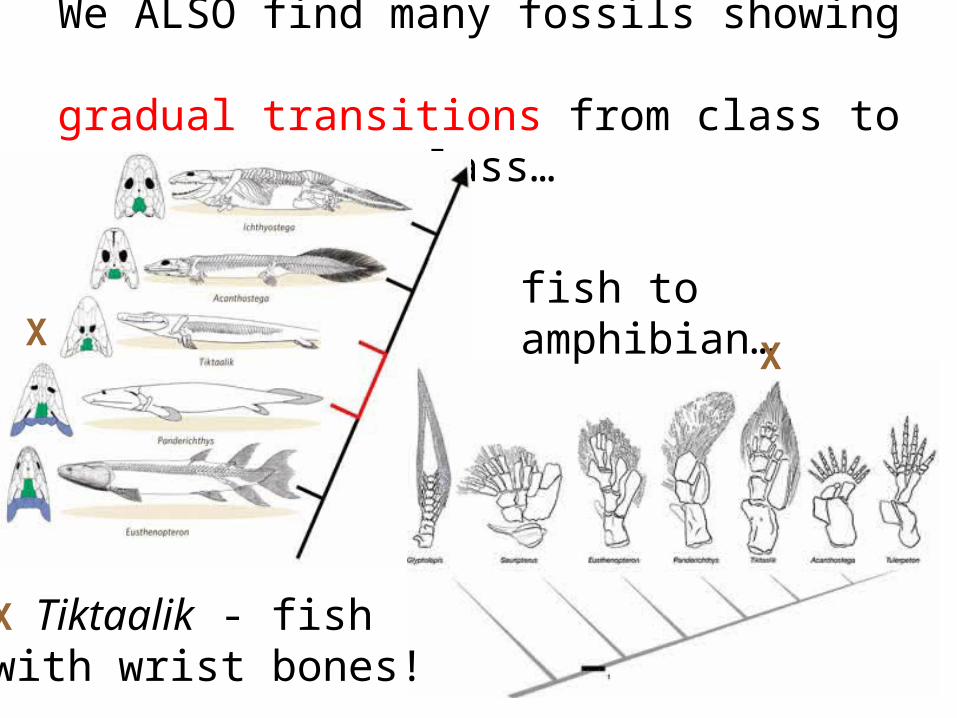
We ALSO find many fossils showing gradual transitions from class to class…
fish to amphibian…
X Tiktaalik - fishwith wrist bones!
XX
39
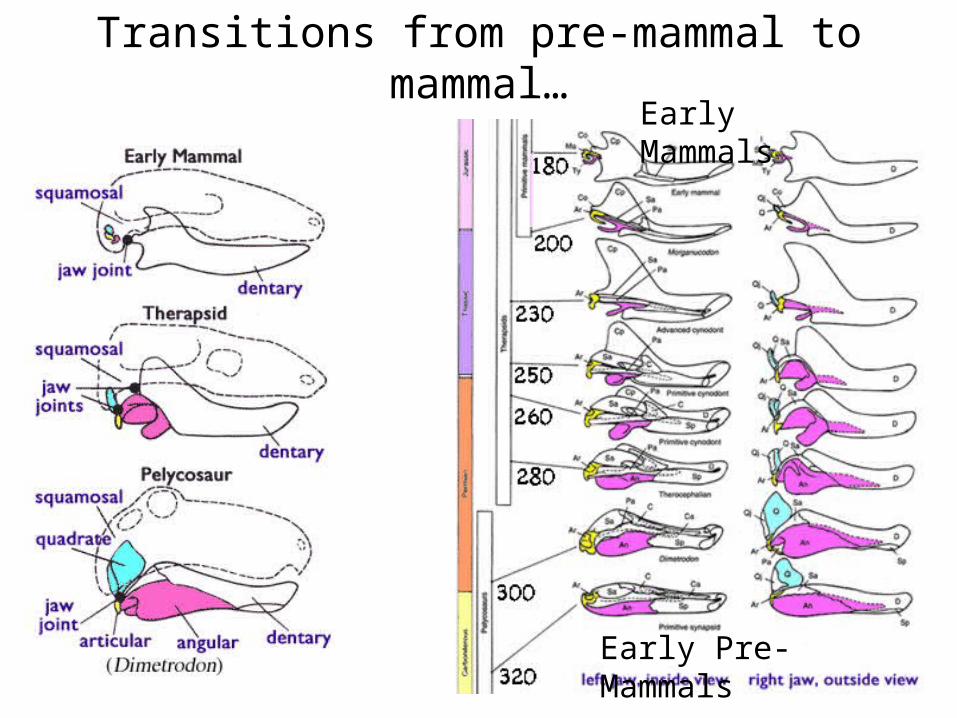
Transitions from pre-mammal to mammal…
Early Pre-Mammals
Early Mammals
40
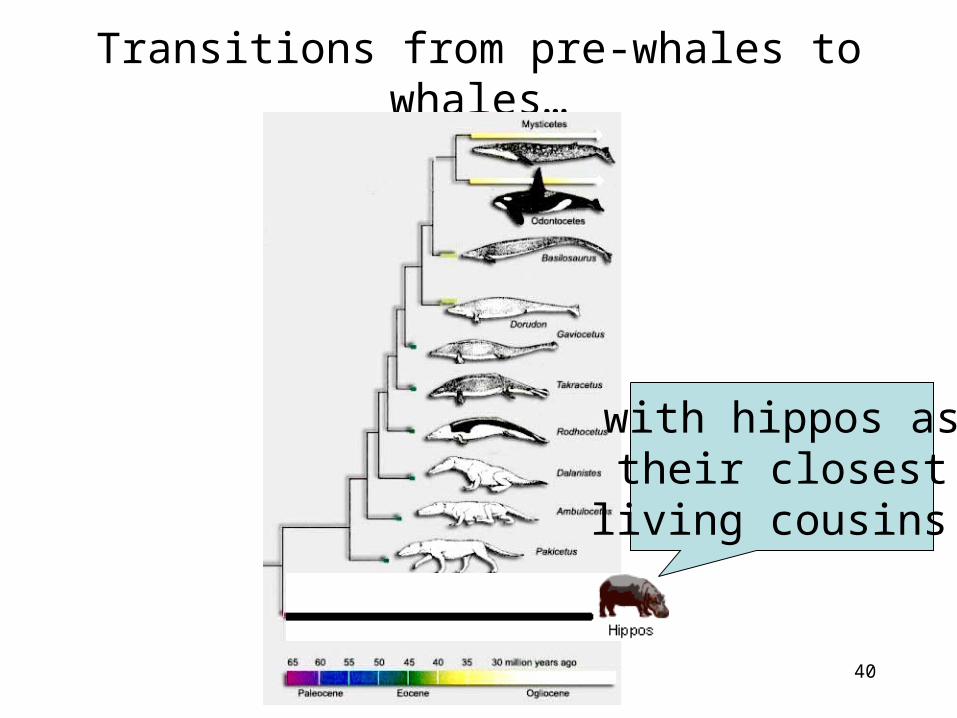
Transitions from pre-whales to whales…
with hippos astheir closest
living cousins!
41
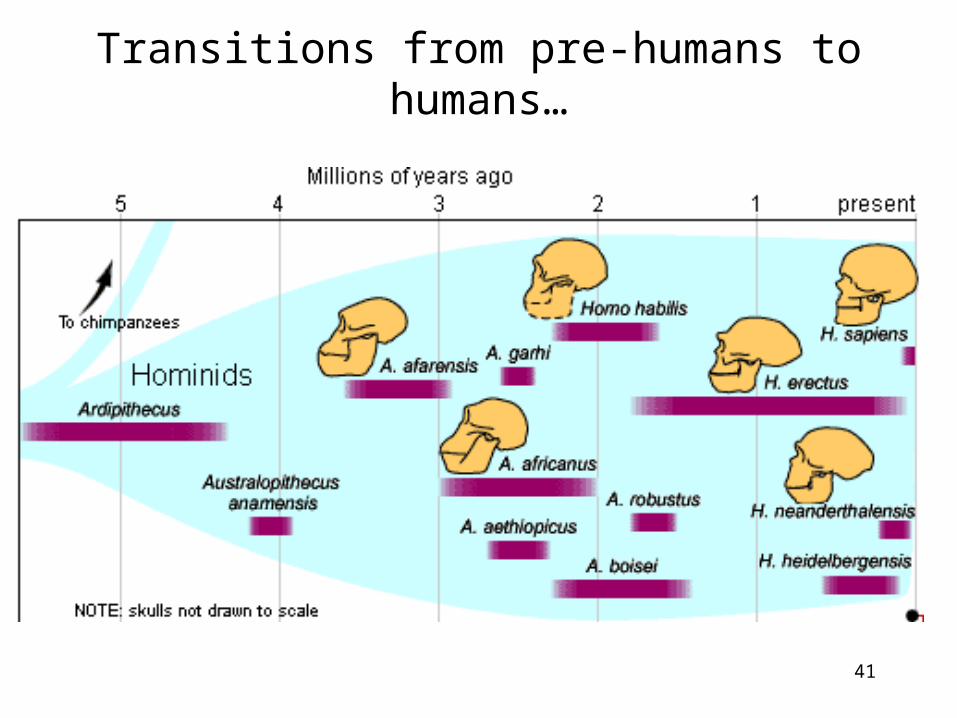
Transitions from pre-humans to humans…
42
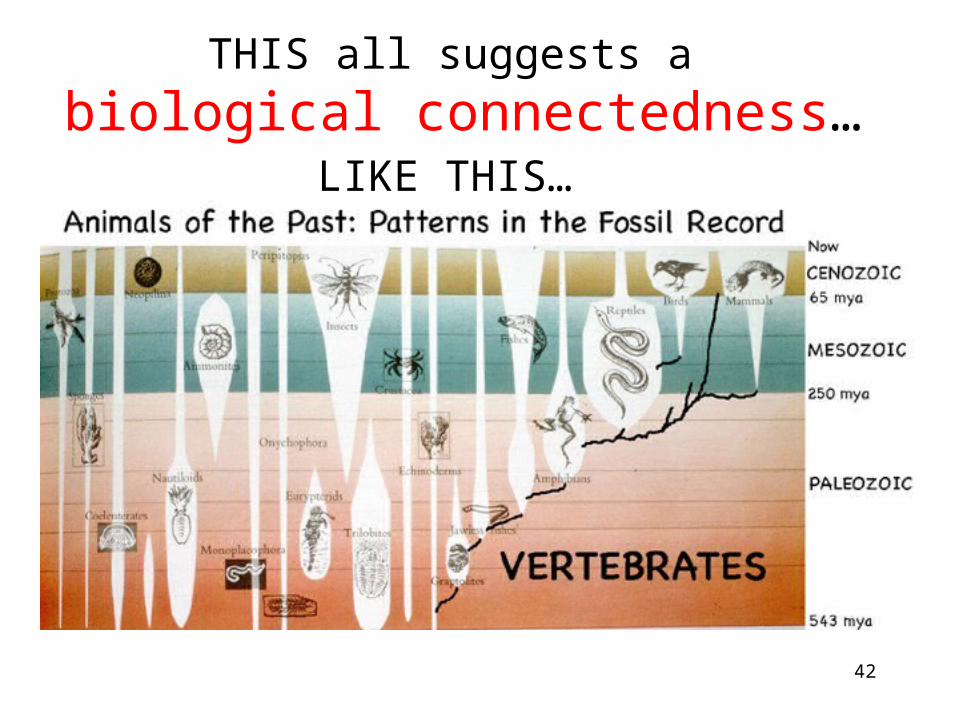
THIS all suggests a biological connectedness…
LIKE THIS…
43
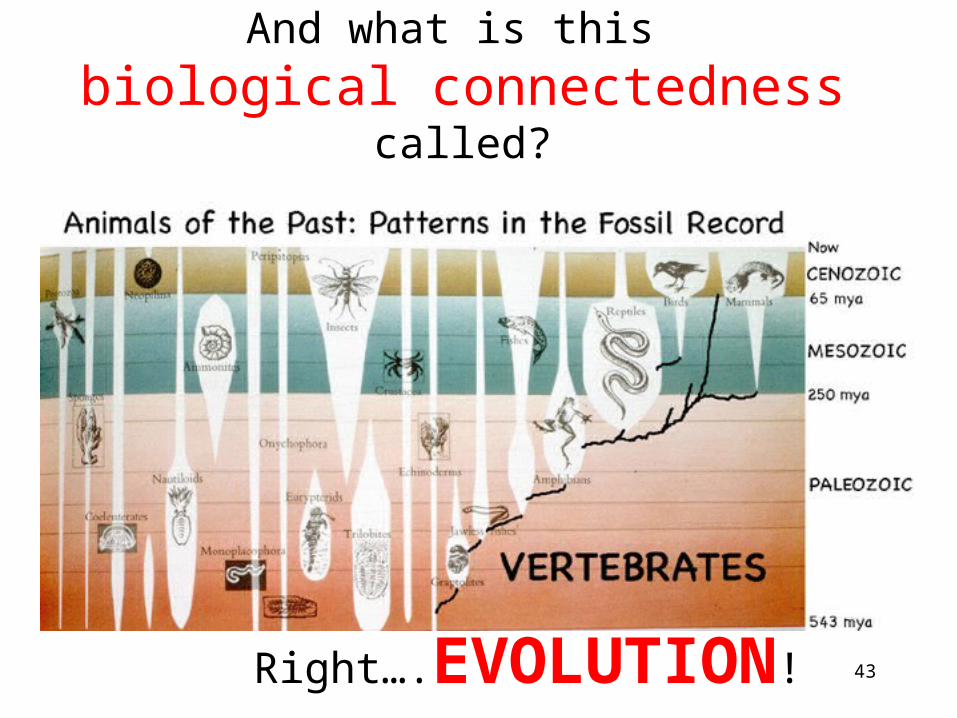
And what is this biological connectedness called?
Right….EVOLUTION!
44
Did this experience give you a better sense of
geological time?
Did this experience reveal patterns of fossils
that you didn’t realize before?

45
I hope you enjoyed these…
46
Appendix: Geological Time Scales
47
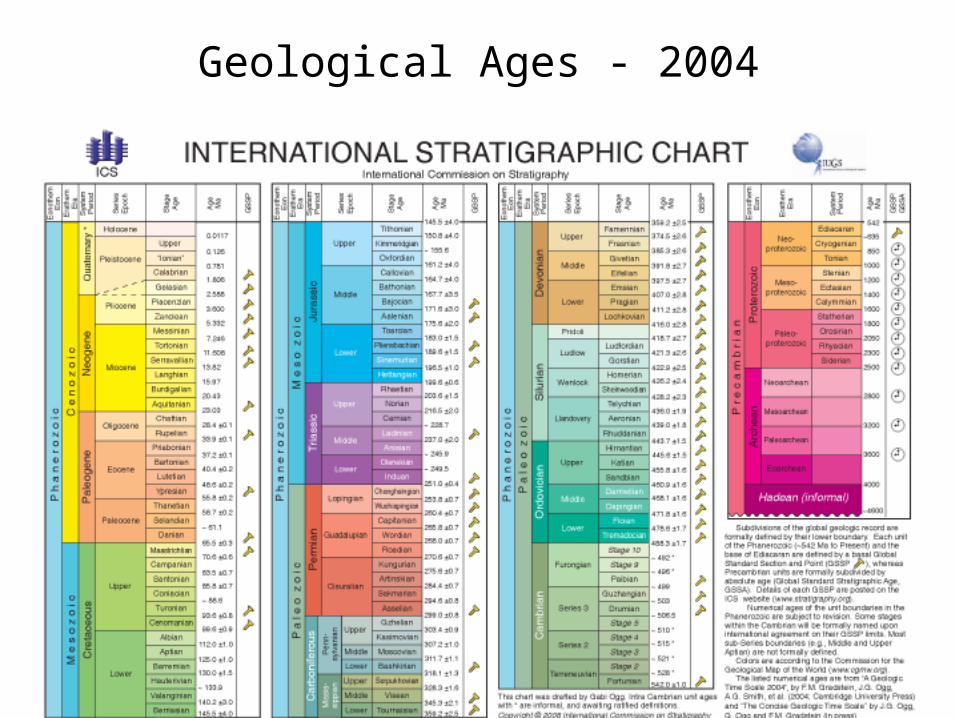
Geological Ages - 2004
48
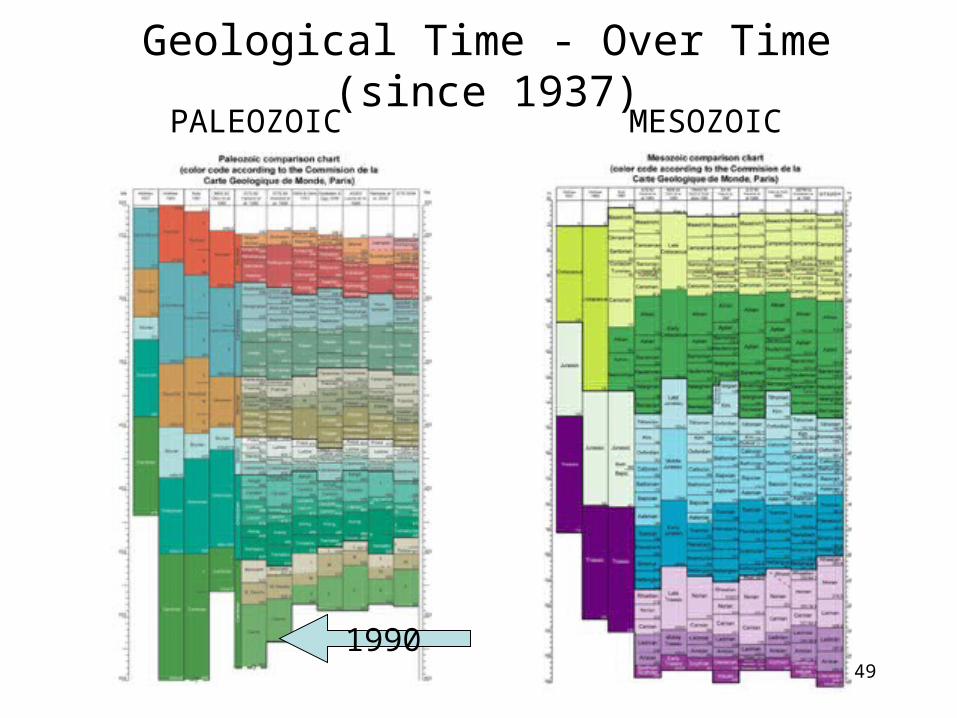
Geological Time - Over Time (since 1937)
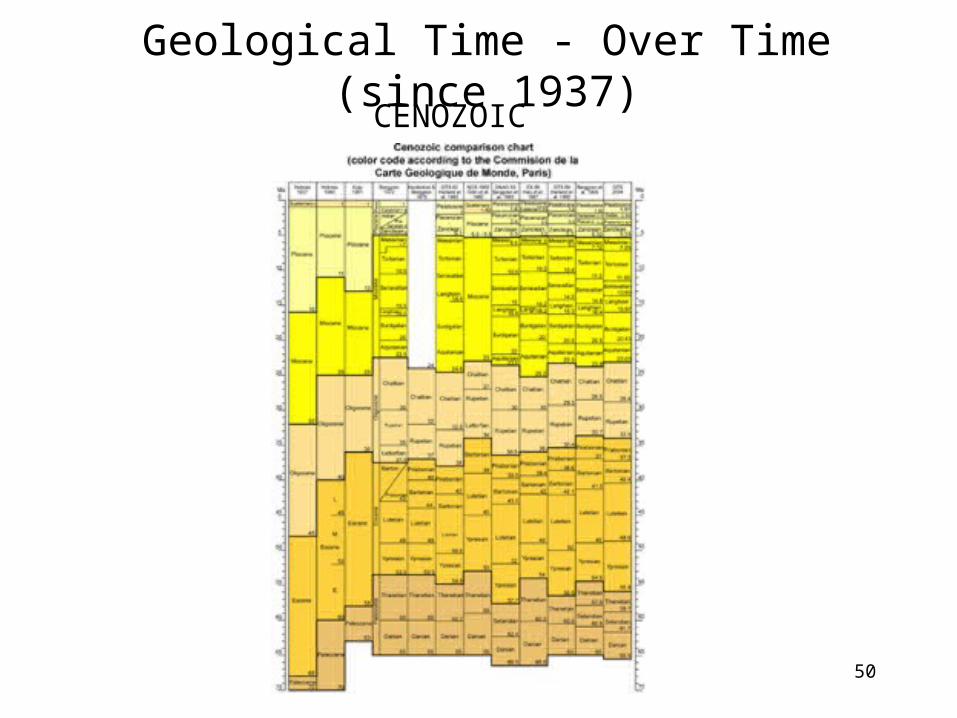
The next 2 slides show how the increased precision of
radiometric dating over the years has stabalized the timing for the major geological periods
- with little change since 1990…
49
Geological Time - Over Time (since 1937)
PALEOZOIC MESOZOIC
1990
50
Geological Time - Over Time (since 1937)
CENOZOIC

51
LOOKING FOR TEACHERS TOBETA-TEST
PATTERNS IN TIMEon the ENSI website
Try it, and please send me your feedback
All levels - 5th through college