Embed Size (px)
Citation preview

1
jb
Fisher Center Real Estate ConferenceApril 22, 2013
Dean Wehrli, Vice President

2
2012 Was A Great Year
• Home Prices and SalesRates Were Up
• Giants won the World Series
• Stanford won the Rose Bowl

3
Northern California Price Appreciation Among the Best Nationally
• This is great news for private builders who need equity partners.
• This is also why the public builders are allocating capital to Northern CA
Source: John Burns Real Estate Consulting, Metro Analysis & Forecast, April 2013
4%
4%
5%
5%
6%
6%
6%
7%
7%
7%
7%
8%
9%
9%
12%
12%
13%
13%
14%
15%
16%
17%
22%
0% 5% 10% 15% 20% 25%
Atlanta, GA
Chicago, IL
Charlotte, NC-SC
New York, NY-NJ
Boston, MA-NH
Portland, OR-WA
Los Angeles, CA
Oakland, CA
Minneapolis, MN-WI
Tampa, FL
Seattle, WA
Washington D.C.
Dallas/Fort Worth, TX
Miami, FL
Denver, CO
Orange County, CA
San Diego, CA
Riv/San Bern
San Francisco, CA
Sacramento, CA
San Jose, CA
Las Vegas, NV
Phoenix, AZ
Burns Home Value IndexTM
(12-month Change)

4
Foreclosure Starts Trending Down to Normal through 2014
Distressed still an Issue, but less so all the time

5
Agenda
1. Market Trends Near You
2. The Big Creep
3. Pros and the Cons

6
Cycles

7
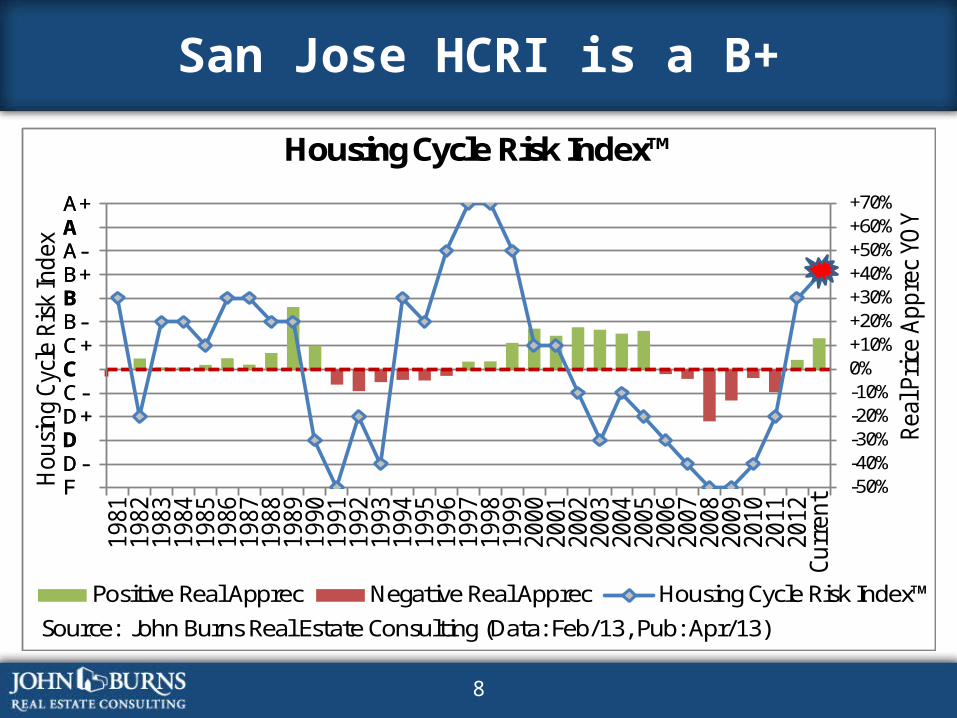
JBREC Housing Cycle Risk Index™ looks at4 major categories for fundamentals
I. Demand1. Total Buying Activity (New and Resale)2. Median Resale Price Appreciation3. Job Growth4. Population Growth5. Realtor Market Ratings
II. Supply6. Permit Trends7. Resale Listings
III. Affordability8. JBREC Affordability Index9. Home Equity 10. Mortgage Rates
IV. U.S. Economy
4 major categories, with 11 subcategories and 25 calculations
8
San Jose HCRI is a B+
-50%-40%-30%-20%-10%0%+10%+20%+30%+40%+50%+60%+70%
1981
1982
1983
1984
1985
1986
1987
1988
1989
1990
1991
1992
1993
1994
1995
1996
1997
1998
1999
2000
2001
2002
2003
2004
2005
2006
2007
2008
2009
2010
2011
2012
Curr
ent
Hou
sing
Cyc
le R
isk
Inde
x
Real
Pri
ce A
ppre
c YO
Y
Positive Real Apprec Negative Real Apprec Housing Cycle Risk Index™
A+AA-B+BB-C+CC-D+DD-F
Source: John Burns Real Estate Consulting (Data: Feb/13, Pub: Apr/13)
A+AA-B+BB-C+CC-D+DD-F
Housing Cycle Risk Index™

9
-50%-40%-30%-20%-10%0%+10%+20%+30%+40%+50%+60%+70%
1981
1982
1983
1984
1985
1986
1987
1988
1989
1990
1991
1992
1993
1994
1995
1996
1997
1998
1999
2000
2001
2002
2003
2004
2005
2006
2007
2008
2009
2010
2011
2012
Curr
ent
Hou
sing
Cyc
le R
isk
Inde
x
Real
Pri
ce A
ppre
c YO
Y
Positive Real Apprec Negative Real Apprec Housing Cycle Risk Index™
A+AA-B+BB-C+CC-D+DD-F
Source: John Burns Real Estate Consulting (Data: Feb/13, Pub: Apr/13)
A+AA-B+BB-C+CC-D+DD-F
Housing Cycle Risk Index™
San Francisco HCRI is a B+
10
-50%-40%-30%-20%-10%0%+10%+20%+30%+40%+50%+60%+70%
1981
1982
1983
1984
1985
1986
1987
1988
1989
1990
1991
1992
1993
1994
1995
1996
1997
1998
1999
2000
2001
2002
2003
2004
2005
2006
2007
2008
2009
2010
2011
2012
Curr
ent
Hou
sing
Cyc
le R
isk
Inde
x
Real
Pri
ce A
ppre
c YO
Y
Positive Real Apprec Negative Real Apprec Housing Cycle Risk Index™
A+AA-B+BB-C+CC-D+DD-F
Source: John Burns Real Estate Consulting (Data: Feb/13, Pub: Apr/13)
A+AA-B+BB-C+CC-D+DD-F
Housing Cycle Risk Index™
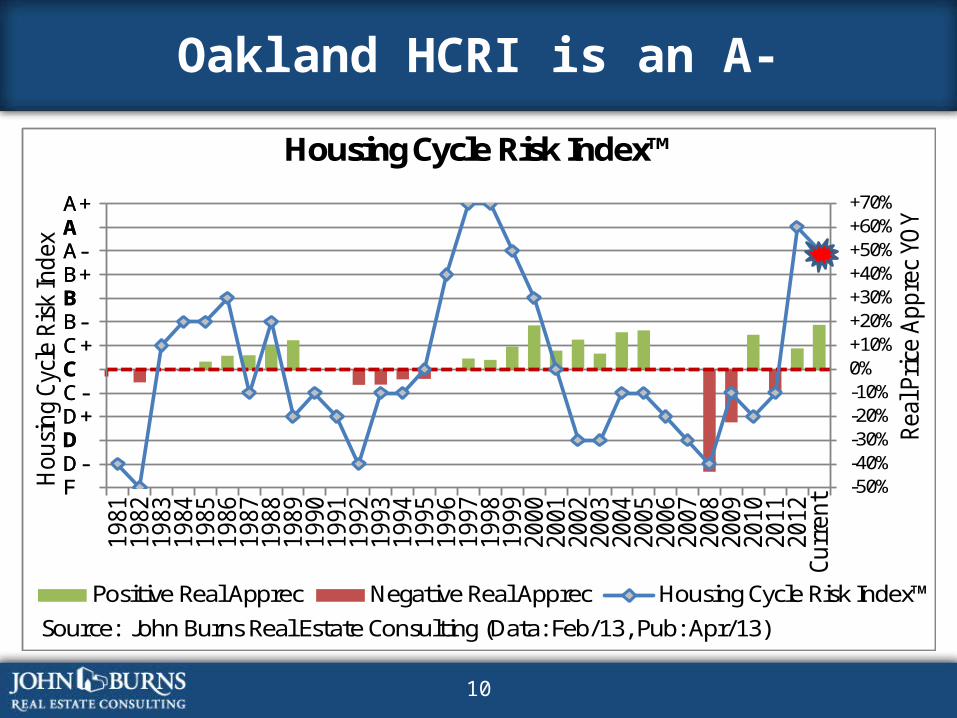
Oakland HCRI is an A-

11
-50%-40%-30%-20%-10%0%+10%+20%+30%+40%+50%+60%+70%
1981
1982
1983
1984
1985
1986
1987
1988
1989
1990
1991
1992
1993
1994
1995
1996
1997
1998
1999
2000
2001
2002
2003
2004
2005
2006
2007
2008
2009
2010
2011
2012
Curr
ent
Hou
sing
Cyc
le R
isk
Inde
x
Real
Pri
ce A
ppre
c YO
Y
Positive Real Apprec Negative Real Apprec Housing Cycle Risk Index™
A+AA-B+BB-C+CC-D+DD-F
Source: John Burns Real Estate Consulting (Data: Feb/13, Pub: Apr/13)
A+AA-B+BB-C+CC-D+DD-F
Housing Cycle Risk Index™
Sacramento HCRI is an A

12
Sales

13
San Jose new home sales growth through 2016 – but still below 2007 levels
Source: John Burns Real Estate Consulting, Metro Analysis & Forecast, April 2013
0
500
1,000
1,500
2,000
2,500
3,000
3,500
4,000
4,500
5,00019
8819
8919
9019
9119
9219
9319
9419
9519
9619
9719
9819
9920
0020
0120
0220
0320
0420
0520
0620
0720
0820
0920
1020
1120
12C
urre
nt20
13P
2014
P20
15P
2016
P20
17P
ANNUAL NEW HOME SALES

14
Oakland same story – new home sales to near 6,000 in 2016, but still below 2006
Source: John Burns Real Estate Consulting, Metro Analysis & Forecast, April 2013
0
2,000
4,000
6,000
8,000
10,000
12,00019
8819
8919
9019
9119
9219
9319
9419
9519
9619
9719
9819
9920
0020
0120
0220
0320
0420
0520
0620
0720
0820
0920
1020
1120
12C
urre
nt20
13P
2014
P20
15P
2016
P20
17P
ANNUAL NEW HOME SALES

15
Sacramento also better bit below the norm - INVENTORY
Source: John Burns Real Estate Consulting, Metro Analysis & Forecast, April 2013
0
2,000
4,000
6,000
8,000
10,000
12,000
14,000
16,000
18,00019
8819
8919
9019
9119
9219
9319
9419
9519
9619
9719
9819
9920
0020
0120
0220
0320
0420
0520
0620
0720
0820
0920
1020
1120
12C
urre
nt20
13P
2014
P20
15P
2016
P20
17P
ANNUAL NEW HOME SALES

16
Prices

17
Huge near-term appreciation in San Jose
Source: John Burns Real Estate Consulting, Metro Analysis & Forecast, April 2013
$0
$100,000
$200,000
$300,000
$400,000
$500,000
$600,000
$700,000
1988
1989
1990
1991
1992
1993
1994
1995
1996
1997
1998
1999
2000
2001
2002
2003
2004
2005
2006
2007
2008
2009
2010
2011
2012
Cur
rent
ANNUAL MEDIAN NEW HOME PRICE
16%
11%
6%
3%1%
0%
2%
4%
6%
8%
10%
12%
14%
16%
18%
2013P 2014P 2015P 2016P 2017P
New Home Price Appreciation Forecast

18
Milder but still strong in Oakland
Source: John Burns Real Estate Consulting, Metro Analysis & Forecast, April 2013
$0
$100,000
$200,000
$300,000
$400,000
$500,000
$600,000
$700,000
1988
1989
1990
1991
1992
1993
1994
1995
1996
1997
1998
1999
2000
2001
2002
2003
2004
2005
2006
2007
2008
2009
2010
2011
2012
Cur
rent
ANNUAL MEDIAN NEW HOME PRICE
9% 9%
6%
3%
1%
0%1%2%3%4%5%6%7%8%9%
10%
2013P 2014P 2015P 2016P 2017P
New Home Price Appreciation Forecast

19
Nowhere to go but up in Sacramento
Source: John Burns Real Estate Consulting, Metro Analysis & Forecast, April 2013
$0
$50,000
$100,000
$150,000
$200,000
$250,000
$300,000
$350,000
$400,000
$450,000
$500,000
1988
1989
1990
1991
1992
1993
1994
1995
1996
1997
1998
1999
2000
2001
2002
2003
2004
2005
2006
2007
2008
2009
2010
2011
2012
Cur
rent
ANNUAL MEDIAN NEW HOME PRICE
16%14%
8%
4%
1%0%
2%
4%
6%
8%
10%
12%
14%
16%
18%
2013P 2014P 2015P 2016P 2017P
New Home Price Appreciation Forecast

20
New home share of total sales. Not the norm – below even the mid-1990s
Source: John Burns Real Estate Consulting, Metro Analysis & Forecast, April 2013
0%
10%
20%
30%
40%
50%
60%19
89
1990
1991
1992
1993
1994
1995
1996
1997
1998
1999
2000
2001
2002
2003
2004
2005
2006
2007
2008
2009
2010
2011
2012
Cur
rent
Sacramento Oakland San Jose Stockton Fresno

21
Monthly inventory levels – neither is this
Source: John Burns Real Estate Consulting, Metro Analysis & Forecast, April 2013
0
2
4
6
8
10
12
14
16
2005 2006 2007 2008 2009 2010 2011 2012
Sacramento Oakland San Jose Stockton Fresno

22
Agenda
1. Market Trends Near You
2. The Big Creep
3. Pros and the Cons

23
Nowhere worked

24
Call me if it’s in the core

25
Call Us

26
Please can we buy your land? Pretty please?

27
Agenda
1. Market Trends Near You
2. The Big Creep
3. Pros and the Cons

28
The Good
• Economy Picking Up: Knocking on wood.• Boomerang Buyers: Itching to get back into the
for-sale market.• Urgency Back: Prices not falling and how long will
these mortgage rates last? • Inventory: How low can it go?• Rising Prices: With a vengeance.• Rising Sales: But already supply constrained.

29
10% of 2013 demand from “boomerang” buyers

30
The “Concerning”
• Prices Rising: Low payments still, but price to income not great anymore.
• Mortgage Rates: Have to go up – and with them the payments to price ratio.
• Investors: Organic buyers often shut out. • Inventory: Resales inventory has to go up – the
chicken and egg phenomenon.• No Place to Build: We need to get lots to the
market.• Be Careful of the Hype: But a hot market will
eventually lead to mistakes.

31
The Big Re-Set
The Big Switch Flip
The Bi-Polar Market

32
Prices vs. Payments
Metro Normal Current Difference Normal Current DifferenceSan Jose 6.0 7.5 1.5 60.1% 53.7% -6.4%San Francisco 7.9 10.2 2.3 78.4% 73.3% -5.1%Oakland 4.7 5.2 0.5 47.6% 37.5% -10.1%Sacramento 4.0 3.7 -0.3 39.9% 26.6% -13.3%Stockton 4.4 3.5 -0.9 44.7% 25.1% -19.6%Fresno 3.8 3.5 -0.3 39.2% 25.3% -13.9%
Payment to Income RatioPrice to Income Ratio
Source: John Burns Real Estate Consulting, Metro Analysis & Forecast, April 2013
• Core marks already above the long-term norm – though we may have a new normal that is still a little concerning.
• Low mortgage rates leave room to grow – at least for the near term.