Embed Size (px)
Citation preview

1 Jim Grayson, PhD MSC 605
MSC 605MSC 605
Design of ExperimentsDesign of Experiments

2 Jim Grayson, PhD MSC 605
DESIGN OF EXPERIMENTSDESIGN OF EXPERIMENTS
Purposeful changes of the inputs (factors) to a process in order to observe corresponding changes in the output (response).
ProcessInputs Outputs
Douglas Montgomery, Design and Analysis of Experiments
3 Jim Grayson, PhD MSC 605
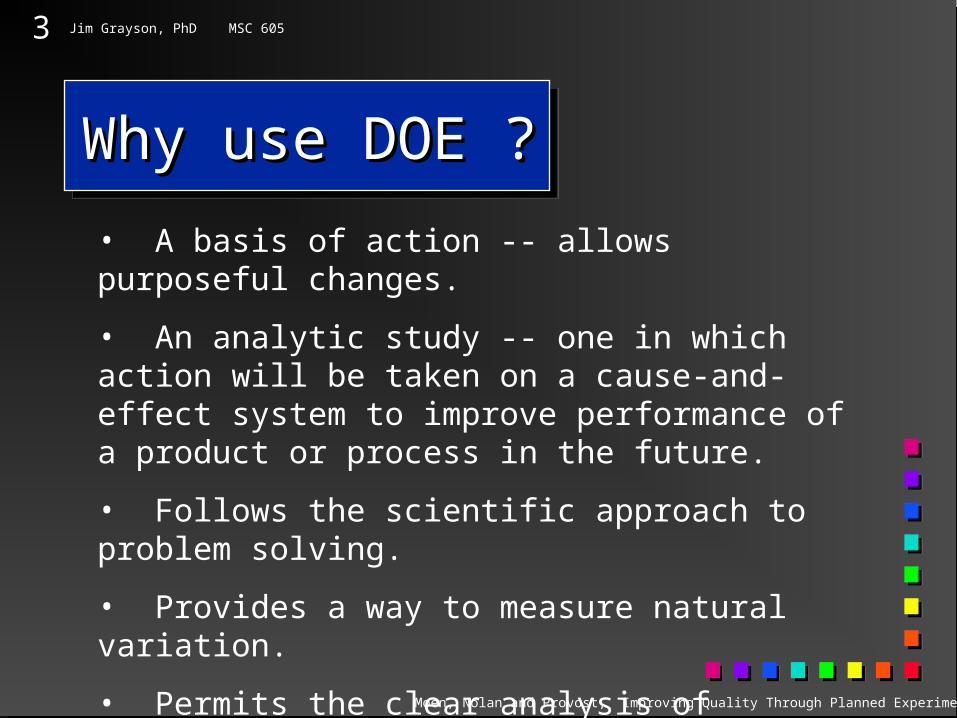
Why use DOE ?Why use DOE ?
• A basis of action -- allows purposeful changes.
• An analytic study -- one in which action will be taken on a cause-and-effect system to improve performance of a product or process in the future.
• Follows the scientific approach to problem solving.
• Provides a way to measure natural variation.
• Permits the clear analysis of complex effects.
• Most efficient way to derive the required information at the least expenditure of resources.
Moen, Nolan and Provost, Improving Quality Through Planned Experimentation

4 Jim Grayson, PhD MSC 605
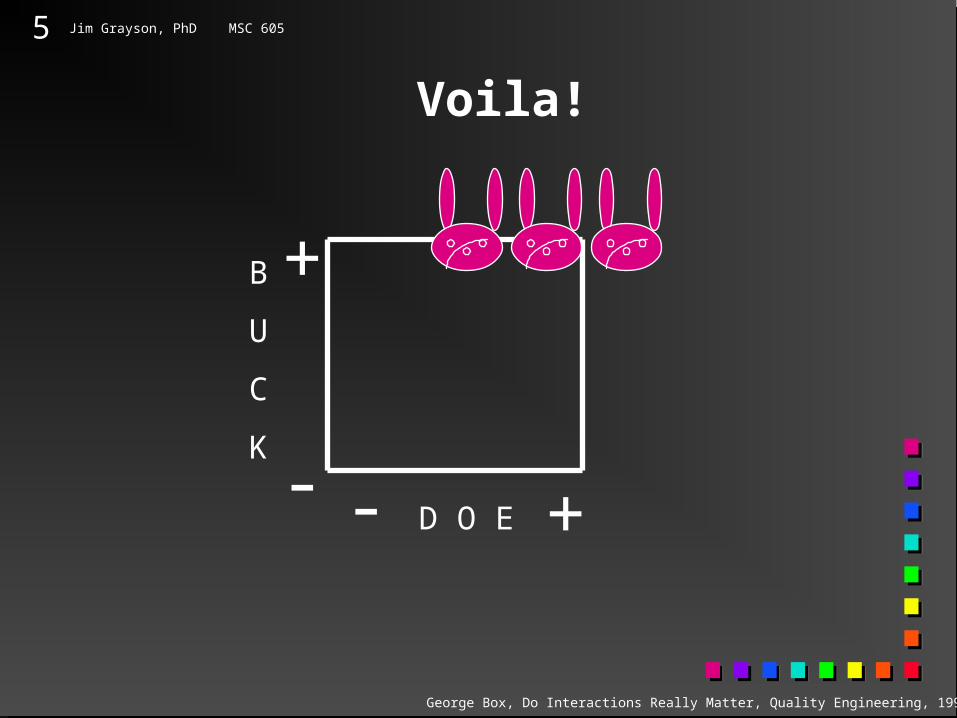
InteractionsInteractionsVarying factors together vs. one at a time.
B
U
C
K
D O E- -
+
+
George Box, Do Interactions Really Matter, Quality Engineering, 1990.
5 Jim Grayson, PhD MSC 605
B
U
C
K
D O E- -
+
+
Voila!
George Box, Do Interactions Really Matter, Quality Engineering, 1990.

6 Jim Grayson, PhD MSC 605
• Experiment run at SKF -- largest producer of rolling bearing in the world.
• Looked at three factors: heat treatment, outer ring osculation and cage design.
• Results:
•choice of cage design did not matter (contrary to previously accepted folklore -- considerable savings)
•life of bearing increased five fold if osculation and heat treatment are increased together -- saved millions of dollars !
George Box, Do Interactions Really Matter, Quality Engineering, 1990.

7 Jim Grayson, PhD MSC 605
• Bearings like this have been made for decades. Why did it take so long to discover this improvement ? One factor vs. interaction effects !
Osculation
Cage
Heat
12816
19 21
26 85
17 25
George Box, Do Interactions Really Matter, Quality Engineering, 1990.

8 Jim Grayson, PhD MSC 605
10621
18 23
Osculation
Heat
The Power of Interactions !
George Box, Do Interactions Really Matter, Quality Engineering, 1990.
9 Jim Grayson, PhD MSC 605
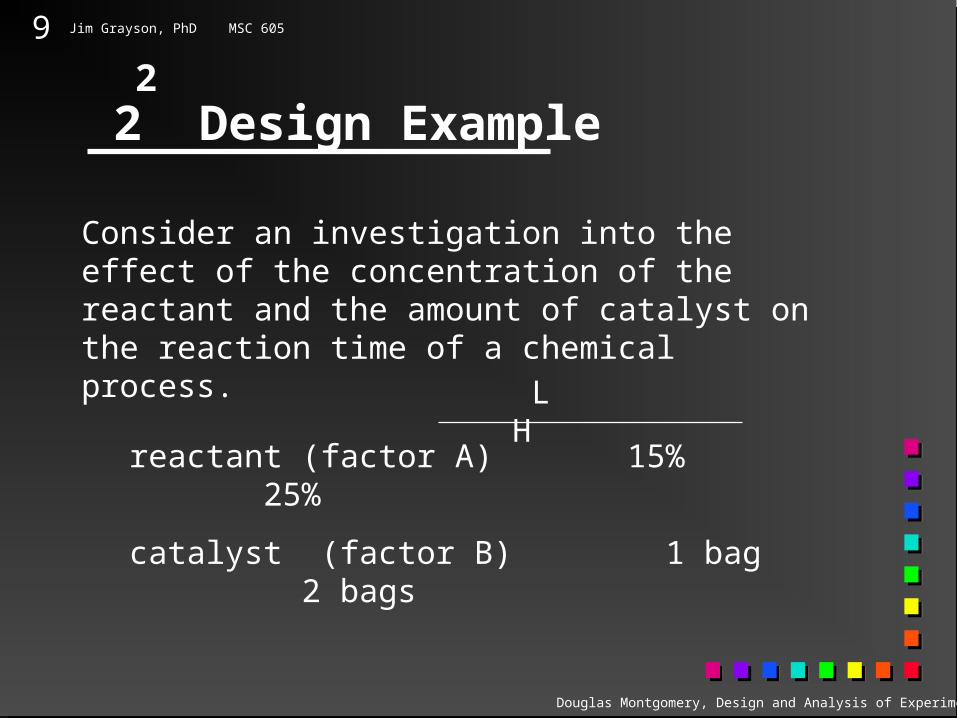
2 Design Example2
Consider an investigation into the effect of the concentration of the reactant and the amount of catalyst on the reaction time of a chemical process.
L H
reactant (factor A) 15% 25%
catalyst (factor B) 1 bag 2 bags
Douglas Montgomery, Design and Analysis of Experiments
10 Jim Grayson, PhD MSC 605
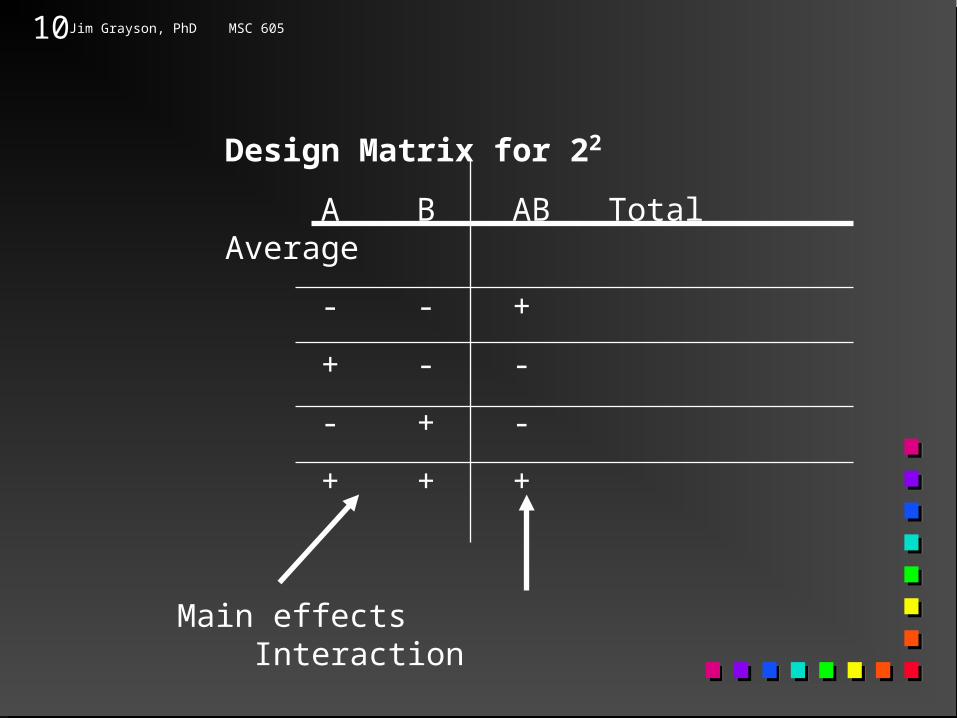
Design Matrix for 22
A B AB Total Average
- - +
+ - -
- + -
+ + +
Main effects Interaction
11 Jim Grayson, PhD MSC 605
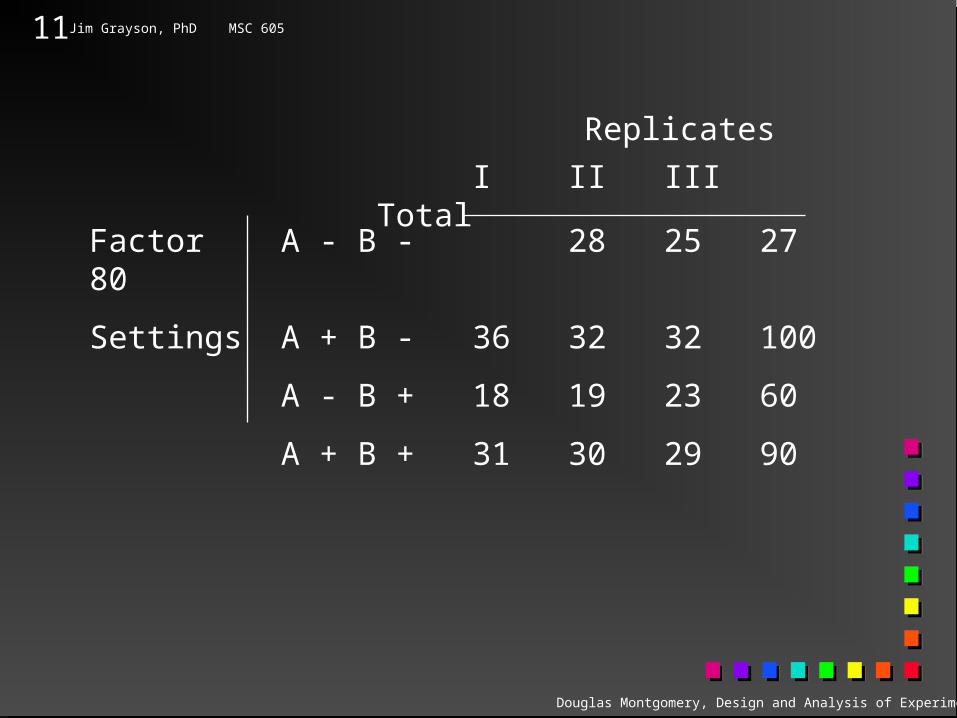
Factor A - B - 28 25 27 80
Settings A + B - 36 32 32 100
A - B + 18 19 23 60
A + B + 31 30 29 90
I II III Total
Replicates
Douglas Montgomery, Design and Analysis of Experiments

12 Jim Grayson, PhD MSC 605
An effect is the difference in the average response at one level of the factor versus the other level of the factor.
- +
A
60 90
80 100
A effect =
( [90 + 100] - [60 + 80] )
/ 2(3) = 8.33
Douglas Montgomery, Design and Analysis of Experiments
13 Jim Grayson, PhD MSC 605
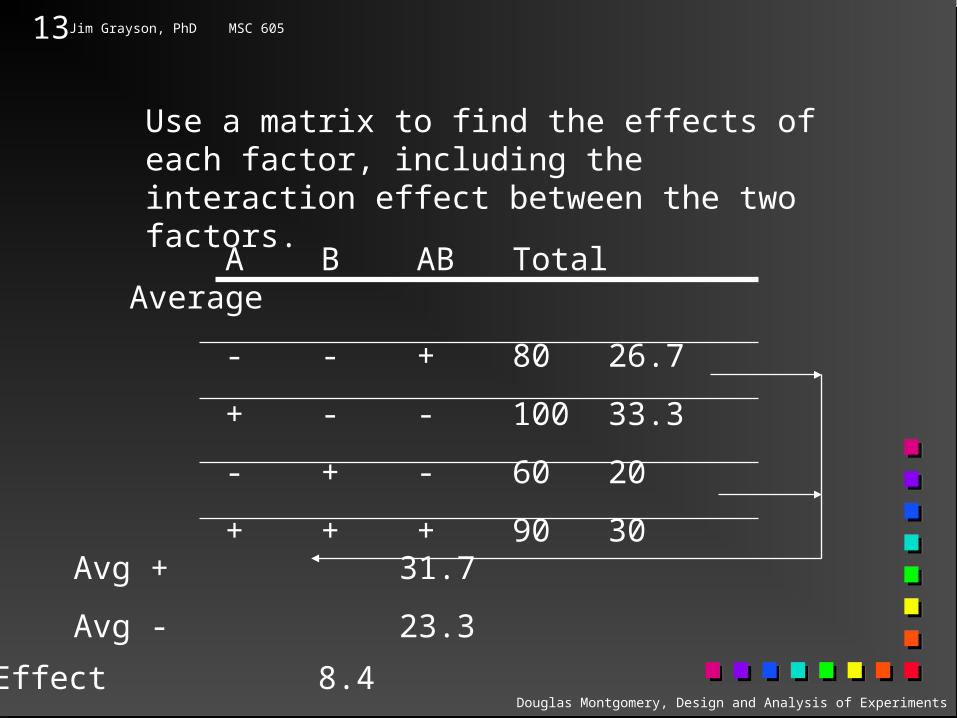
Use a matrix to find the effects of each factor, including the interaction effect between the two factors.
A B AB Total Average
- - + 80 26.7
+ - - 100 33.3
- + - 60 20
+ + + 90 30
Avg + 31.7
Avg - 23.3
Effect 8.4Douglas Montgomery, Design and Analysis of Experiments
14 Jim Grayson, PhD MSC 605
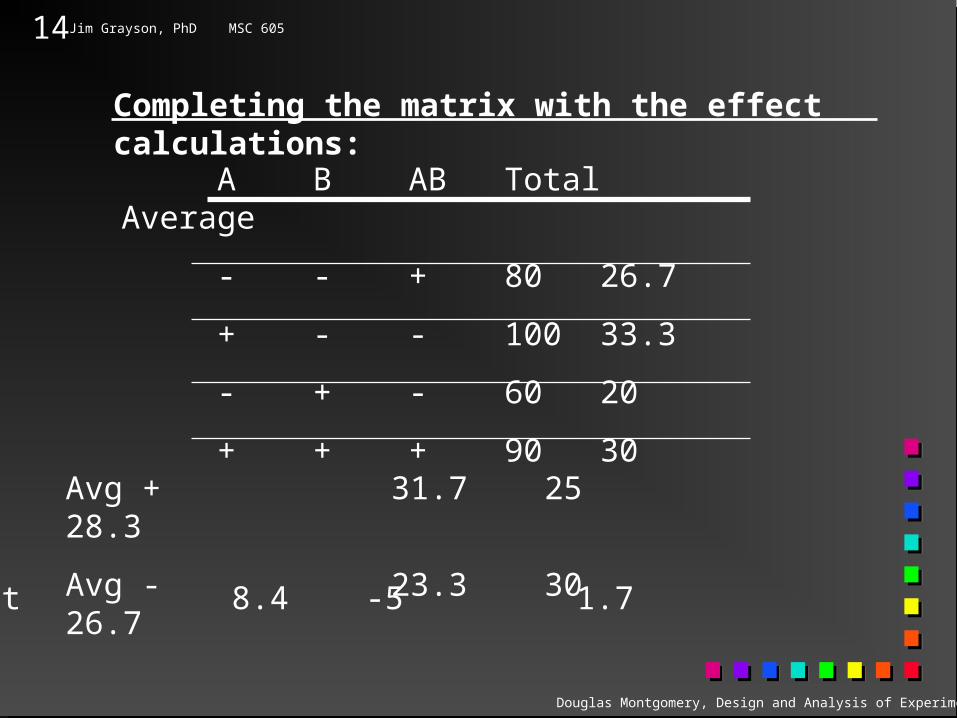
A B AB Total Average
- - + 80 26.7
+ - - 100 33.3
- + - 60 20
+ + + 90 30
Avg + 31.7 25 28.3
Avg - 23.3 30 26.7
Effect 8.4 -5 1.7
Completing the matrix with the effect calculations:
Douglas Montgomery, Design and Analysis of Experiments
15 Jim Grayson, PhD MSC 605
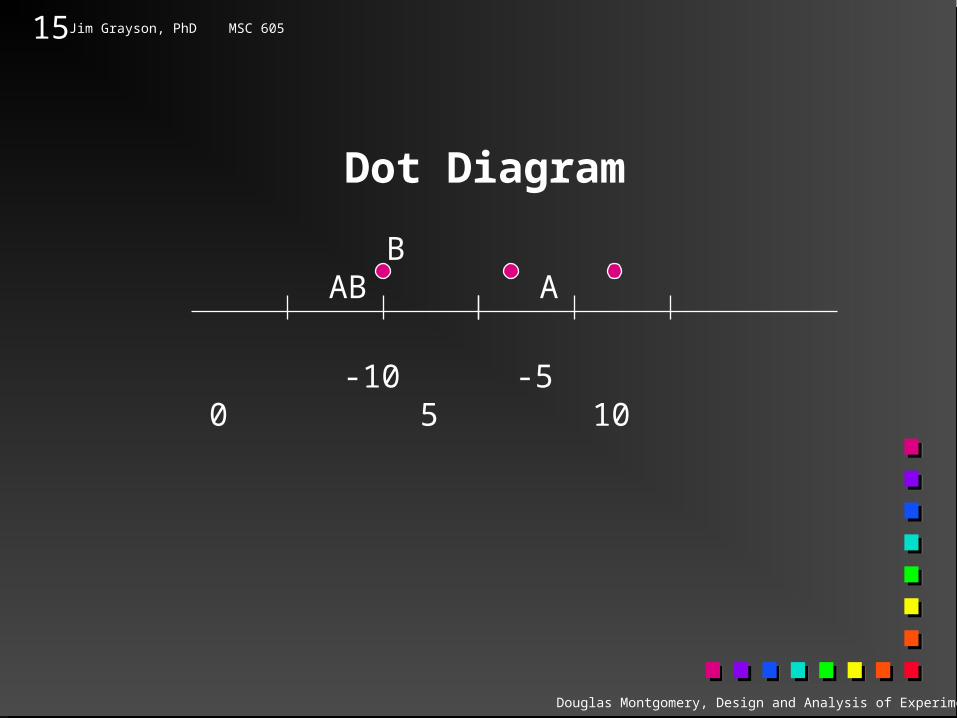
-10 -5 0 5 10
B AB A
Dot Diagram
Douglas Montgomery, Design and Analysis of Experiments

16 Jim Grayson, PhD MSC 605
35
30
25
20
- +
A
Response Plots
35
30
25
20
- +
B
Douglas Montgomery, Design and Analysis of Experiments
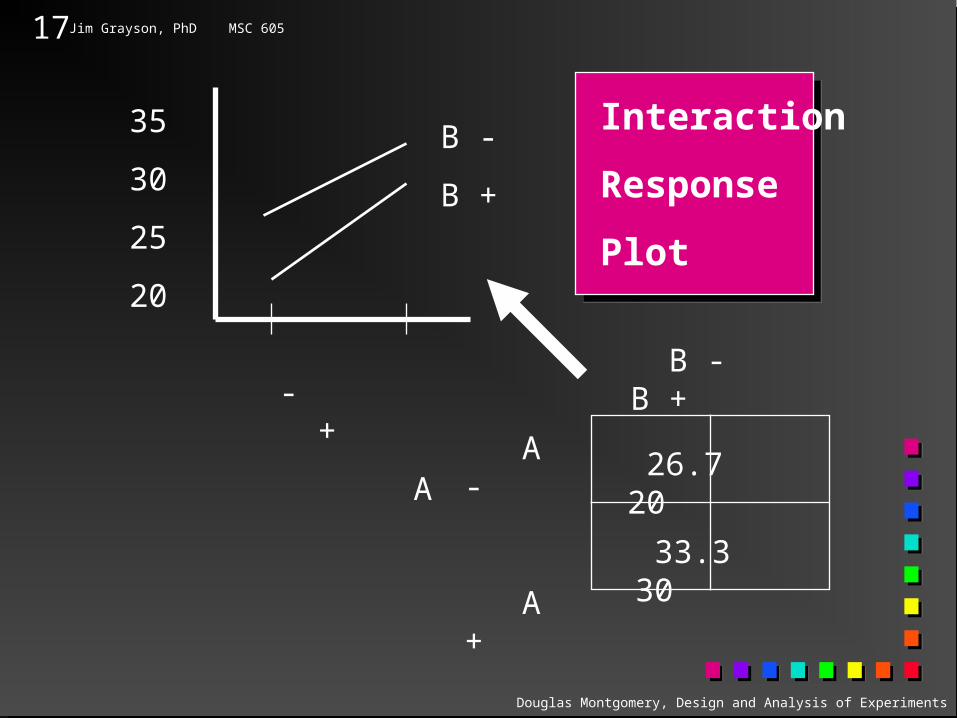
17 Jim Grayson, PhD MSC 605
35
30
25
20
- +
A
B -
B +
B - B +
A -
A +
26.7 20
33.3 30
Interaction
Response
Plot
Douglas Montgomery, Design and Analysis of Experiments
18 Jim Grayson, PhD MSC 605
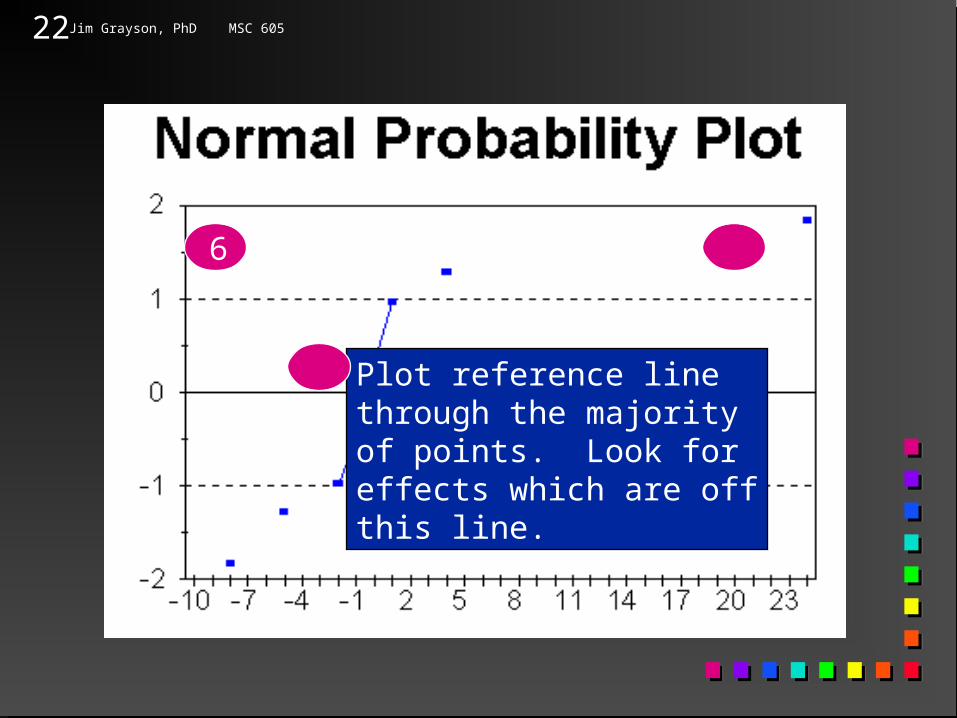
Normal Probability PlotsNormal Probability Plots Effects are the differences between Effects are the differences between
two averages.two averages. As we know, the distribution of As we know, the distribution of
averages are approximately normal.averages are approximately normal. NPP can be used to identify the effects NPP can be used to identify the effects
that are different from noise.that are different from noise.
Soren Bisgaard, A Practical Introduction to Experimental Design
19 Jim Grayson, PhD MSC 605
Construction of NPPConstruction of NPP Can be constructed with effects on Can be constructed with effects on
horizontal and cumulative percentages on horizontal and cumulative percentages on vertical -- but this requires normal vertical -- but this requires normal probability paper.probability paper.
Can also be constructed using the inverse Can also be constructed using the inverse standard normal of the plotting point ( (i - .5) standard normal of the plotting point ( (i - .5) / n )./ n ).
Look for effects that are different from Look for effects that are different from plotted ‘vertical’ reference line.plotted ‘vertical’ reference line.
Soren Bisgaard, A Practical Introduction to Experimental Design
20 Jim Grayson, PhD MSC 605
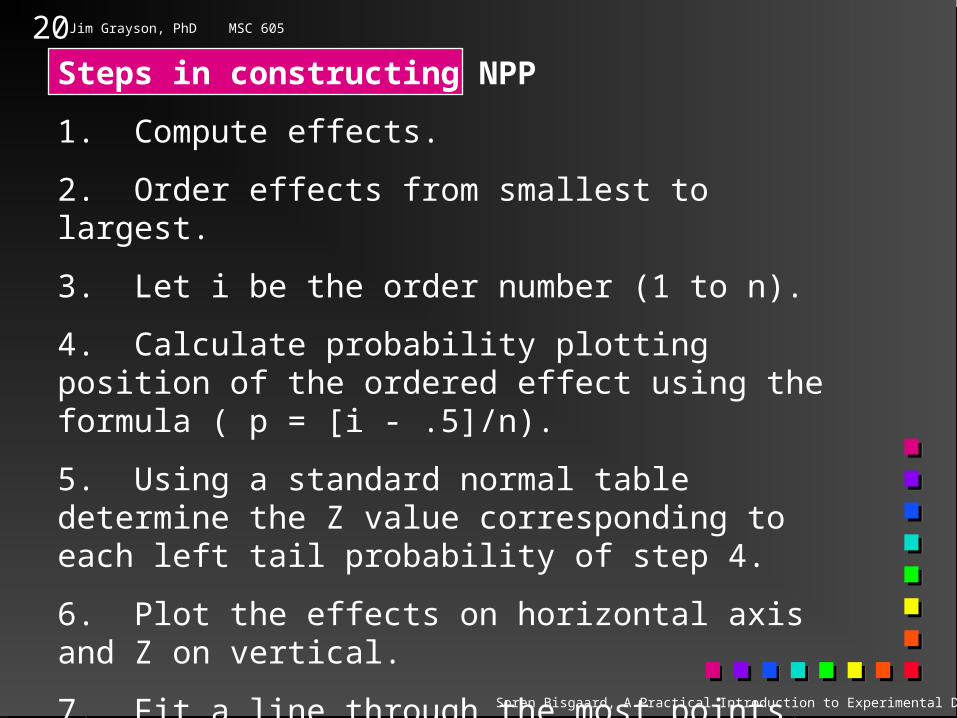
Steps in constructing NPP
1. Compute effects.
2. Order effects from smallest to largest.
3. Let i be the order number (1 to n).
4. Calculate probability plotting position of the ordered effect using the formula ( p = [i - .5]/n).
5. Using a standard normal table determine the Z value corresponding to each left tail probability of step 4.
6. Plot the effects on horizontal axis and Z on vertical.
7. Fit a line through the most points.
8. Those ‘off the line’ are significant effects.
Soren Bisgaard, A Practical Introduction to Experimental Design

21 Jim Grayson, PhD MSC 605
3 4 5 2
22 Jim Grayson, PhD MSC 605
Plot reference linethrough the majorityof points. Look for effects which are offthis line.
6
7
8
23 Jim Grayson, PhD MSC 605
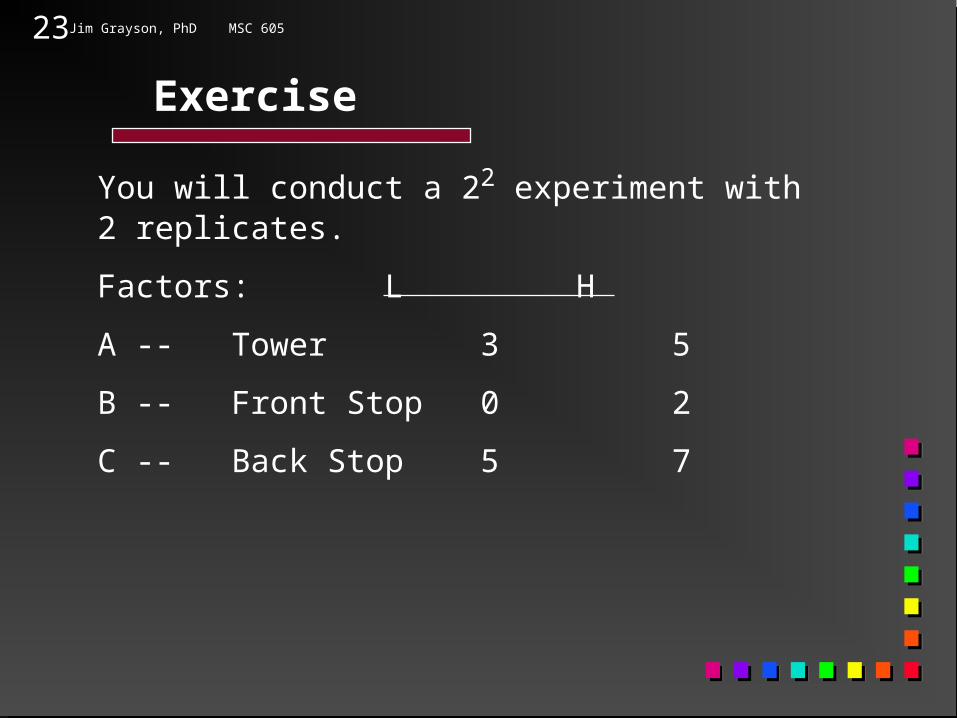
Exercise
You will conduct a 22 experiment with 2 replicates.
Factors: L H
A -- Tower 3 5
B -- Front Stop 0 2
C -- Back Stop 5 7

24 Jim Grayson, PhD MSC 605
Requirements:
1. Collect data -- total of 16 observations (random order).
2. Fill in matrix and compute effects.
3. Put averages on a cube plot.
4. Plot effects on dot plot and normal probability plot.
5. Create appropriate response plots for significant interactions and main effects.
6. Interpret results and make recommendations to management.

25 Jim Grayson, PhD MSC 605
Design Matrix
ABCABACBCABC
1---+++-2+----++3-+--+-+4++-+---5--++--+6+-+-+--7-++--+-8+++++++
Avg +Avg -
Effect
ABCABACBCABC
1---+++-2+----++3-+--+-+4++-+---5--++--+6+-+-+--7-++--+-8+++++++
Avg +Avg -
Effect
ABCABACBCABC
1---+++-2+----++3-+--+-+4++-+---5--++--+6+-+-+--7-++--+-8+++++++
Avg +Avg -
Effect
ABCABACBCABC
1---+++-2+----++3-+--+-+4++-+---5--++--+6+-+-+--7-++--+-8+++++++
Avg +Avg -
Effect
Replicates
A B C AB AC BC ABC I II Total Average
1 - - - + + + -2 + - - - - + +3 - + - - + - +4 + + - + - - -5 - - + + - - +6 + - + - + - -7 - + + - - + -8 + + + + + + +
Avg +Avg -
Effect
26 Jim Grayson, PhD MSC 605
Cube Plot

27 Jim Grayson, PhD MSC 605
Response Plots
- +
-
+

28 Jim Grayson, PhD MSC 605
i P Z1 0.07 -1.52 0.21 -0.83 0.36 -0.44 0.50 05 0.64 0.46 0.79 0.87 0.93 1.5
Z
Effect
Normal
Probability
Plot
29 Jim Grayson, PhD MSC 605
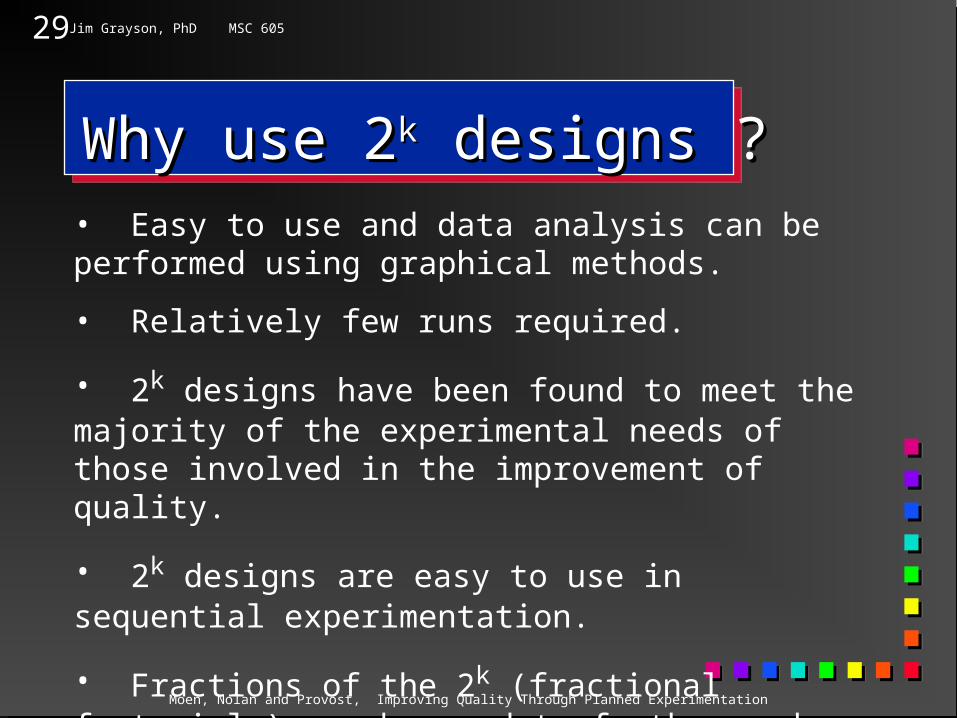
Why use 2Why use 2kk designs ? designs ?• Easy to use and data analysis can be performed using graphical methods.
• Relatively few runs required.
• 2k designs have been found to meet the majority of the experimental needs of those involved in the improvement of quality.
• 2k designs are easy to use in sequential experimentation.
• Fractions of the 2k (fractional factorials) can be used to further reduce the experiment size.Moen, Nolan and Provost, Improving Quality Through Planned Experimentation