Embed Size (px)
Citation preview
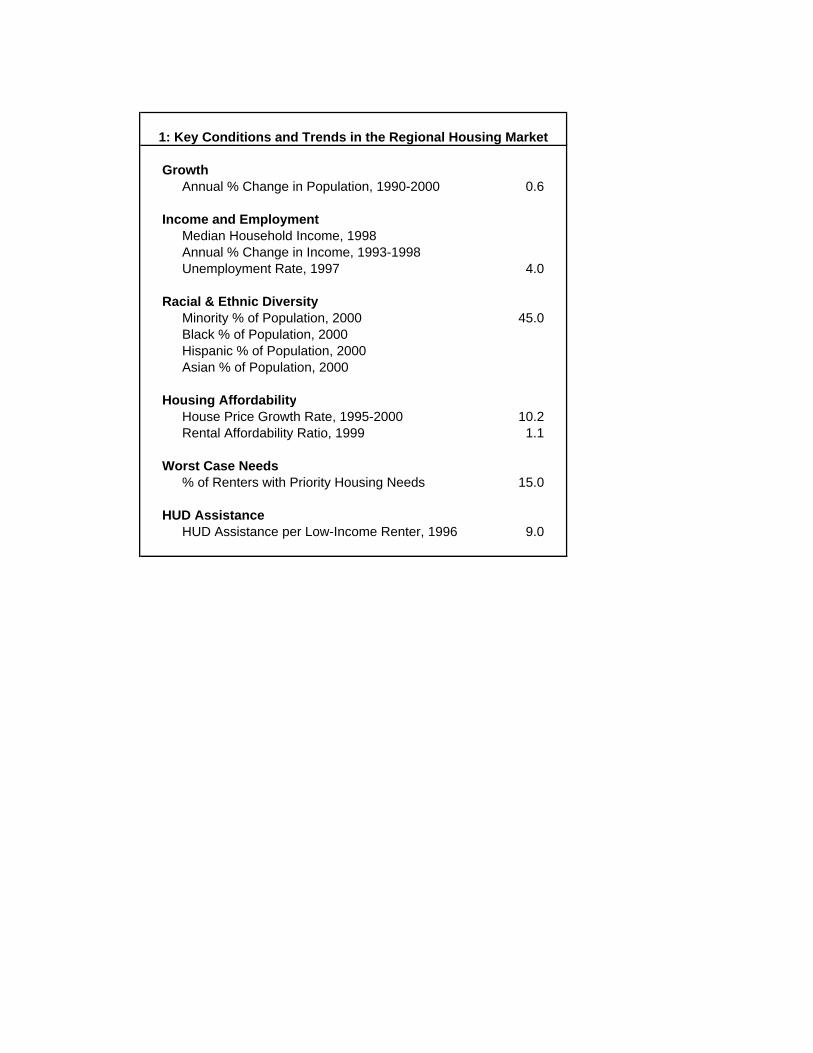
1: Key Conditions and Trends in the Regional Housing Market
Growth Annual % Change in Population, 1990-2000 0.6
Income and Employment Median Household Income, 1998 Annual % Change in Income, 1993-1998 Unemployment Rate, 1997 4.0
Racial & Ethnic Diversity Minority % of Population, 2000 45.0 Black % of Population, 2000 Hispanic % of Population, 2000 Asian % of Population, 2000
Housing Affordability House Price Growth Rate, 1995-2000 10.2 Rental Affordability Ratio, 1999 1.1
Worst Case Needs % of Renters with Priority Housing Needs 15.0
HUD Assistance HUD Assistance per Low-Income Renter, 1996 9.0

San Francisco Marin County San Mateo County
1993 Annual % Change 1993-98
1993 Annual % Change 1993-98
1993 Annual % Change 1993-98
Very Low Income 75909 11531 32584 Excess Cost Burden 20132 -1.64% 1081 23.99% 5836 1.84% Severe Cost Burden 33719 6.68% 7891 4.89% 19163 8.90% Moderately Deficient 6979 -3.70% 0 -- 1436 11.56% Severely Deficient 6674 9.67% 1123 3.87% 1854 6.11% Overcrowded 9648 3.95% 355 -1.57% 714 -0.20% One or More Problems 59486 4.03% 9375 7.62% 25373 7.32%
Low Income 51266 12367 31002 Excess Cost Burden 22085 -11.15% 4244 -2.36% 12368 -3.74% Severe Cost Burden 7848 1.32% 2879 -5.19% 6619 -2.99% Moderately Deficient 3907 -0.06% 358 -14.25% 1877 -1.54% Severely Deficient 2480 4.02% 0 #DIV/0! 1774 8.54% Overcrowded 2841 -1.94% 838 -27.66% 0 #DIV/0! One or More Problems 33420 -5.91% 7544 -4.56% 20106 -3.14%
Moderate Income 62414 17563 38674 Excess Cost Burden 16929 -12.69% 6432 -7.81% 12332 -1.49% Severe Cost Burden 3187 -6.03% 2035 -10.37% 2456 10.09% Moderately Deficient 3247 -14.24% 781 -100.00% 2246 -6.85% Severely Deficient 5678 -7.09% 418 20.14% 769 12.52% Overcrowded 1122 -1.43% 0 #DIV/0! 400 16.89% One or More Problems 27748 -10.55% 9666 -9.21% 17420 0.46%
2: Housing Problems by Income Category
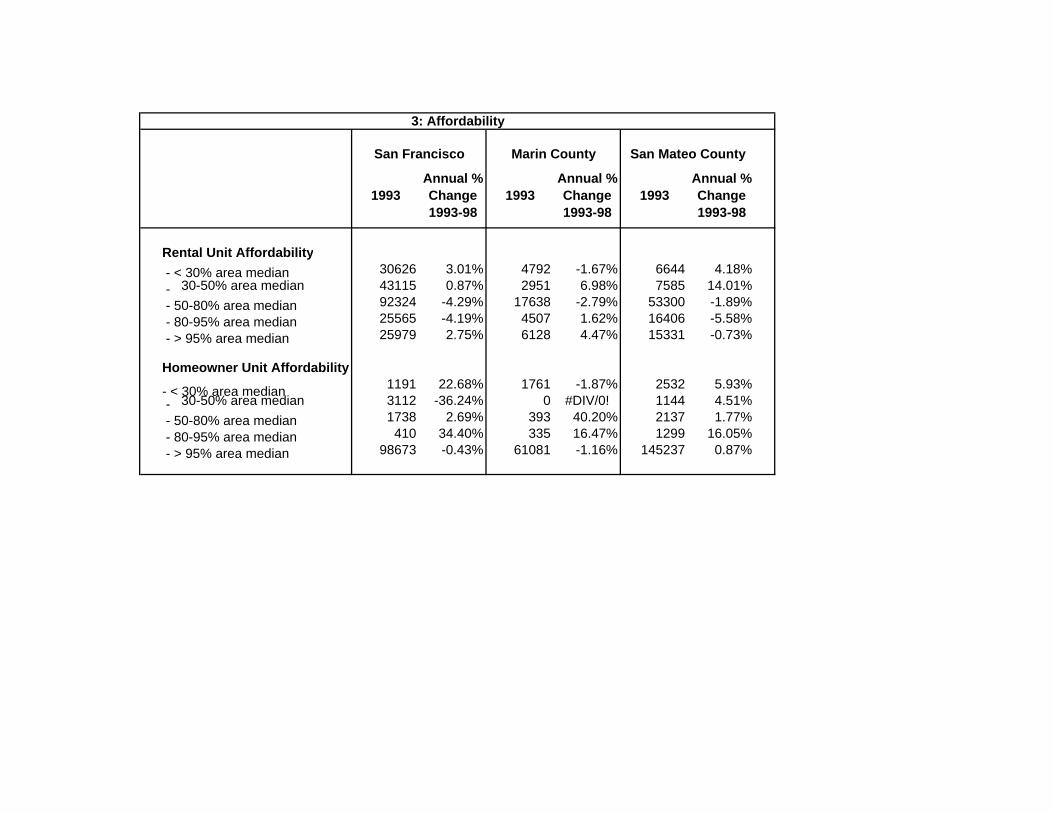
3: Affordability
San Francisco
1993 Annual % Change 1993-98
Marin County
1993 Annual % Change 1993-98
San Mateo County
1993 Annual % Change 1993-98
Rental Unit Affordability - < 30% area median 30626 3.01% 4792 -1.67% 6644 4.18% - 30-50% area median 43115 0.87% 2951 6.98% 7585 14.01% - 50-80% area median 92324 -4.29% 17638 -2.79% 53300 -1.89% - 80-95% area median 25565 -4.19% 4507 1.62% 16406 -5.58% - > 95% area median
Homeowner Unit Affordability
25979 2.75% 6128 4.47% 15331 -0.73%
- < 30% area median 1191 22.68% 1761 -1.87% 2532 5.93% - 30-50% area median 3112 -36.24% 0 #DIV/0! 1144 4.51% - 50-80% area median 1738 2.69% 393 40.20% 2137 1.77% - 80-95% area median 410 34.40% 335 16.47% 1299 16.05% - > 95% area median 98673 -0.43% 61081 -1.16% 145237 0.87%
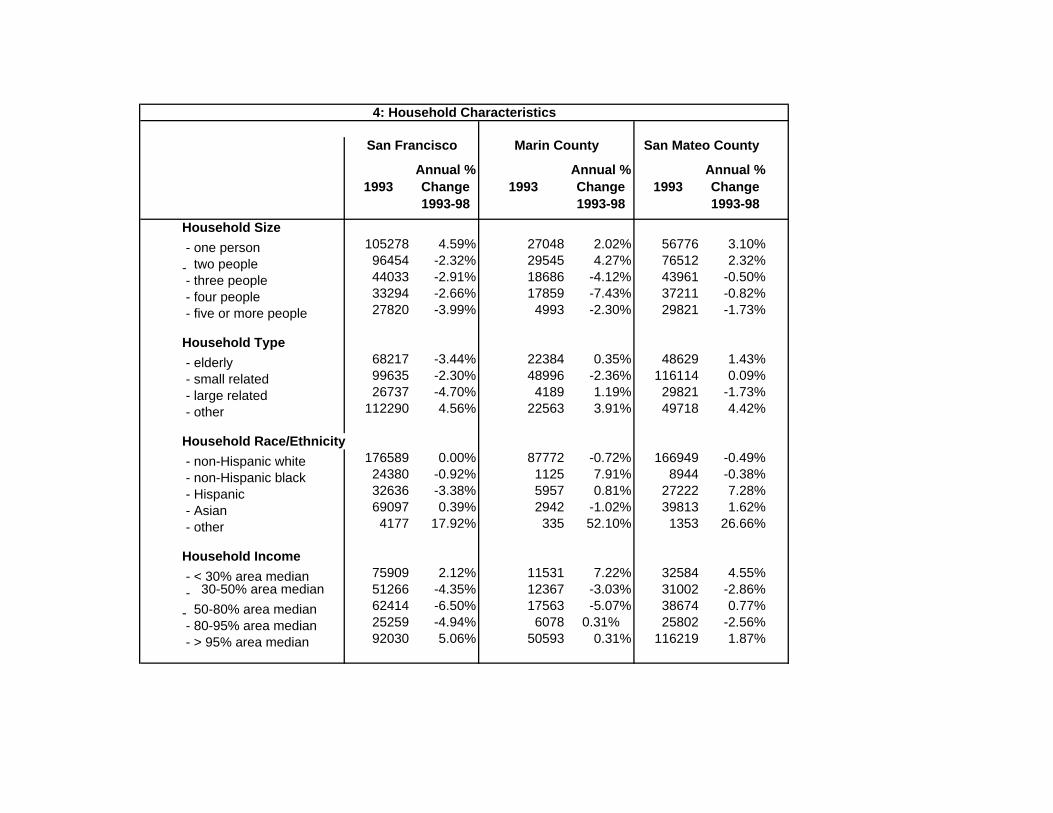
4: Household Characteristics
Household Size - one person - two people - three people - four people - five or more people
Household Type - elderly - small related - large related - other
Household Race/Ethnicity - non-Hispanic white - non-Hispanic black - Hispanic - Asian - other
Household Income - < 30% area median - 30-50% area median
- 50-80% area median - 80-95% area median - > 95% area median
San Francisco
Annual % 1993 Change
1993-98
105278 4.59% 96454 -2.32% 44033 -2.91% 33294 -2.66% 27820 -3.99%
68217 -3.44% 99635 -2.30% 26737 -4.70%
112290 4.56%
176589 0.00% 24380 -0.92% 32636 -3.38% 69097 0.39% 4177 17.92%
75909 2.12% 51266 -4.35% 62414 -6.50% 25259 -4.94% 92030 5.06%
Marin County
Annual % 1993 Change
1993-98
27048 2.02% 29545 4.27% 18686 -4.12% 17859 -7.43% 4993 -2.30%
22384 0.35% 48996 -2.36% 4189 1.19%
22563 3.91%
87772 -0.72% 1125 7.91% 5957 0.81% 2942 -1.02% 335 52.10%
11531 7.22% 12367 -3.03% 17563 -5.07% 6078 0.31%
50593 0.31%
San Mateo County
Annual % 1993 Change
1993-98
56776 3.10%76512 2.32%43961 -0.50%37211 -0.82%29821 -1.73%
48629 1.43%116114 0.09%29821 -1.73%49718 4.42%
166949 -0.49%8944 -0.38%
27222 7.28%39813 1.62%1353 26.66%
32584 4.55%31002 -2.86%38674 0.77%25802 -2.56%
116219 1.87%

5: San Francisco Local Assessment for the 1990s
Housing Market
� San Francisco is the second most dense large city after New York with 332, 638 housing units of which 65.5% are renter-occupied and 34.5% are owner occupied. By 1960 SF's fixed land supply had been completely developed while the city has continued to grow and add to its housing stock.
� The location and risk of earthquakes and age of the housing stock combine to create a high need for rehabilitation. The housing stock was depleted by the 1989 earthquake which immediately eliminated almost 15,000 units. It is estimated that due to earthquake damage 28% of the housing stock has rehabilitation needs. This housing stock problems tend to concentrate in low income households.
� While housing demand rose in the early 1990s housing production was dramatically less than at the same time in the 1980s.
� Data from the 1990 census showed over 99,000 low to moderate income households had inadequate units based on cost-burden, size or habitability and 35,000 very low and low income renters were severely overpaying — paying more than 50% of their income in rent.
� Affordability is one of the main issues facing San Francisco particularly for low income persons. For the poor receiving various forms of government assistance there is an affordability gap of over 250%. In addition, homeownership is prohibitively expensive thus forcing potential homeowners into the rental market. It is estimated that only 9% of San Francisco households can afford the price of a single family home.
Demographics
� During the 1980s the city's population grew larger, older, and more diverse. Increases in immigration of Asian/Pacific Islanders (API) and Hispanics are partially responsible for this growth as well as the growth of families with children under 18. The pop of San Francisco increased from 678,974 in 1980 to 723,959 in 1990, an increase of 6.6%. The city estimated that the population would grow faster in the 1990s than it did in the 1980s yielding a population growth of 43,000 from 1990-95. Based on figures from the Housing Element the city estimated that 25,000 new immigrant households would arrive in San Francisco between 1995 and 2000.
� The fastest growing household type in the 1980s was single unrelated households reflecting unmarried couples and people sharing rent. These households increased by 29.4% and by 1994 made up 14% of all households.
� San Francisco continues to have a relatively high elderly pop — 19% as opposed to area average of 14%. Fifteen percent of the elderly pop are considered frail elderly. A1993 mayor's task force report stated that housing affordability was the singe greatest need for this pop.
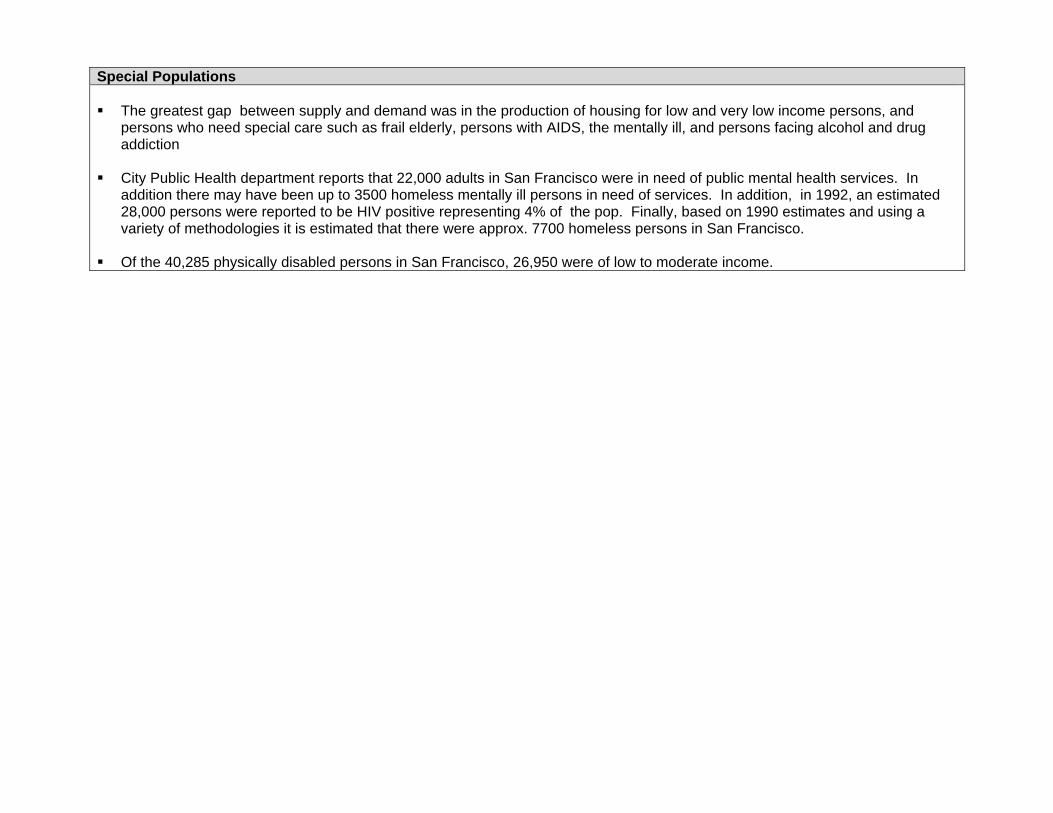
Special Populations
� The greatest gap between supply and demand was in the production of housing for low and very low income persons, and persons who need special care such as frail elderly, persons with AIDS, the mentally ill, and persons facing alcohol and drug addiction
� City Public Health department reports that 22,000 adults in San Francisco were in need of public mental health services. In addition there may have been up to 3500 homeless mentally ill persons in need of services. In addition, in 1992, an estimated 28,000 persons were reported to be HIV positive representing 4% of the pop. Finally, based on 1990 estimates and using a variety of methodologies it is estimated that there were approx. 7700 homeless persons in San Francisco.
� Of the 40,285 physically disabled persons in San Francisco, 26,950 were of low to moderate income.

6: San Francisco Local Priorities and Strategies
SAN FRANCISCO
PRIORITIES STRATEGIES ACTIVITIES FIVE YEAR TARGET Lowest and Extremely Low Income households who are homeless or at imminent risk of being
� Expand the supply of permanent housing for extremely low income population creating more exits from the cycle of homelessness.
� Provide services
� Acquire, convert, and rehabilitate facilities to provide additional shelter space, service- enriched transitional housing, and housing for special needs populations including; substance abusers, medically needy, and victims of domestic violence.
� Acquire and rehabilitate apartment
Transitional Beds for Homeless Persons
5100
homeless. addressing barriers to successful independent living.
� Increase income opportunities for extremely low income persons.
� Provide emergency assistance and homeless prevention services.
buildings and residential hotels to create permanent affordable housing with on/off site vocational support services, and services for the elderly and persons affected by AIDS, psychiatric or physical disabilities, and addiction.
� Obtain Section 8 project based subsidies, increase availability of Section 8 Vouchers.
� Increase emergency eviction and rental assistance.
Newly constructed or acquired and restricted units for Extremely Low individuals and families
5310
Very Low and Other Low Income households that include persons with disabling physical and /or psychological characteristics or other conditions that result in a need for special housing.
� Increase the supply of permanently affordable housing with associated services for persons with special needs.
� Preserve the affordability and improve the physical condition of existing housing for persons with special needs.
� Provide residentially based social, health, vocation and/or tenant services for low and very low income persons.
� Acquire and rehabilitate apartment buildings to expand permanent service-enriched housing for mentally and developmentally disabled persons and persons with AIDS.
� Construct new permanently affordable service-enriched rental housing for very low income senior and disabled persons.
� Provide barrier-free housing including special physical design requirements in all publicly supported housing development.
New permanent supportive housing for low and very low income persons:
Beds for special needs population including mentally/physically disabled, frail elderly, PWAs, addictions
Units for developmentally disabled and non-frail elderly
20,840 (beds)
3100
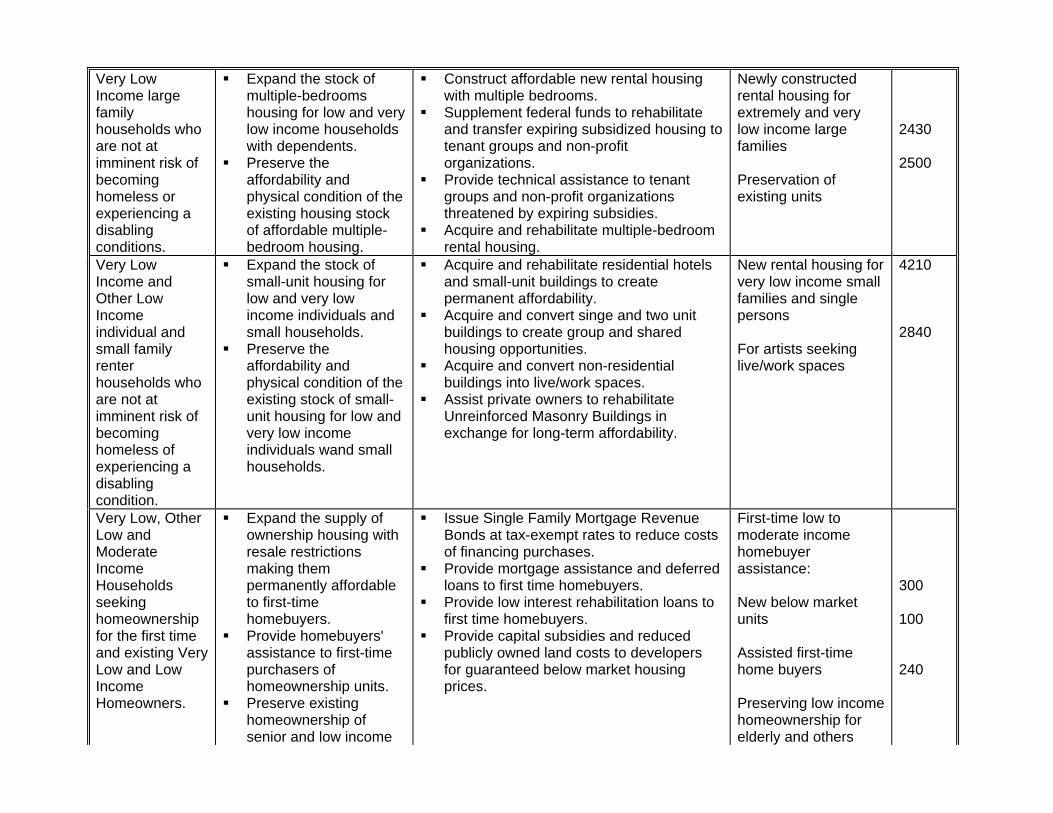
Very Low Income large family
� Expand the stock of multiple-bedrooms housing for low and very
� Construct affordable new rental housing with multiple bedrooms.
� Supplement federal funds to rehabilitate
Newly constructed rental housing for extremely and very
households who are not at
low income households with dependents.
and transfer expiring subsidized housing to tenant groups and non-profit
low income large families
2430
imminent risk of becoming homeless or experiencing a disabling conditions.
� Preserve the affordability and physical condition of the existing housing stock of affordable multiple-bedroom housing.
organizations. � Provide technical assistance to tenant
groups and non-profit organizations threatened by expiring subsidies.
� Acquire and rehabilitate multiple-bedroom rental housing.
Preservation of existing units
2500
Very Low Income and Other Low Income
� Expand the stock of small-unit housing for low and very low income individuals and
� Acquire and rehabilitate residential hotels and small-unit buildings to create permanent affordability.
� Acquire and convert singe and two unit
New rental housing for very low income small families and single persons
4210
individual and small family renter households who are not at imminent risk of becoming homeless of experiencing a disabling condition.
small households. � Preserve the
affordability and physical condition of the existing stock of small-unit housing for low and very low income individuals wand small households.
buildings to create group and shared housing opportunities.
� Acquire and convert non-residential buildings into live/work spaces.
� Assist private owners to rehabilitate Unreinforced Masonry Buildings in exchange for long-term affordability.
For artists seeking live/work spaces
2840
Very Low, Other Low and Moderate Income
� Expand the supply of ownership housing with resale restrictions making them
� Issue Single Family Mortgage Revenue Bonds at tax-exempt rates to reduce costs of financing purchases.
� Provide mortgage assistance and deferred
First-time low to moderate income homebuyer assistance:
Households seeking
permanently affordable to first-time
loans to first time homebuyers. � Provide low interest rehabilitation loans to New below market
300
homeownership for the first time and existing Very
homebuyers. � Provide homebuyers'
assistance to first-time
first time homebuyers. � Provide capital subsidies and reduced
publicly owned land costs to developers
units
Assisted first-time
100
Low and Low Income Homeowners.
purchasers of homeownership units.
� Preserve existing homeownership of senior and low income
for guaranteed below market housing prices.
home buyers
Preserving low income homeownership for elderly and others
240

family homeowners.
Non-Housing Community Development Priorities Improving Neighborhood Environment
� Continue to carry out activities to improve the public environment and facilities used for community services and activities
� Improve public service programs to help support physical development activities.
� Rehabilitation of existing neighborhood facilities where public services are provided and funding new facilities where need are not met by existing facilities.
� Continue use of Facility Emergency Relief Fund Grant Program to provide matching funds assist neighborhood centers to correct serious code violation problems.
� Reduce risk of lead poisoning among children through renovation and abatement.
� Increase access to programs and facilities for persons with disabilities through renovation of building where services are provided.
Increasing Economic Development
� Implement programs that expand small or minority-owned businesses, encourage self-sufficiency of community-based nonprofit organizations, assist with the development of self employment efforts, improve use of commercial-use land, and revitalize declining neighborhood commercial districts.
� Combine separate loan programs into one comprehensive economic development loan fund to assist small businesses, new entrepreneurs, and non-profit organizations undertaking business ventures.
� Continue to provide loans for facade improvement in EZ areas. � Non-profit Corporation Business Ventures- assisting non-profit organizations
in job creation activities. � Self Employment & Enterprise Development assisting low income persons
seeking self-employment opportunities.

5: Daly City Local Assessment for the 1990s
Housing Market
� Daly City is a very dense and built out suburban community of 98, 316. It consist mostly of single family homes on small lots. Most of the city’s rental units are concentrated in one development.
� Most of the housing stock originated between 1955 and 1978 and by the 1990s was beginning to need some rehabilitation.
� Housing cost in Daly City are extremely high compared to the national average. There was a total of 11,979 renter households and 17,169 owner households in 1990. Of the renter households, 1,215 were elderly households.
� Overcrowding is a serious issue in Daly City which has very ethnically diverse population. Because Daly City remains a first home for many immigrant families, there are many multi-generational households as well as newly formed households. Because of this diversity, no age group or family type predominates.
� During the 1970s and 1980s, Daly City experienced change in ethnic composition as immigrants from Mexico, China, and the Philippines began settling in the community in increasing numbers.
� This increase in population resulted in a rapid development of extra units in existing homes. This consisted mostly of garages and unfinished basements being turned into living spaces as rental units or for additional family members. Unfortunately many of these units were not completed under a permit and many are thus sub-standard. It was estimated in 1992 that there were between 5000-10000 of these units in Daly City. It was also estimated that in 1990 19.1% of all households in Daly City were overcrowded and increase of 9% since 1980.
� As a result of these trends, overcrowding, substandard units, and the construction of illegal second units became substantial problems in the 1990s. It was anticipated that these problems would persist and worsen throughout the decade.
� In the early 1990s the Bay Area experienced a “contained depression” which had effects on Daly City not the least of which was an increase in the unemployment rate from 5.4% in January 1991 to 7.0% in 1993. As a result many social service providers such as food pantries and community social service centers had to turn away families seeking assistance. By the mid-1990s, the economic picture improved. Business returned and the unemployment rate began to drop. In many neighborhoods business vacancy rates improved while in some hard hit neighborhoods, there was little recovery.
Demographics
� Daly City is ethnically diverse with no homogeneous or nearly homogeneous concentrations of minorities in any one neighborhoods.
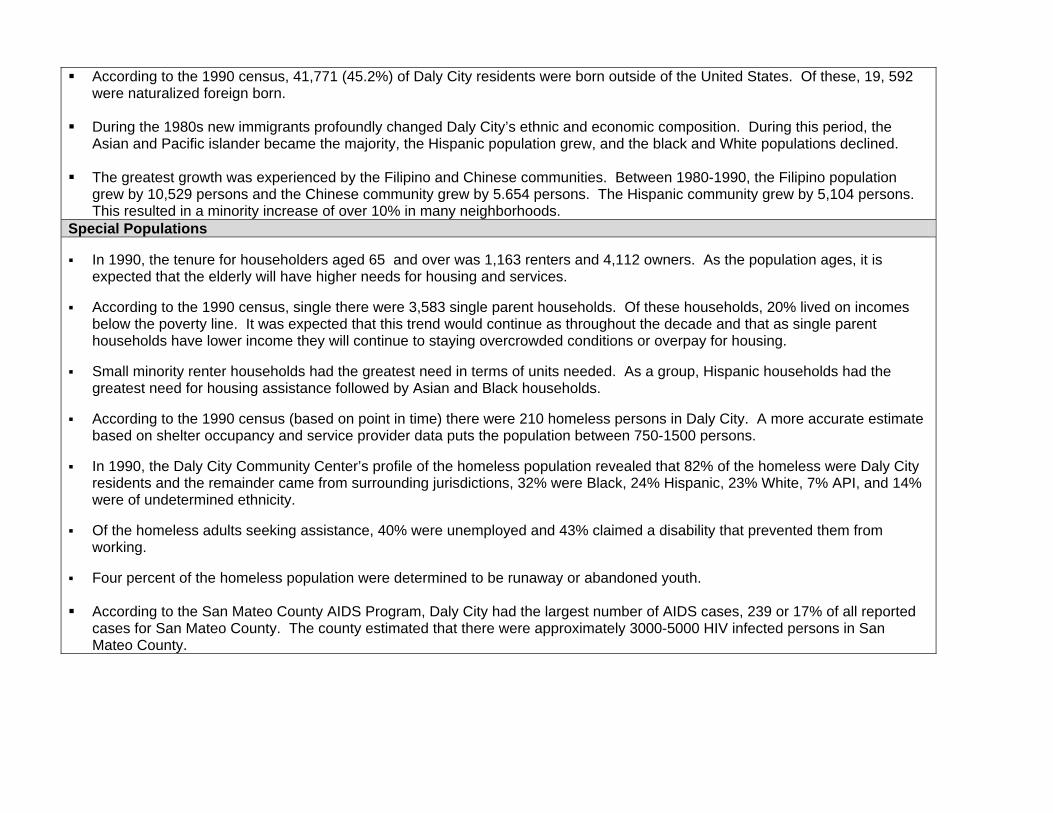
� According to the 1990 census, 41,771 (45.2%) of Daly City residents were born outside of the United States. Of these, 19, 592 were naturalized foreign born.
� During the 1980s new immigrants profoundly changed Daly City’s ethnic and economic composition. During this period, the Asian and Pacific islander became the majority, the Hispanic population grew, and the black and White populations declined.
� The greatest growth was experienced by the Filipino and Chinese communities. Between 1980-1990, the Filipino population grew by 10,529 persons and the Chinese community grew by 5.654 persons. The Hispanic community grew by 5,104 persons. This resulted in a minority increase of over 10% in many neighborhoods.
Special Populations
� In 1990, the tenure for householders aged 65 and over was 1,163 renters and 4,112 owners. As the population ages, it is expected that the elderly will have higher needs for housing and services.
� According to the 1990 census, single there were 3,583 single parent households. Of these households, 20% lived on incomes below the poverty line. It was expected that this trend would continue as throughout the decade and that as single parent households have lower income they will continue to staying overcrowded conditions or overpay for housing.
� Small minority renter households had the greatest need in terms of units needed. As a group, Hispanic households had the greatest need for housing assistance followed by Asian and Black households.
� According to the 1990 census (based on point in time) there were 210 homeless persons in Daly City. A more accurate estimate based on shelter occupancy and service provider data puts the population between 750-1500 persons.
� In 1990, the Daly City Community Center’s profile of the homeless population revealed that 82% of the homeless were Daly City residents and the remainder came from surrounding jurisdictions, 32% were Black, 24% Hispanic, 23% White, 7% API, and 14% were of undetermined ethnicity.
� Of the homeless adults seeking assistance, 40% were unemployed and 43% claimed a disability that prevented them from working.
� Four percent of the homeless population were determined to be runaway or abandoned youth.
� According to the San Mateo County AIDS Program, Daly City had the largest number of AIDS cases, 239 or 17% of all reported cases for San Mateo County. The county estimated that there were approximately 3000-5000 HIV infected persons in San Mateo County.
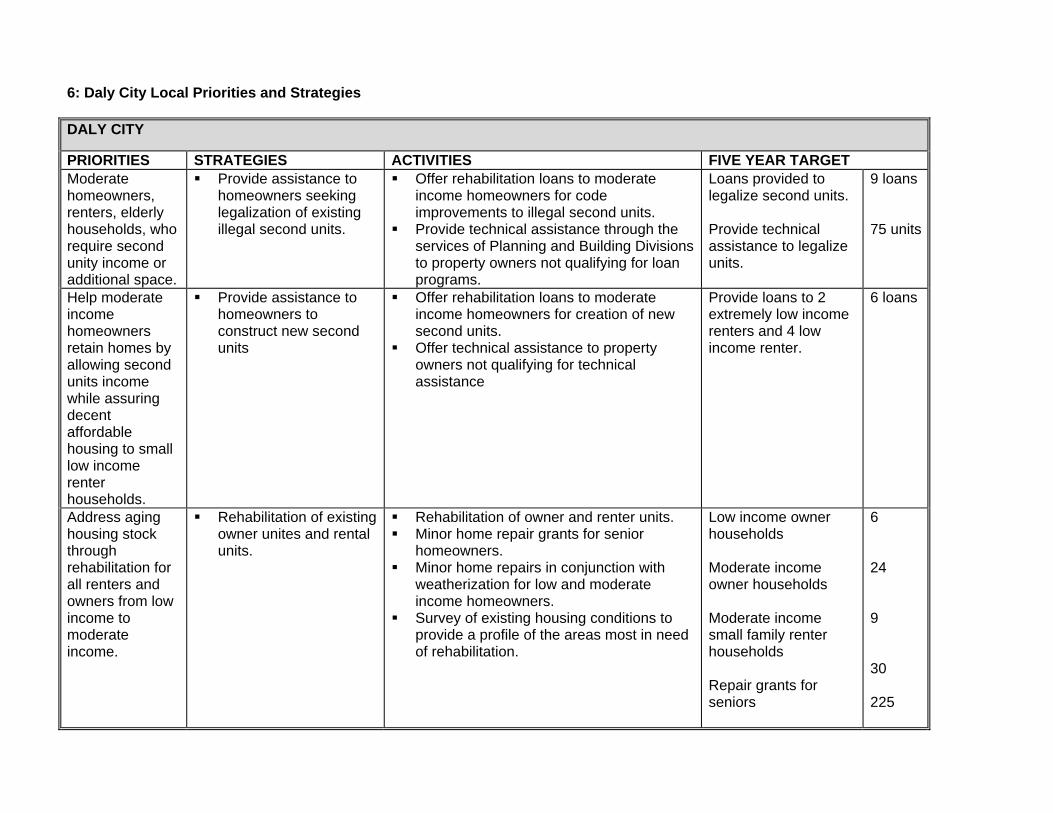
6: Daly City Local Priorities and Strategies
DALY CITY
PRIORITIES STRATEGIES ACTIVITIES FIVE YEAR TARGET Moderate homeowners, renters, elderly
� Provide assistance to homeowners seeking legalization of existing
� Offer rehabilitation loans to moderate income homeowners for code improvements to illegal second units.
Loans provided to legalize second units.
9 loans
households, who require second unity income or additional space.
illegal second units. � Provide technical assistance through the services of Planning and Building Divisions to property owners not qualifying for loan programs.
Provide technical assistance to legalize units.
75 units
Help moderate income homeowners retain homes by allowing second units income while assuring decent affordable housing to small low income renter households.
� Provide assistance to homeowners to construct new second units
� Offer rehabilitation loans to moderate income homeowners for creation of new second units.
� Offer technical assistance to property owners not qualifying for technical assistance
Provide loans to 2 extremely low income renters and 4 low income renter.
6 loans
Address aging housing stock through
� Rehabilitation of existing owner unites and rental units.
� Rehabilitation of owner and renter units. � Minor home repair grants for senior
homeowners.
Low income owner households
6
rehabilitation for all renters and owners from low
� Minor home repairs in conjunction with weatherization for low and moderate income homeowners.
Moderate income owner households
24
income to moderate income.
� Survey of existing housing conditions to provide a profile of the areas most in need of rehabilitation.
Moderate income small family renter households
9
Repair grants for 30
seniors 225
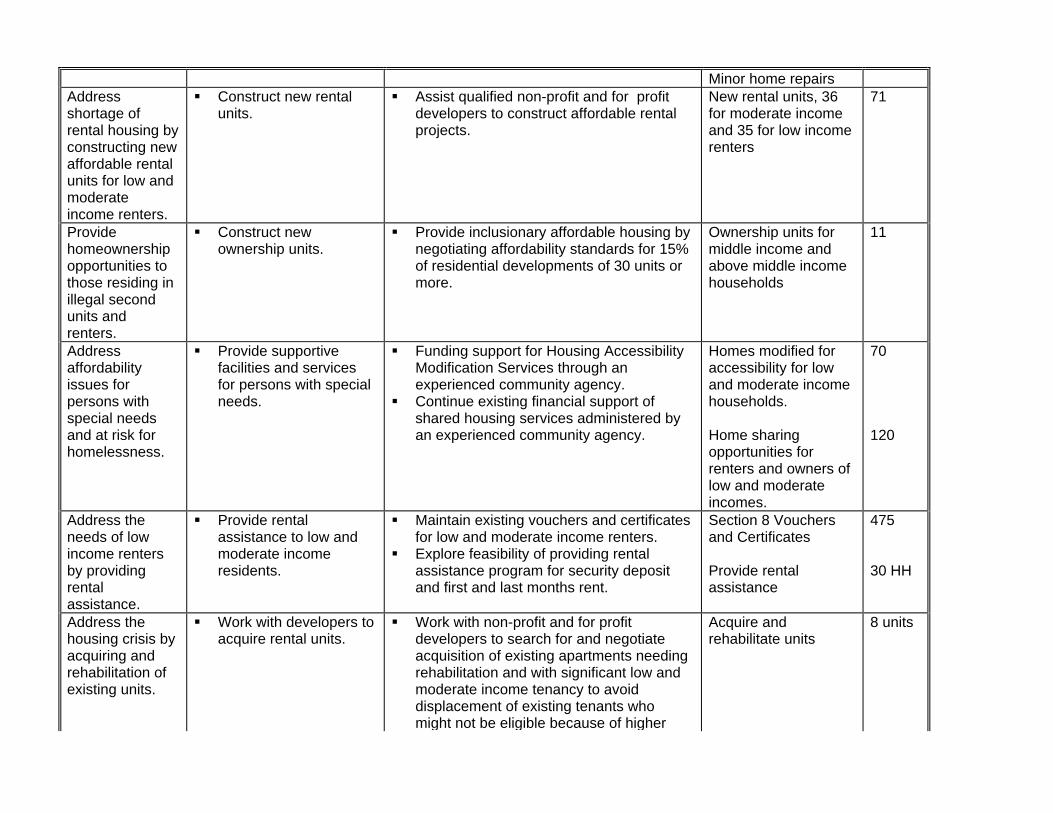
Minor home repairs Address shortage of rental housing by constructing new affordable rental units for low and moderate income renters.
� Construct new rental units.
� Assist qualified non-profit and for profit developers to construct affordable rental projects.
New rental units, 36 for moderate income and 35 for low income renters
71
Provide homeownership opportunities to those residing in illegal second units and renters.
� Construct new ownership units.
� Provide inclusionary affordable housing by negotiating affordability standards for 15% of residential developments of 30 units or more.
Ownership units for middle income and above middle income households
11
Address � Provide supportive � Funding support for Housing Accessibility Homes modified for 70 affordability facilities and services Modification Services through an accessibility for low issues for for persons with special experienced community agency. and moderate income persons with needs. � Continue existing financial support of households. special needs shared housing services administered by and at risk for an experienced community agency. Home sharing 120 homelessness. opportunities for
renters and owners of low and moderate incomes.
Address the needs of low income renters
� Provide rental assistance to low and moderate income
� Maintain existing vouchers and certificates for low and moderate income renters.
� Explore feasibility of providing rental
Section 8 Vouchers and Certificates
475
by providing rental assistance.
residents. assistance program for security deposit and first and last months rent.
Provide rental assistance
30 HH
Address the housing crisis by acquiring and rehabilitation of existing units.
� Work with developers to acquire rental units.
� Work with non-profit and for profit developers to search for and negotiate acquisition of existing apartments needing rehabilitation and with significant low and moderate income tenancy to avoid displacement of existing tenants who might not be eligible because of higher
Acquire and rehabilitate units
8 units
incomes.
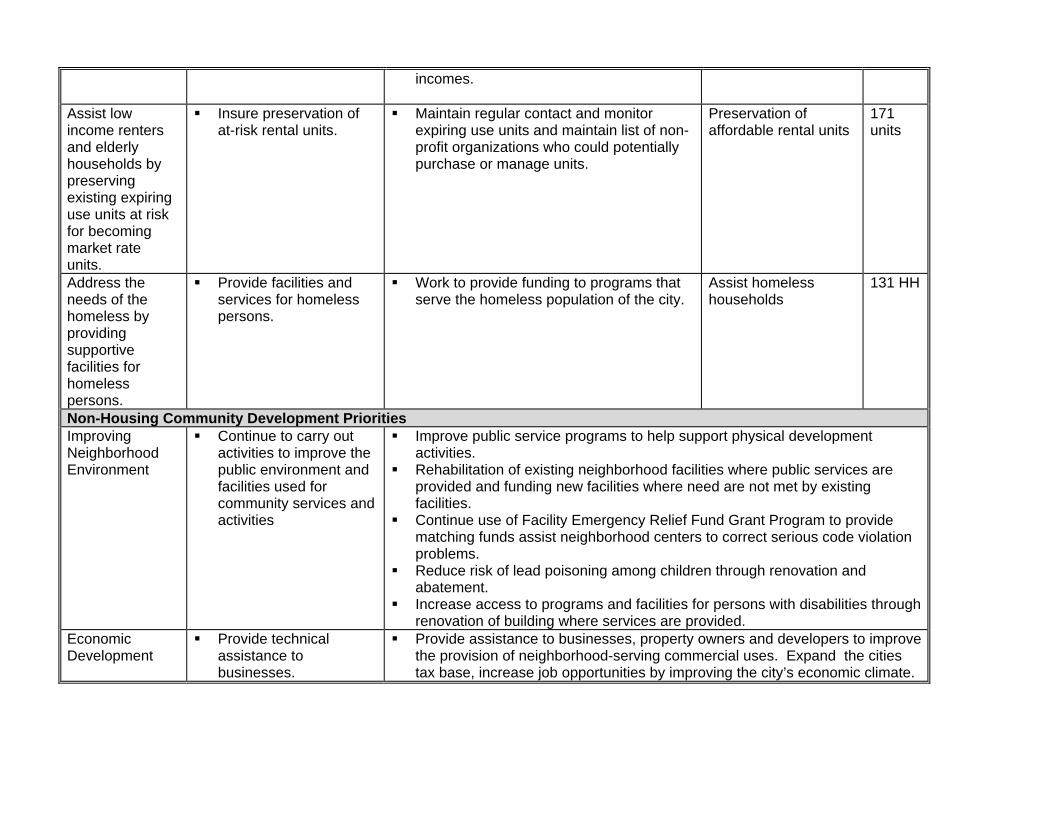
Assist low income renters and elderly households by preserving existing expiring use units at risk for becoming market rate units.
� Insure preservation of at-risk rental units.
� Maintain regular contact and monitor expiring use units and maintain list of non-profit organizations who could potentially purchase or manage units.
Preservation of affordable rental units
171 units
Address the needs of the homeless by providing supportive facilities for homeless persons.
� Provide facilities and services for homeless persons.
� Work to provide funding to programs that serve the homeless population of the city.
Assist homeless households
131 HH
Non-Housing Community Development Priorities Improving Neighborhood Environment
� Continue to carry out activities to improve the public environment and facilities used for community services and activities
� Improve public service programs to help support physical development activities.
� Rehabilitation of existing neighborhood facilities where public services are provided and funding new facilities where need are not met by existing facilities.
� Continue use of Facility Emergency Relief Fund Grant Program to provide matching funds assist neighborhood centers to correct serious code violation problems.
� Reduce risk of lead poisoning among children through renovation and abatement.
� Increase access to programs and facilities for persons with disabilities through renovation of building where services are provided.
Economic Development
� Provide technical assistance to businesses.
� Provide assistance to businesses, property owners and developers to improve the provision of neighborhood-serving commercial uses. Expand the cities tax base, increase job opportunities by improving the city’s economic climate.

Capital Improvement
� Use CDBG funds to provide capital
� Improve and encourage neighborhood serving commercial uses. � Provide funding for equipment to assist agencies who provide needed
Projects improvements in a variety of areas.
services to low income residents. � Remove architectural barriers for the physically disabled. � Provide child care and other services for children and their families. � Provided support for services that provide food for low income residents. � Provide support for health care services to low income residents. � Provide legal assistance to low-income residents. � Provide preventative service to “at-risk” low-income youth. � Provide public services and facilities for special needs populations. � Affirmatively further fair housing activities � Provide code enforcement activities.
5: Marin County Local Assessment for the 1990s
Housing Market
� In 1990, Marin County was an affluent suburb located across the Golden Gate Bridge form San Francisco with a population of 230,096. Marin was characterized by an older, wealthy, predominantly White, well-educated, and gainfully employed population. In comparison to other California counties, Marin’s population had higher income, percentages of college graduates, and a higher percentage of persons in professional positions.
� The local housing market was characterized by high prices for single family homes, high rents, low vacancy rates, a shortage of vacant land suitable for development and a severe shortage of affordable housing. Because of the high cost of development in Marin County, it was impossible to encourage affordable housing development without substantial subsidies.
� In response to community opposition and environmental concerns, local zoning ordinances in Marin County favored low density developments and thus small projects were not able to benefit from economies of scale and thus private market housing construction has focussed on expensive single family homes ranging from $450,000 to $1,000,000.
� The major trends that affected Marin County’s housing market in the 1980s were job growth, rising household incomes, an increased demand for housing, diminishing land supply for housing, and a reduction in housing supply.
� Between 1980 and 1990, Marin County experienced a 37% increase in the number of jobs, and household income more than doubled.
� Growth in supply of new housing dropped sharply in the 1980s. Before 1980 housing supply increased by more than 20,000 units per decade, in the 1980s however, the increase of housing units was just over 7000 units.
� The recession of the 1980s, a water shortage resulting in a building moratorium, and general opposition to growth may all have contributed to the decline in supply. All these factors resulted in high prices for homes and high rents. The vacancy rates during the early 1990s were 3.8% for rental and 1.7% for owner-occupied units.
� In terms of affordability for low and moderate income persons, Marin County tended to be out of reach for homeownership. Census date from 1990 as well as CHAS data showed that only 3% of low income households could purchase a home in Marin County and only 2.2% of low and extremely low income households could afford to purchase a home.
� The rental market was better in terms of affordability. Low income households could afford 37>6% of available rental units, and very low income households could afford 18% of available units.
Demographics
� In 1990 the Marin County population was predominantly white (88.7%), a decrease from 92.6% in the previous decade. The increase in the minority population was driven by the 94.81% increase in the Hispanic population.
� In terms of households, White households made up 90.4& of all households, African Americans, 1.8%, Hispanics 4.4%, Asian/Pacific Islanders 3 percent of all households.
� African American and Hispanic households made up a majority of very low income households at 38.9% and 32.3% respectively.
� According to the 1990 Census, the population aged 60 and older in Marin County increased by 23% in the 1980s, seven times faster than the total population. Once third of the over sixty population is are over seventy-five. The fastest growing segment of the Marin County population is in the over eighty-five demographic.
Special Populations
� According to the Marin Center for Independent Living (MCIL) in the early 1990s there were 32,000 persons with disabilities living in Marin County, the majority of which live in CDBG low income units. In addition, Marin County ARC estimates the county has 1500 residents who are developmentally disabled.
� The Marin County Department of Health estimated that in the early 1990s there were no more than 10 families living in Marin County in where an adult member of the household had AIDS leading to the conclusion that less than 2% of persons living with AID sin Marin counties are part of families with children.
� The HOPWA program provides rental assistance of 98 households in Marin County.

6: Marin County Local Priorities and Strategies
MARIN COUNTY
PRIORITIES STRATEGIES ACTIVITIES FIVE YEAR TARGET
Extremely and very low income individuals and families excluding homeowners and first time homebuyers.
� Acquisition and rehabilitation, and new construction of rental housing, rental assistance, and provision of facilities for persons with disabilities or special needs
All low income individuals and families, very low income and low income homeowners excluding first-time homebuyer programs especially in low income neighborhoods.
� Acquisition and rehabilitation, and new construction of rental housing, rental assistance, and provision of facilities for persons with disabilities.
Homelessness Prevention � Community-based organization take the lead in providing homeless prevention and counseling services to the affected population.
Non-Housing Community Development Priorities Improving services to special populations.
� Continue to carry out activities to improve the access of social service for persons with special needs by providing financial assistance to facilities serving extremely low income very low income, and moderate income people and neighborhoods.

5: San Mateo Local Assessment for the 1990s
Housing Market � The City of San Mateo is approximately 22 miles from San Francisco whose population in 1994 was 90,360.
� Historically, the San Mateo was a viewed as a bedroom community serving San Francisco, but by the 1960’s the population grew dramatically and the economy shifted to office and retail sectors. These changes altered the image of San Mateo as a bedroom community to one where people can live and work.
� In the 1990’s, San Mateo was very built out with little available vacant land thus leading to the redevelopment of underutilized properties as a vehicle for development.
� The 1990 census revealed that San Mateo had experienced significant a 10% population growth during the 1980’s. Some neighborhoods experienced particularly high growth ranging between 15-21 percent.
� The number of households in San Mateo had increased by 9% in the 1980’s. By 1990 there were 35, 496 households of which 48% were married-couple families, 19% single female headed households, and 12% single male headed households.
� Between 1980 and 1990 the number of overcrowded units grew by 3% totaling 7% of the housing stock in 1994.
� The 1990 census revealed that overall, San Mateo’s age distribution had shifted to an older population with only 19% of the population below the age of 18.
� In 1990, the MFI for San Mateo was $51,502 significantly greater than the national median of $35,939.
� In 1990 18% of households were considered to be low-income, 9 % moderate income, and 8& middle income. About 6% of people were considered to be living below the poverty line.
� San Mateo’s housing stock continued to increase in the 1980’s. The 1990 census revealed that there were 36,928 housing units of which 45.5% were single family detached homes.
� Though the trends shifted in both directions at different times, by 1990, housing tenure was almost evenly split between renters and owners (51% and 19% respectively).
� In 1990, approximately 75% of the housing units in San Mateo were over 25 years old of which more than 57% were built before 1960. Despite this, only 1% of the city’s housing stock was considered substandard. All of these units were deemed suitable for rehabilitation rather than demolition. All of these housing units were concentrated in the same neighborhood.
� Affordability continued to be a problem in the 1990’s for ownership. As employment trended towards the lower service sectors of the market, it was expected that affordability would continue to grow as a problem. Housing prices grew astronomically from the

1960’s to 1990 from $19,200 to $344,300. Household income did not keep up with the inflation of property values. Demographics
� During the 1980’s the population of San Mateo became more diverse. By 1990, Non-Hispanic whites made up 68% of the population a 10% decrease since 1980. Hispanics made up 15% of the population, a 6% increase, Asian/Pacific Islanders made up 13% of the population an increase of 5%, and African Americans made up 3% of the population, a 1% decrease.
� Of those households considered to be of low income, 72% were Non-Hispanic White, 13% were Hispanic, 10% were API, and 4% were African American.
� Since 1980, the Asian and Hispanic population experienced the largest increase in the number of persons living below the poverty level (an 11 and 21 percent increase respectively).
Special Populations � In 1990, Hunger and Homeless Action Coalition (HHAC) of San Mateo County estimated that there were 7000-9000 people who
experience episodic homelessness in all f San Mateo county. Based on these numbers they estimated that approximately 2000 homeless persons could be found in the City of San Mateo this conflicts with data from the Department of Health and Human Services who estimates that 800 (not including children) homeless persons reside in the city of San Mateo on any given day.
� The majority of homeless persons were between the ages of 20-34, 41.4% were White non-Hispanic, 34% were African American, 11.5% were Hispanic, and 1.6% were Asian.
� Nearly half of the homeless population (48.4%) had children either as single parents or as couples with children, and 22% reported that they were employed both full and part-time. The leading cause of their homelessness reported by those surveyed was the inability to cover the cost of their rent.
� As inmost communities, the homeless population is also made up of those who require special attention. In particular, those who are mentally ill (15%), have substance abuse (25%), and those fleeing from domestic violence (19%).
� In addition to homelessness, the other special needs populations include persons living with HIV/AIDS 3000-5000 who are HIV infected and 1,085 who are AIDS defined.
� In 1990 it was estimated that 15% (12,823)of the San Mateo population were people living with physical disabilities.
� According to the 1990 census 12, 340 persons over the age of 65 lived in San Mateo and 25% of all householders were over 65.
� In 1990, The San Mateo County Human Services Agency determined that 448 persons with substance abuse issues lived in San Mateo and that 112 households require some form of supportive housing because of substance abuse issues.
� In 1990, the Association of Retarded Citizens (ARC) estimated that 3% of persons living in San Mateo suffered from mental illness or a developmental disability.

6: San Mateo Local Priorities and Strategies
SAN MATEO
PRIORITIES STRATEGIES ACTIVITIES FIVE YEAR TARGET Preserving affordable housing stock for low and moderate income owners and renters.
� Housing rehabilitation program.
� Minor home repair and paint.
� Lead-based paint hazard reduction
� First time home buyers program
� Provide low interest home repair loans to low and moderate income owners and investors who agree to rent to low and moderate income renters.
� Provide free minor home repair and paint to low income owners.
� Develop and provide education programs for lead paid abatement.
� Provide deferred payment loan and down payment assistance program to middle income first time homebuyers.
�
Housing Rehabilitation
23 units
Expand affordable housing opportunities for low income persons as a way to prevent homelessness.
� Use city “second unit” ordinance to allow for construction of legal second units.
� Below market rate program.
� Redevelopment program
� Downtown conversion program
� Continue to allow legal second units to be built.
� Use inclusionary zoning rules to insure that developments with 11 or more units have 10% designated as affordable units.
� Any new development in certain districts triggers set asides for affordable units.
� Convert commercial space into one-bedroom units affordable to person at 50% of median income.
Legal second units
Zoning rules
Set asides
Conversion program
6 units per year 6 units total
47 units
8 units
Address special needs housing for homeless persons, persons with HIV/AIDS. The mentally ill, the elderly and frail elderly, and persons with disabilities.
� Continue to support county human service agencies.
� Set aside funds to support San Mateo County and City human services agencies and solicit proposals from service providers to develop housing and services.

Non-Housing Community Development Priorities Capital Improvements
� Citizen Participation � Projects
� The Citizen Task Force comprised of representatives of city boards and commissions developed a capital improvement plan that was vetted throughout the community for approval.
� The City will continue to develop Gateway Park, continue to modify buildings to meet ADA standards, and continue the sidewalk and street repair program.
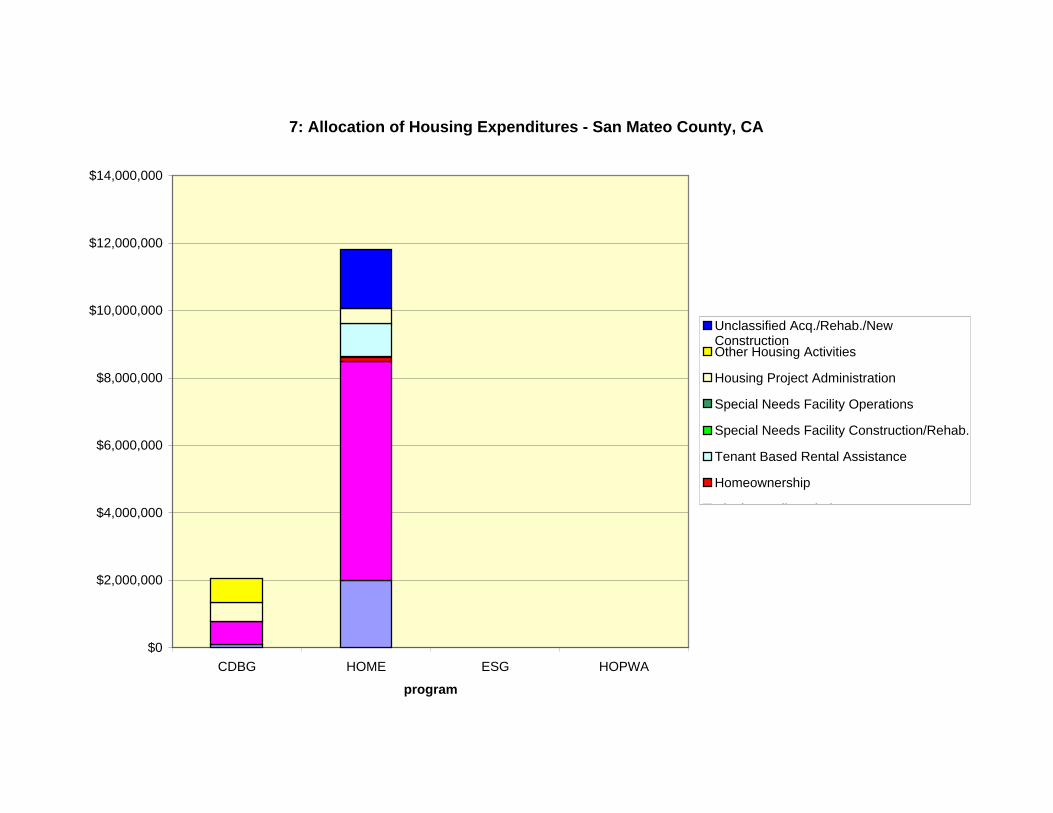
7: Allocation of Housing Expenditures - San Mateo County, CA
$14,000,000
$12,000,000
$10,000,000
$8,000,000
$6,000,000
$4,000,000
$2,000,000
$0 CDBG HOME ESG HOPWA
program
Unclassified Acq./Rehab./New Construction Other Housing Activities
Housing Project Administration
Special Needs Facility Operations
Special Needs Facility Construction/Rehab.
Tenant Based Rental Assistance
Homeownership
Si l F il R h b

7: Allocation of Housing Expenditures - Marin County, CA
$3,500,000
$3,000,000
$2,500,000
$2,000,000
$1,500,000
$1,000,000
$500,000
$0
Unclassified Acq./Rehab./New Construction Other Housing Activities Housing Project Administration Special Needs Facility Operations Special Needs Facility Construction/Rehab. Tenant Based Rental Assistance Homeownership Single Family Rehab. Multifamily (Acq./Rehab./New Construction)
CDBG HOME ESG HOPWA