Embed Size (px)
Citation preview
1
Land Use Planning in Alberta: An Overview
Biol. 595Sept. 16, 2009

2
1930:• National Parks Act
1948-1949: • Green Zone
• AB Forest Service
• Forests Act
0
2
4
6
8
10
12
14
16
18
20
22
24
1930 1940 1950 1960 1970 1980 1990
Year
Harv
est
(mil
lio
n m3 )
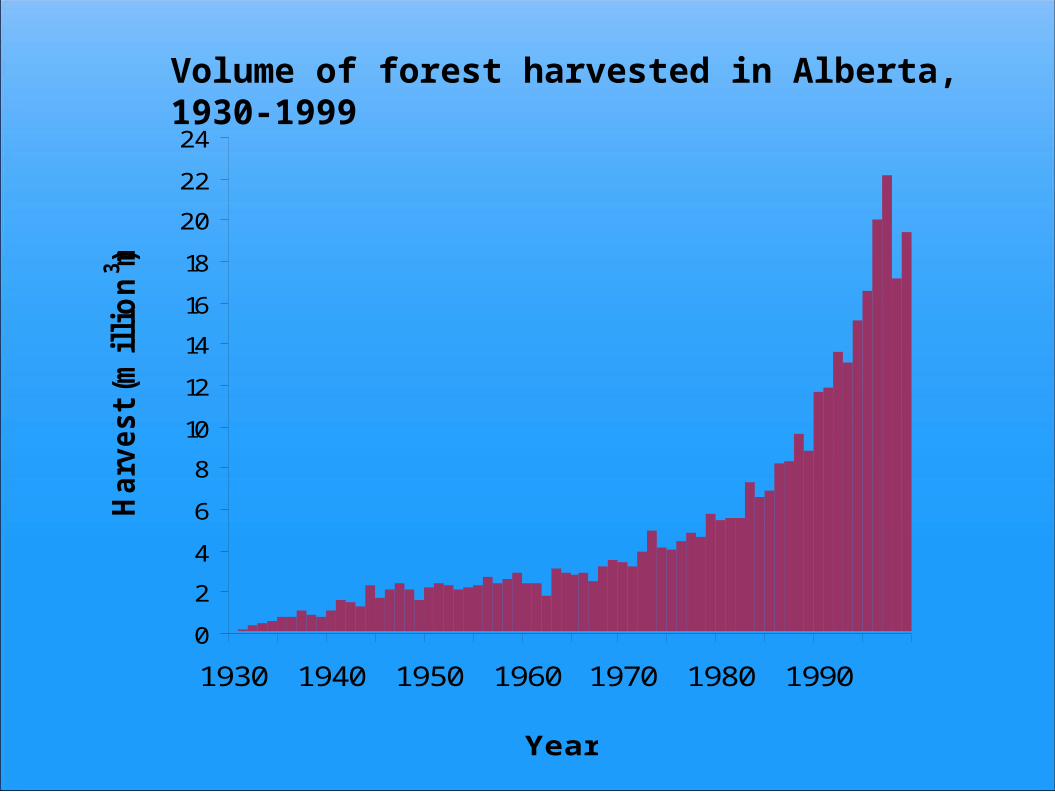
Volume of forest harvested in Alberta, 1930-1999
AWR
1820
19
917
16
14 13
12
11
10
8
75
4 3
1
2
WBNP
6 *
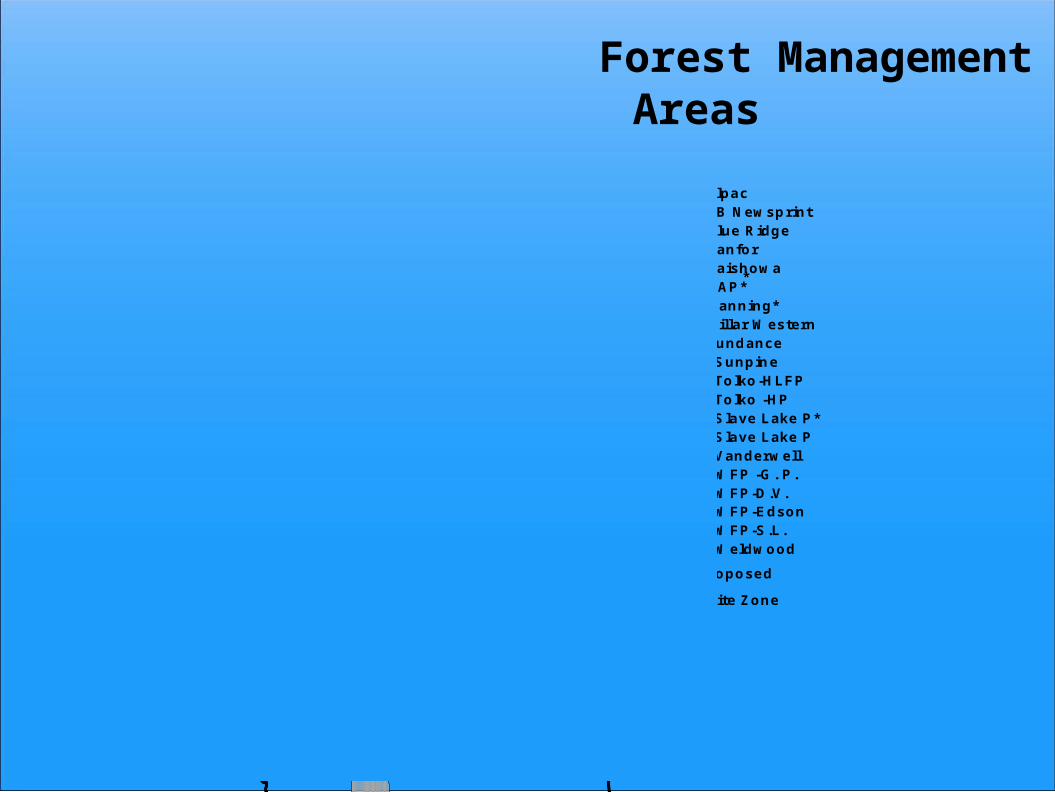
1 Alpac2 AB Newsprint3 Blue Ridge4 Canfor5 Daishowa6 GAP*7 Manning*8 Millar Western9 Sundance10 Sunpine11 Tolko-HLFP12 Tolko -HP13 Slave Lake P*14 Slave Lake P15 Vanderwell16 WFP -G. P.17 WFP-D.V.18 WFP-Edson19 WFP-S.L.20 Weldwood
*Proposed
White Zone
Forest Management Areas


Number of wells drilled per year in Alberta, 1990-2005
0
5,000
10,000
15,000
20,000
1990 1995 2000 2005

WellsitesWellsites
Petroleum Sector Footprint

Untitled
Page 6
0 50 100 150 200
Simulated Years into Future
1:
1:
1:
0
500000
1000000
F Class km[Transport]: 1 -
Untitled
Page 6
0 50 100 150 200
Simulated Years into Future
1:
1:
1:
0
500000
1000000
F Class km[Transport]: 1 -
11
1
1
1900 1950 2000 2050 2100
Year
<---Historical Backcast--->20th Century
<--Projected Simulation-->21st Century
Transportation Sector
0 200K 800K
km
Transportation length

Remaining Intact Forest

Remaining Intact Forest by Province
0
10
20
30
40
50
60
70
80
90
100
21%
Global Forest Watch – Sept. 15, 2003

50
55
60
65
70
75
80
85
90
95
100
1993 1995 1997 1999 2001 2003
Year
Po
pu
lati
on
Ch
an
ge %
East Athabasca Caribou Herd

Land Use Conflicts: MinimalLand Use Conflicts: Minimal
Energy
Agriculture
Forestry
Residential
Mining
Recreation
Native Landscape
1950

Land Use Conflicts: SeriousLand Use Conflicts: Serious
Energy
Agriculture Forestry
Residential
Mining
Recreation
Native Landscape
Today

14
Maximize the rate of economic development
Mitigate environmental damage
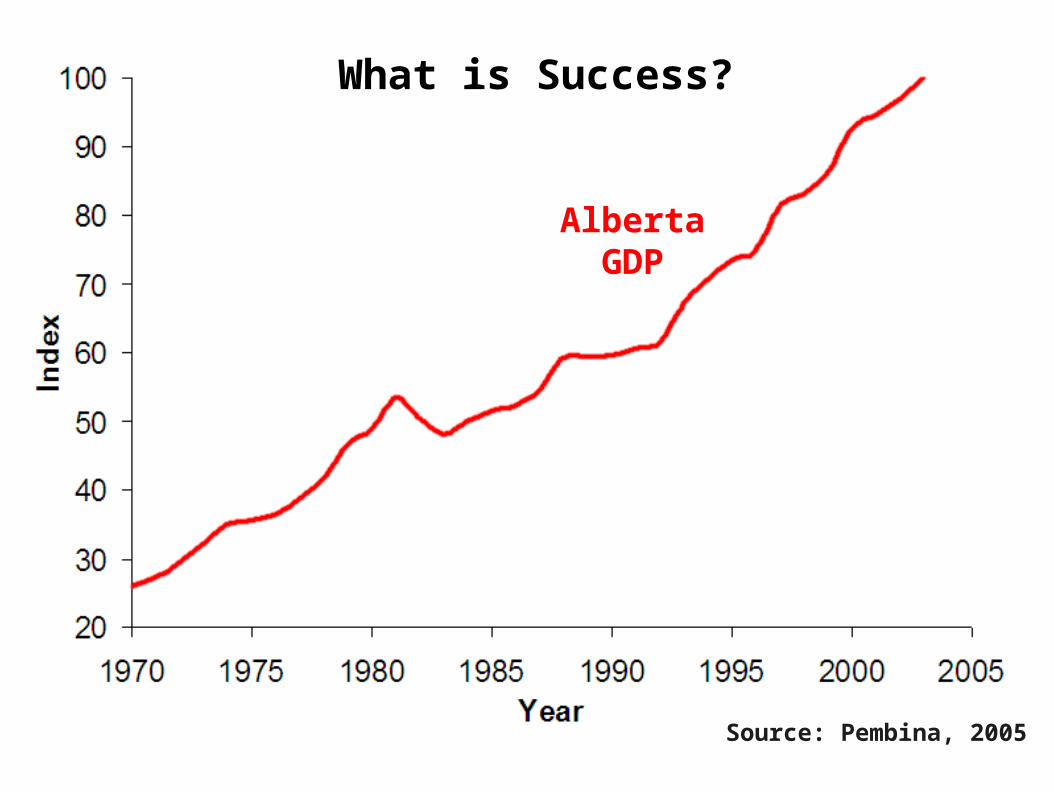
Source: Pembina, 2005
What is Success?
Alberta GDP
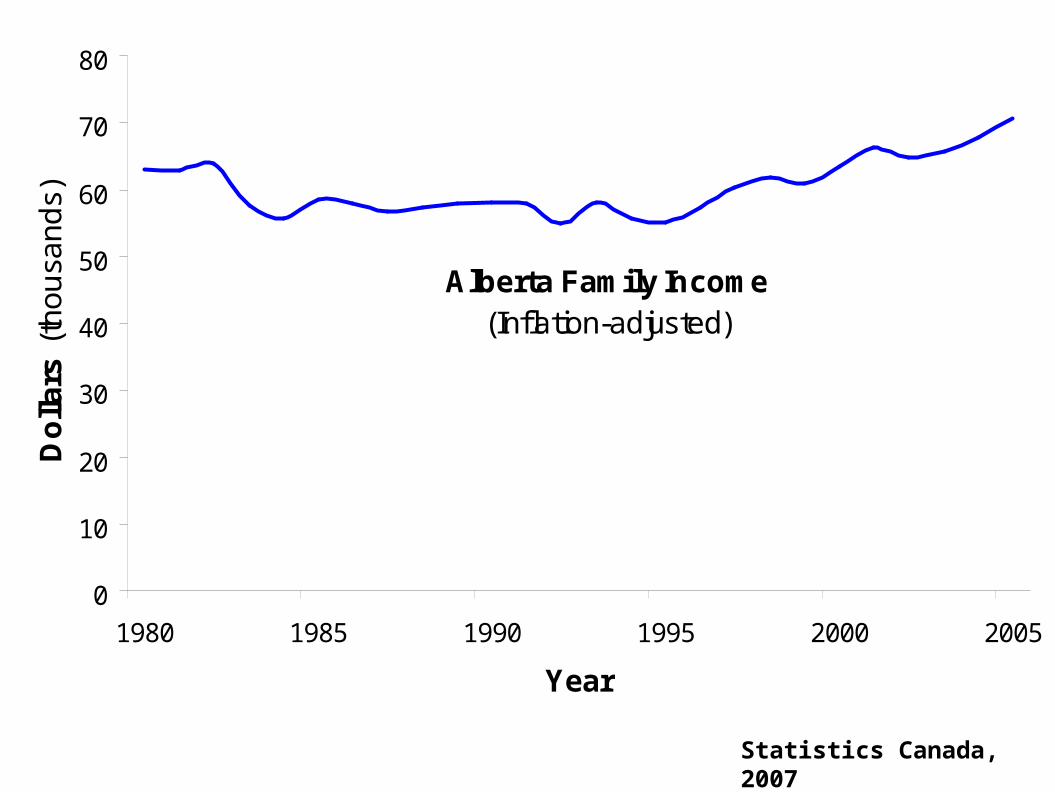
Statistics Canada, 2007
Alberta Family Income(Inflation-adjusted)
0
10
20
30
40
50
60
70
80
1980 1985 1990 1995 2000 2005
Year
Do
llars
(th
ou
san
ds)

0.65
0.85
1.05
1.25
1.45
1.65
1961
1963
1965
1967
1969
1971
1973
1975
1977
1979
1981
1983
1985
1987
1989
1991
1993
1995
1997
1999
Ind
ex, 1
971=
1.00
GDP Index
GPI Economic Index
GPI Social Index
GPI Environmental Index
Gross Domestic Product Index
GPI Economic Index
GPI Social Index
GPI Environmental Index
Year
Ind
exGenuine Progress Indices
(GPI)
Source: Anielski et. al. 2001

Existing Philosophy: Open Frontier
Energy
Forestry
Residential
Recreation
Agriculture
Mining

Reality: Finite Landscape
Energy
Forestry
Residential
Recreation
Agriculture
Mining

Environment SRD Energy

“There are more and more people doing more and more activities on the same piece of land. The competition between user groups creates conflict, and often puts stress on the finite capacity of our land, air, water and habitat.”
“We have reached a tipping point, where sticking with the old rules will not produce the quality of life we have come to expect.”
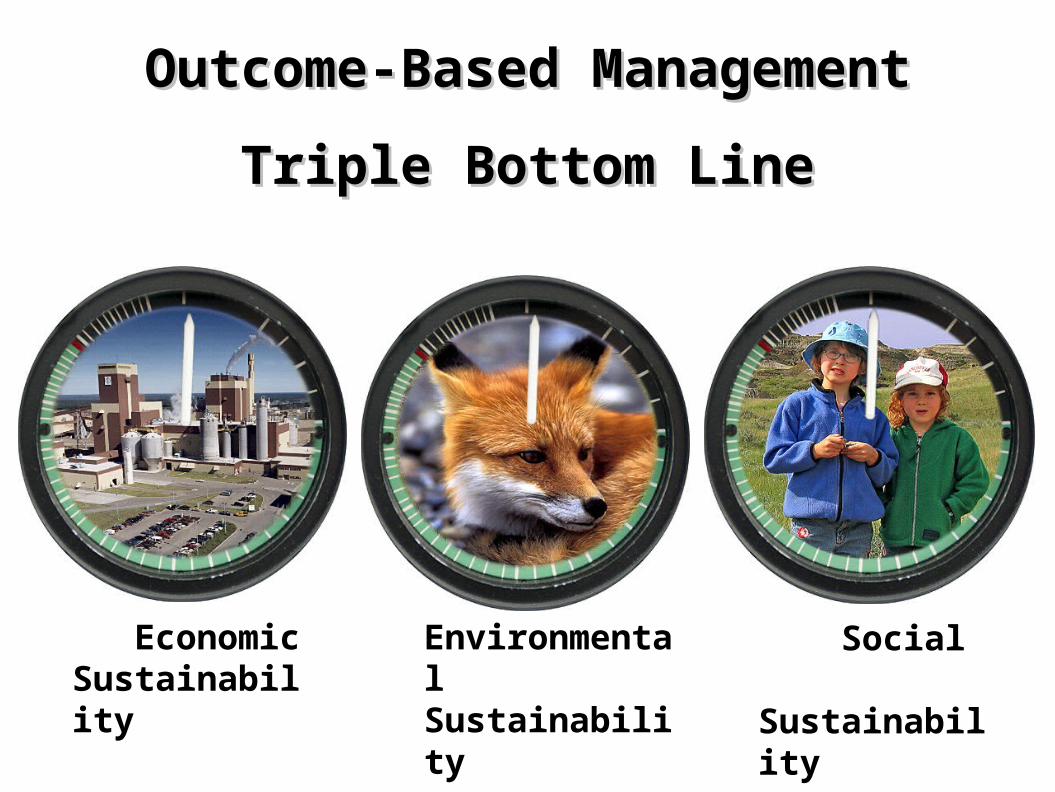
EconomicSustainability
Environmental Sustainability
Social Sustainability
Outcome-Based ManagementOutcome-Based Management
Triple Bottom LineTriple Bottom Line
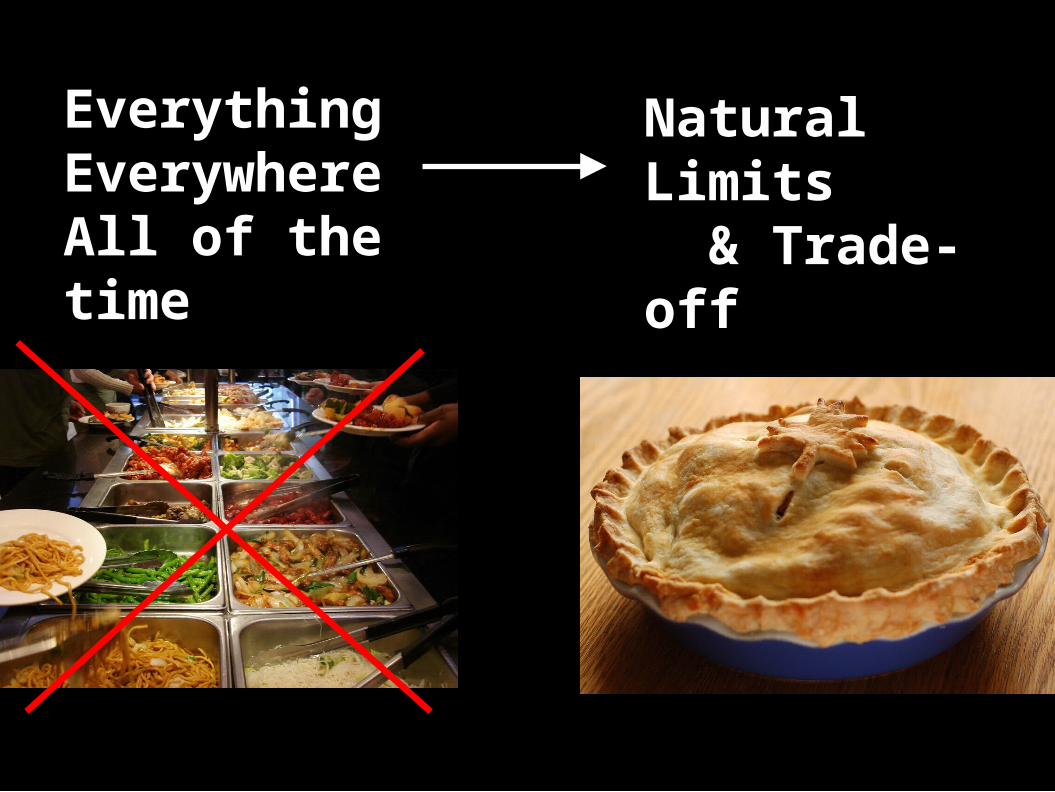
EverythingEverywhereAll of the time
Natural Limits & Trade-off Decisions

24
Integrated RegionalPlanning

Today’sActions
Tomorrow’sLandscapes
ComputerModeling
Achievable Future