Embed Size (px)
Citation preview
1
LEE MEMORIAL HEALTH SYSTEMLEE MEMORIAL HEALTH SYSTEMPresentation to Presentation to
Community Task ForceCommunity Task Force
January 27, 2003January 27, 2003
LEE MEMORIAL HEALTH SYSTEMLEE MEMORIAL HEALTH SYSTEMPresentation to Presentation to
Community Task ForceCommunity Task Force
January 27, 2003January 27, 2003
2
I. LMHS – A Valuable Community Owned Asset
II. Financial Information
III. Cost Effectiveness & Operational Efficiencies
IV. Challenges and Future Needs
V. Trauma Center
PRESENTATION OUTLINEPRESENTATION OUTLINE
3
LMHS – VALUABLE COMMUNITY OWNED ASSETLMHS – VALUABLE COMMUNITY OWNED ASSETServicesLEE MEMORIAL HOSPITAL (367 beds) JCAHO Accredited• Neurosciences• Orthopedics• Stroke• Trauma Center (1 of 20 in Florida)• Lee Cancer Care• Memory Disorder Clinic (1 of 14 in Florida)• Diabetes Care
THE REHABILITATION HOSPITAL (60 beds) CARF Accredited• Spinal Cord Injury• Brain Injury• Stroke • Neurological Disorders• Arthritis• Amputation and Multiple Trauma
LMH
S
4
Services – continued
HEALTHPARK MEDICAL CENTER (166 beds) JCAHO Accredited
• Cardiovascular• Obstetrics (including regional high risk)
CHILDRENS HOSPITAL OF SW FL (72 beds) JCAHO Accredited
• Regional Perinatal Intensive Care (1 of 11 in Florida)
• Pediatric Intensive Care• Children’s Rehab Center• Children’s Cancer Center (1 of 11 in Florida)
• Alliance with Doctors for Kids
LMHS – VALUABLE COMMUNITY OWNED ASSETLMHS – VALUABLE COMMUNITY OWNED ASSET
5
CAPE CORAL HOSPITAL (281 beds) JCAHO Accredited
• Orthopedics• Obstetrics• Neurosurgery• General Medical & Surgical Services• Designated Intake Facility for Bioterrorism Events
Other Services
LEE MEMORIAL HOME HEALTH CHAP Accredited
LEE PHYSICIAN GROUP JCAHO Accredited (65 PHYSICIANS; 20 office locations)
HEALTHPARK CARE CENTER (112 beds) JCAHO Accredited
Services – continued
LMHS – VALUABLE COMMUNITY OWNED ASSETLMHS – VALUABLE COMMUNITY OWNED ASSET
6
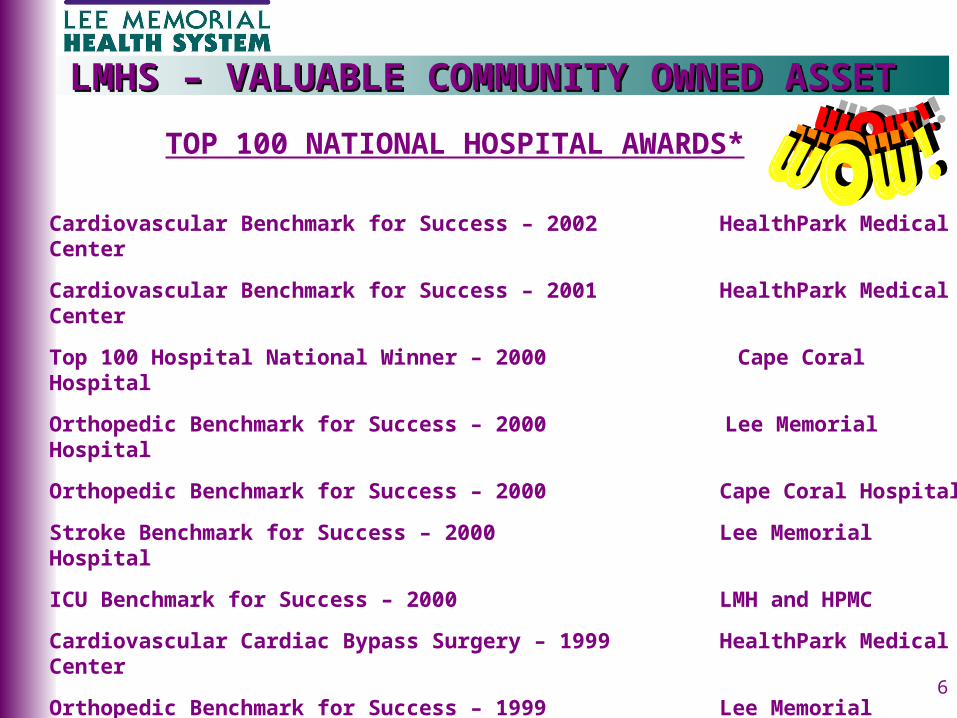
TOP 100 NATIONAL HOSPITAL AWARDS*
Cardiovascular Benchmark for Success – 2002 HealthPark Medical Center
Cardiovascular Benchmark for Success – 2001 HealthPark Medical Center
Top 100 Hospital National Winner – 2000 Cape Coral Hospital
Orthopedic Benchmark for Success – 2000 Lee Memorial Hospital
Orthopedic Benchmark for Success – 2000 Cape Coral Hospital
Stroke Benchmark for Success – 2000 Lee Memorial Hospital
ICU Benchmark for Success – 2000 LMH and HPMC
Cardiovascular Cardiac Bypass Surgery – 1999 HealthPark Medical Center
Orthopedic Benchmark for Success – 1999 Lee Memorial Hospital
*Solucient:measures of over 5000 hospitals looking at mortality, complications, readmission rates, volume, length of stay, cost of procedure
LMHS – VALUABLE COMMUNITY OWNED ASSETLMHS – VALUABLE COMMUNITY OWNED ASSET
7
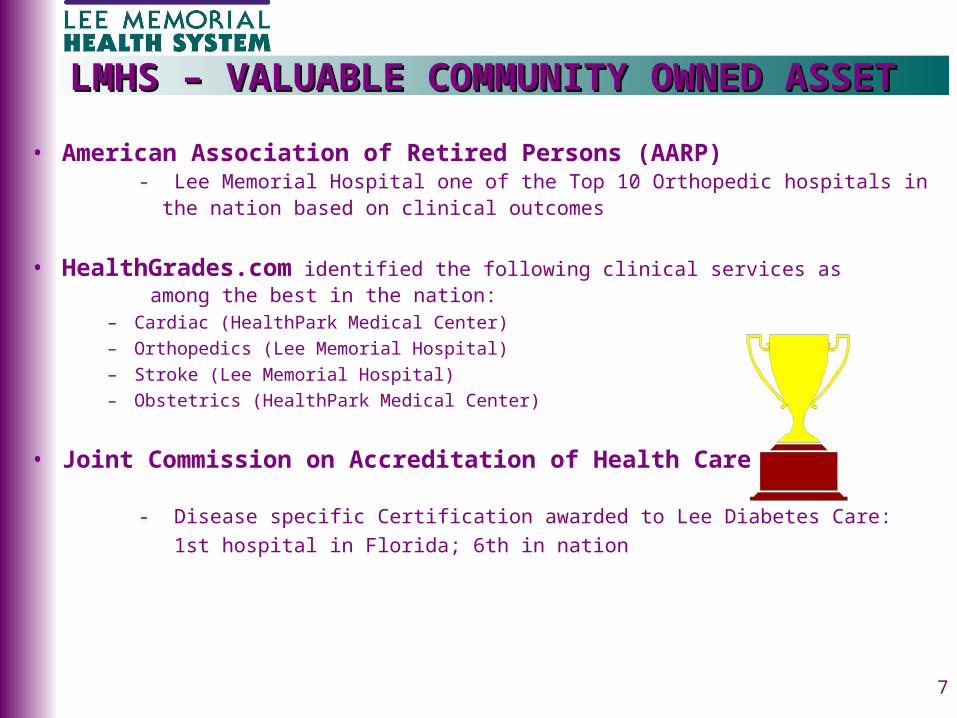
• American Association of Retired Persons (AARP) - Lee Memorial Hospital one of the Top 10 Orthopedic hospitals in the nation based on clinical outcomes
• HealthGrades.com identified the following clinical services as among the best in the nation:
– Cardiac (HealthPark Medical Center)– Orthopedics (Lee Memorial Hospital)– Stroke (Lee Memorial Hospital)– Obstetrics (HealthPark Medical Center)
• Joint Commission on Accreditation of Health Care
- Disease specific Certification awarded to Lee Diabetes Care: 1st hospital in Florida; 6th in nation
LMHS – VALUABLE COMMUNITY OWNED ASSETLMHS – VALUABLE COMMUNITY OWNED ASSET
8
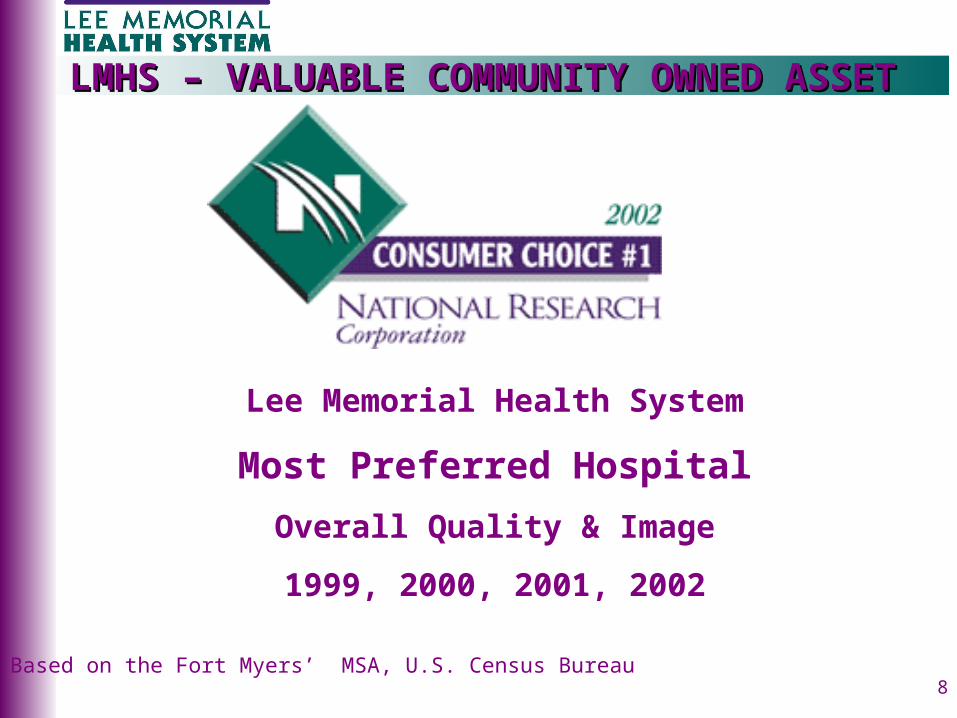
Lee Memorial Health System
Most Preferred Hospital
Overall Quality & Image
1999, 2000, 2001, 2002
Based on the Fort Myers’ MSA, U.S. Census Bureau
LMHS – VALUABLE COMMUNITY OWNED ASSETLMHS – VALUABLE COMMUNITY OWNED ASSET
9
• The University of PA, The Wharton School - Distinction for advancement of Nursing and Hospital
Management
• Florida Nurses Association, District 7 - Award for Excellence for three consecutive years (2000, 2001,
2002)
• Healthcare Advisory Board - Lee Cancer Care profiled nationally as Center of Excellence
LMHS
LMHS – VALUABLE COMMUNITY OWNED ASSETLMHS – VALUABLE COMMUNITY OWNED ASSET
10
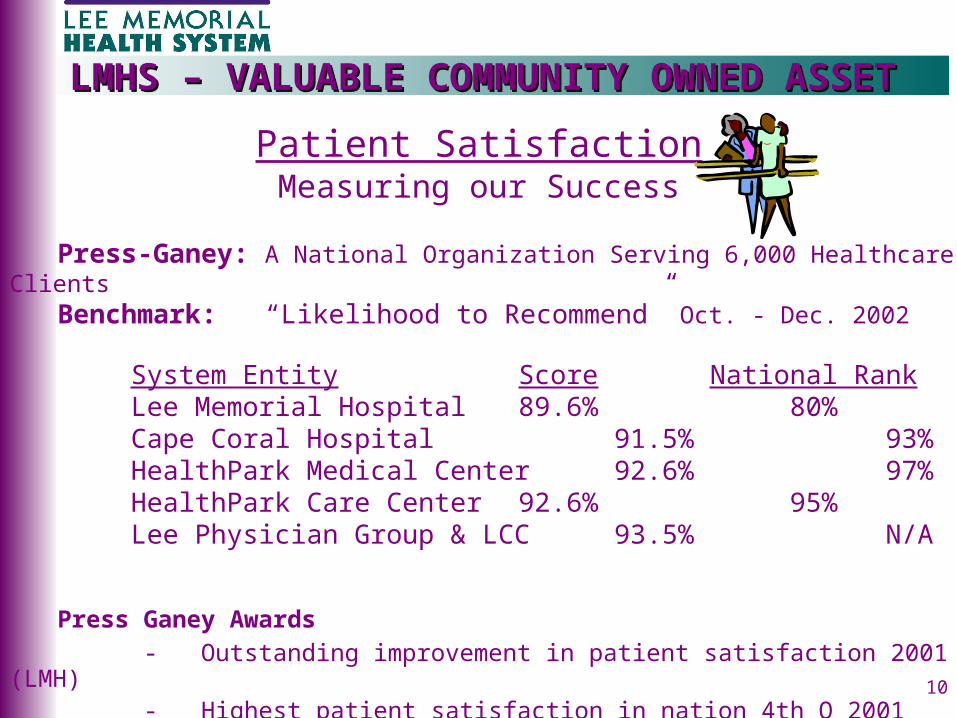
Press-Ganey: A National Organization Serving 6,000 Healthcare ClientsBenchmark: “Likelihood to Recommend” Oct. - Dec. 2002
System Entity Score National RankLee Memorial Hospital 89.6% 80%Cape Coral Hospital 91.5% 93%HealthPark Medical Center 92.6% 97%HealthPark Care Center 92.6% 95%Lee Physician Group & LCC 93.5% N/A
Press Ganey Awards - Outstanding improvement in patient satisfaction 2001 (LMH) - Highest patient satisfaction in nation 4th Q 2001 (CCH)
Patient SatisfactionMeasuring our Success
)
LMHS – VALUABLE COMMUNITY OWNED ASSETLMHS – VALUABLE COMMUNITY OWNED ASSET
11
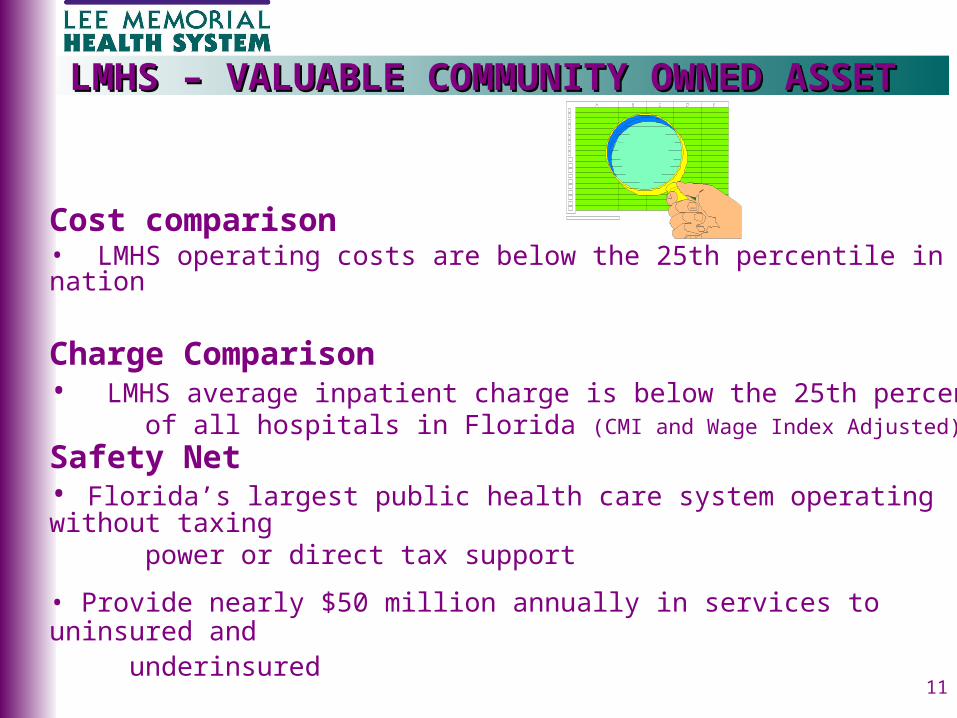
Cost comparison • LMHS operating costs are below the 25th percentile in the nation
Charge Comparison• LMHS average inpatient charge is below the 25th percentile of all hospitals in Florida (CMI and Wage Index Adjusted)
Safety Net• Florida’s largest public health care system operating without taxing power or direct tax support
• Provide nearly $50 million annually in services to uninsured and underinsured
LMHS – VALUABLE COMMUNITY OWNED ASSETLMHS – VALUABLE COMMUNITY OWNED ASSET
12
Low charges
Efficient operating expenses
High quality outcomes and patient safety
LMHS – VALUABLE COMMUNITY OWNED ASSETLMHS – VALUABLE COMMUNITY OWNED ASSET
13
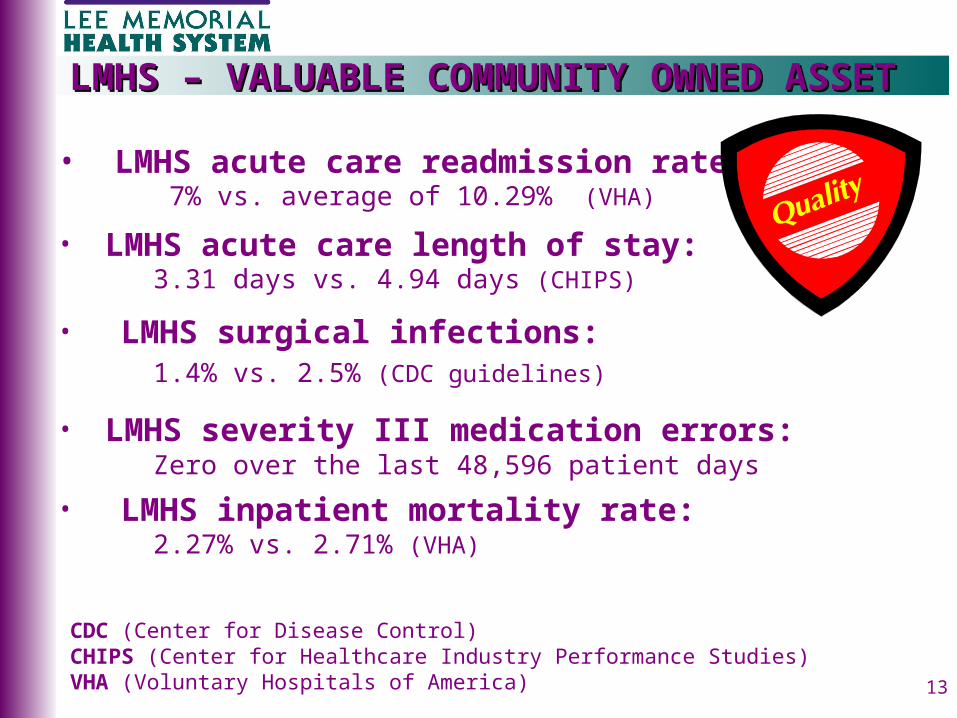
• LMHS acute care readmission rate: 7% vs. average of 10.29% (VHA)
• LMHS acute care length of stay:3.31 days vs. 4.94 days (CHIPS)
• LMHS surgical infections:1.4% vs. 2.5% (CDC guidelines)
• LMHS severity III medication errors:Zero over the last 48,596 patient days
• LMHS inpatient mortality rate:2.27% vs. 2.71% (VHA)
CDC (Center for Disease Control) CHIPS (Center for Healthcare Industry Performance Studies) VHA (Voluntary Hospitals of America)
LMHS – VALUABLE COMMUNITY OWNED ASSETLMHS – VALUABLE COMMUNITY OWNED ASSET
14
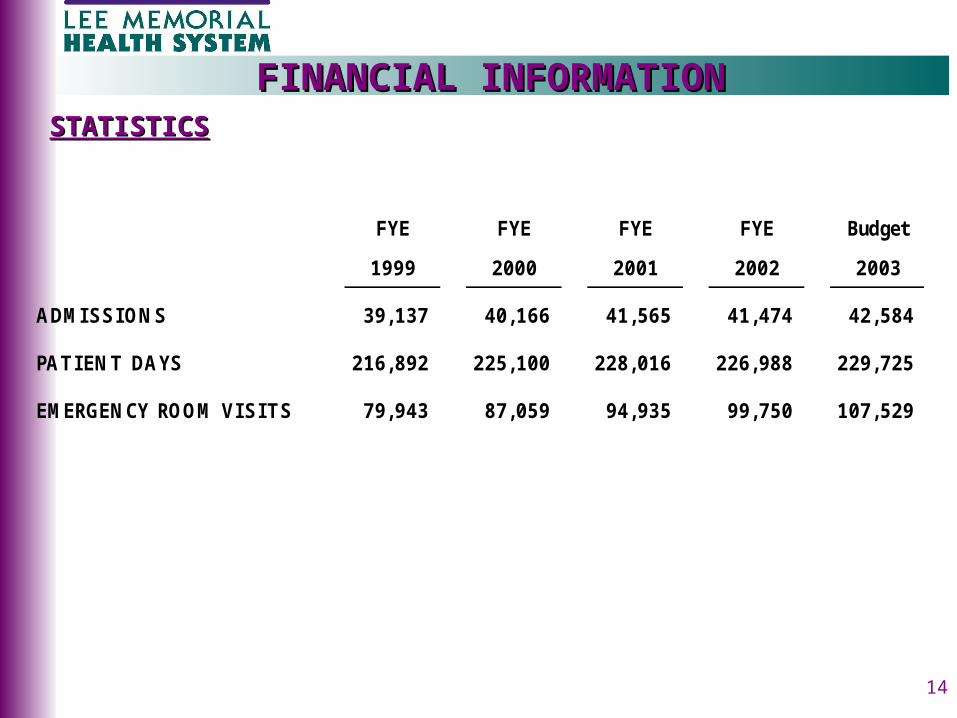
STATISTICSSTATISTICS
FINANCIAL INFORMATIONFINANCIAL INFORMATION
FYE FYE FYE FYE Budget
1999 2000 2001 2002 2003
ADMISSIONS 39,137 40,166 41,565 41,474 42,584
PATIENT DAYS 216,892 225,100 228,016 226,988 229,725
EMERGENCY ROOM VISITS 79,943 87,059 94,935 99,750 107,529
15
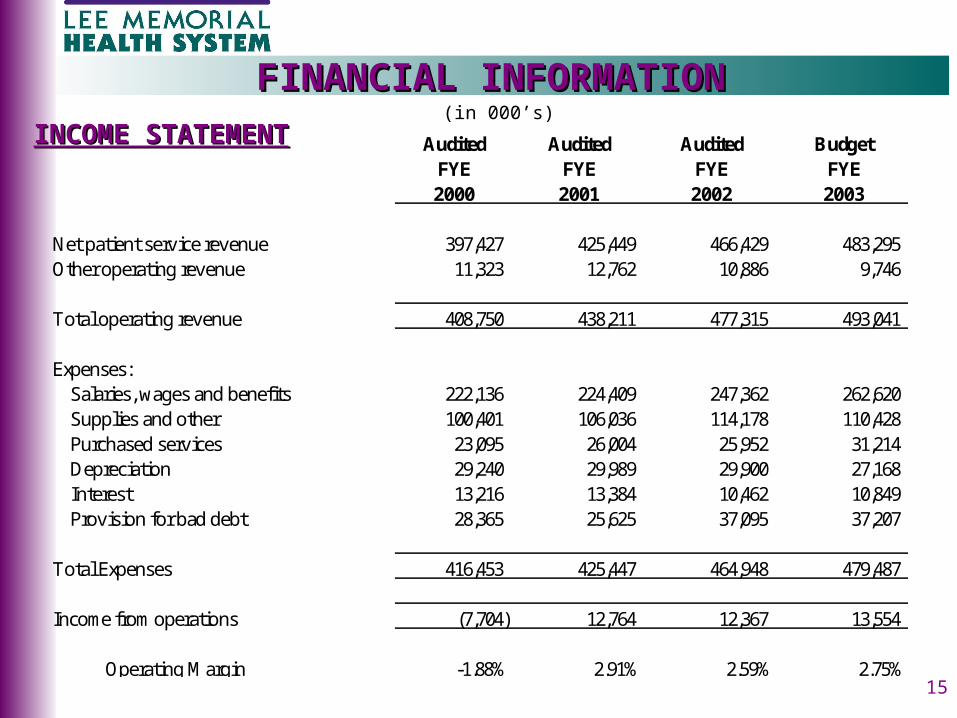
INCOME STATEMENTINCOME STATEMENT(in 000’s)
FINANCIAL INFORMATIONFINANCIAL INFORMATION
Audited Audited Audited BudgetFYE FYE FYE FYE2000 2001 2002 2003
Net patient service revenue 397,427 425,449 466,429 483,295 Other operating revenue 11,323 12,762 10,886 9,746
Total operating revenue 408,750 438,211 477,315 493,041
Expenses:Salaries, wages and benefits 222,136 224,409 247,362 262,620 Supplies and other 100,401 106,036 114,178 110,428 Purchased services 23,095 26,004 25,952 31,214 Depreciation 29,240 29,989 29,900 27,168 Interest 13,216 13,384 10,462 10,849 Provision for bad debt 28,365 25,625 37,095 37,207
Total Expenses 416,453 425,447 464,948 479,487
Income from operations (7,704) 12,764 12,367 13,554
Operating Margin -1.88% 2.91% 2.59% 2.75%
16
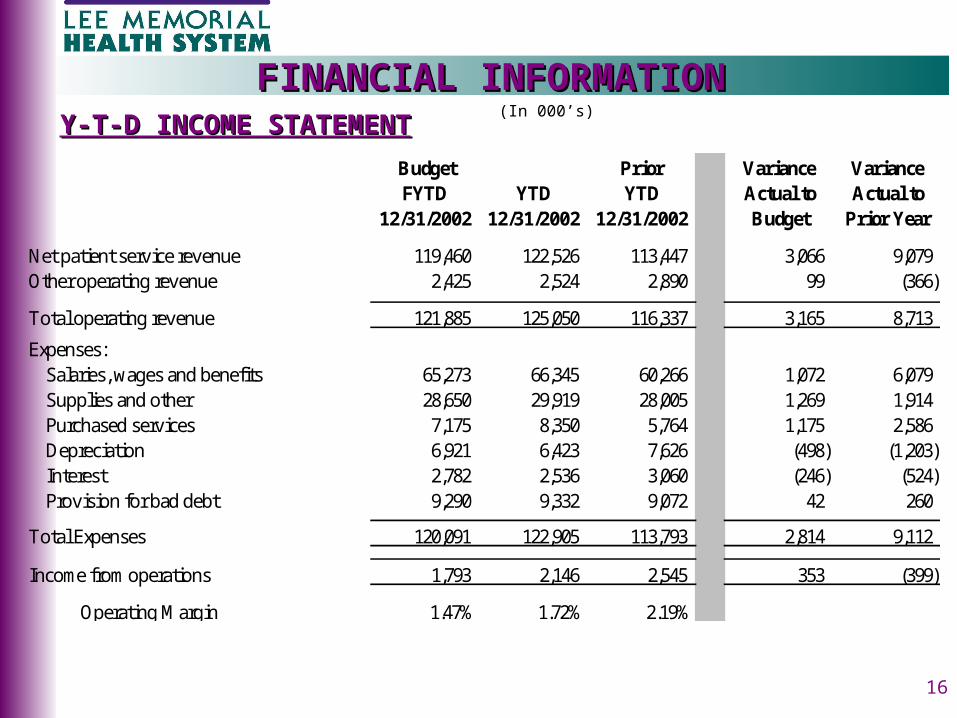
Y-T-D INCOME STATEMENTY-T-D INCOME STATEMENT(In 000’s)
FINANCIAL INFORMATIONFINANCIAL INFORMATION
Budget Prior Variance VarianceFYTD YTD YTD Actual to Actual to
12/31/2002 12/31/2002 12/31/2002 Budget Prior Year
Net patient service revenue 119,460 122,526 113,447 3,066 9,079 Other operating revenue 2,425 2,524 2,890 99 (366)
Total operating revenue 121,885 125,050 116,337 3,165 8,713
Expenses:Salaries, wages and benefits 65,273 66,345 60,266 1,072 6,079 Supplies and other 28,650 29,919 28,005 1,269 1,914 Purchased services 7,175 8,350 5,764 1,175 2,586 Depreciation 6,921 6,423 7,626 (498) (1,203) Interest 2,782 2,536 3,060 (246) (524) Provision for bad debt 9,290 9,332 9,072 42 260
Total Expenses 120,091 122,905 113,793 2,814 9,112
Income from operations 1,793 2,146 2,545 353 (399)
Operating Margin 1.47% 1.72% 2.19%
17
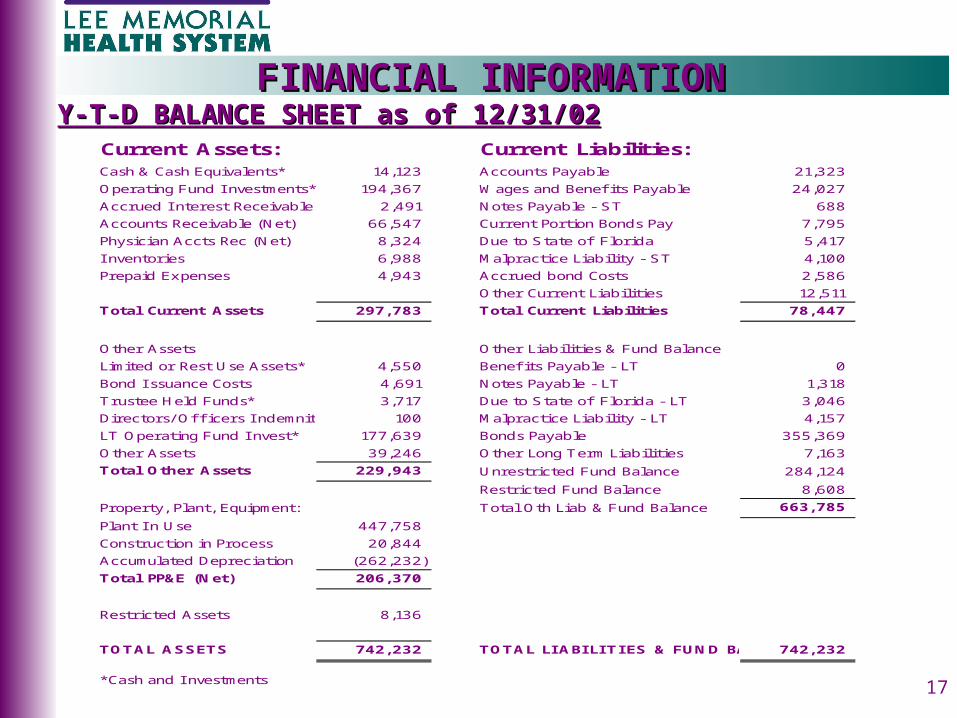
FINANCIAL INFORMATIONFINANCIAL INFORMATIONY-T-D BALANCE SHEET as of 12/31/02Y-T-D BALANCE SHEET as of 12/31/02
Current Assets: Current Liabilities:Cash & Cash Equivalents* 14,123 Accounts Payable 21,323
Operating Fund I nvestments* 194,367 Wages and Benefi ts Payable 24,027
Accrued I nterest Receivable 2,491 Notes Payable - ST 688
Accounts Receivable (Net) 66,547 Current Portion Bonds Pay 7,795
Physician Accts Rec (Net) 8,324 Due to State of Florida 5,417
I nventories 6,988 Malpractice Liability - ST 4,100
Prepaid Expenses 4,943 Accrued bond Costs 2,586
Other Current Liabilities 12,511
Total Current Assets 297,783 Total Current Liabilities 78,447
Other Assets Other Liabilities & Fund Balance
Limited or Rest Use Assets* 4,550 Benefi ts Payable - LT 0
Bond I ssuance Costs 4,691 Notes Payable - LT 1,318
Trustee Held Funds* 3,717 Due to State of Florida - LT 3,046
Directors/ Offi cers I ndemnity* 100 Malpractice Liability - LT 4,157
LT Operating Fund I nvest* 177,639 Bonds Payable 355,369
Other Assets 39,246 Other Long Term Liabilities 7,163
Total Other Assets 229,943 Unrestricted Fund Balance 284,124
Restricted Fund Balance 8,608
Property, Plant, Equipment: Total Oth Liab & Fund Balance 663,785
Plant I n Use 447,758
Construction in Process 20,844
Accumulated Depreciation (262,232)
Total PP&E (Net) 206,370
Restricted Assets 8,136
TOTAL ASSETS 742,232 TOTAL LIABILITIES & FUND BAL 742,232
*Cash and I nvestments
18
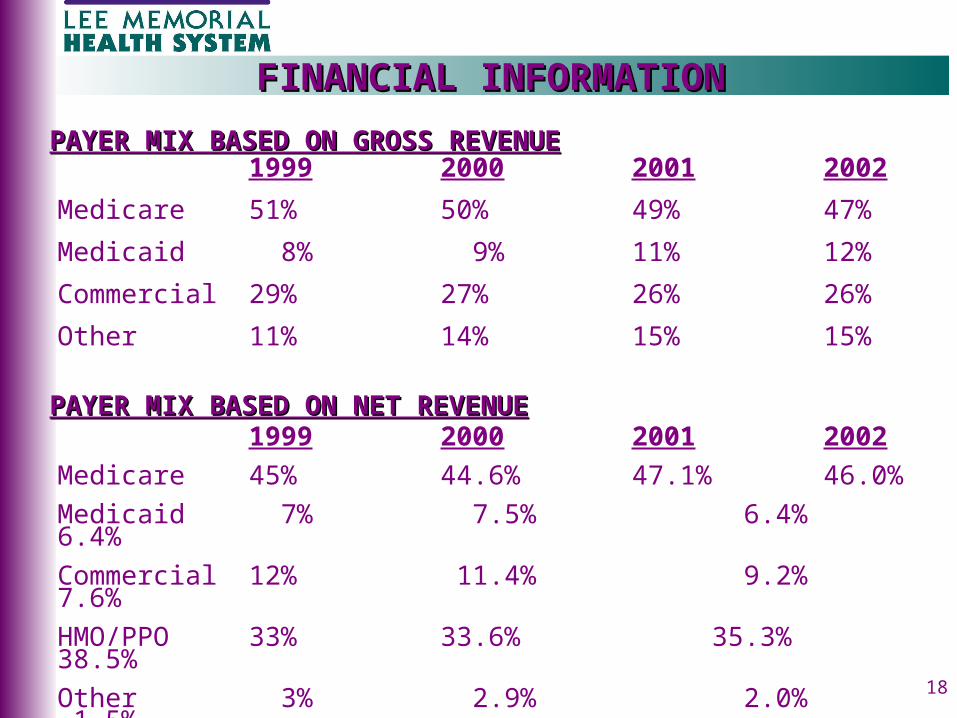
PAYER MIX BASED ON GROSS REVENUEPAYER MIX BASED ON GROSS REVENUE
FINANCIAL INFORMATIONFINANCIAL INFORMATION
1999 2000 2001 2002
Medicare 51% 50% 49% 47%
Medicaid 8% 9% 11% 12%
Commercial 29% 27% 26% 26%
Other 11% 14% 15% 15%
PAYER MIX BASED ON NET REVENUEPAYER MIX BASED ON NET REVENUE1999 2000 2001 2002
Medicare 45% 44.6% 47.1% 46.0%
Medicaid 7% 7.5% 6.4% 6.4%
Commercial 12% 11.4% 9.2% 7.6%
HMO/PPO 33% 33.6% 35.3% 38.5%
Other 3% 2.9% 2.0% 1.5%
19
FINANCIAL INFORMATIONFINANCIAL INFORMATION
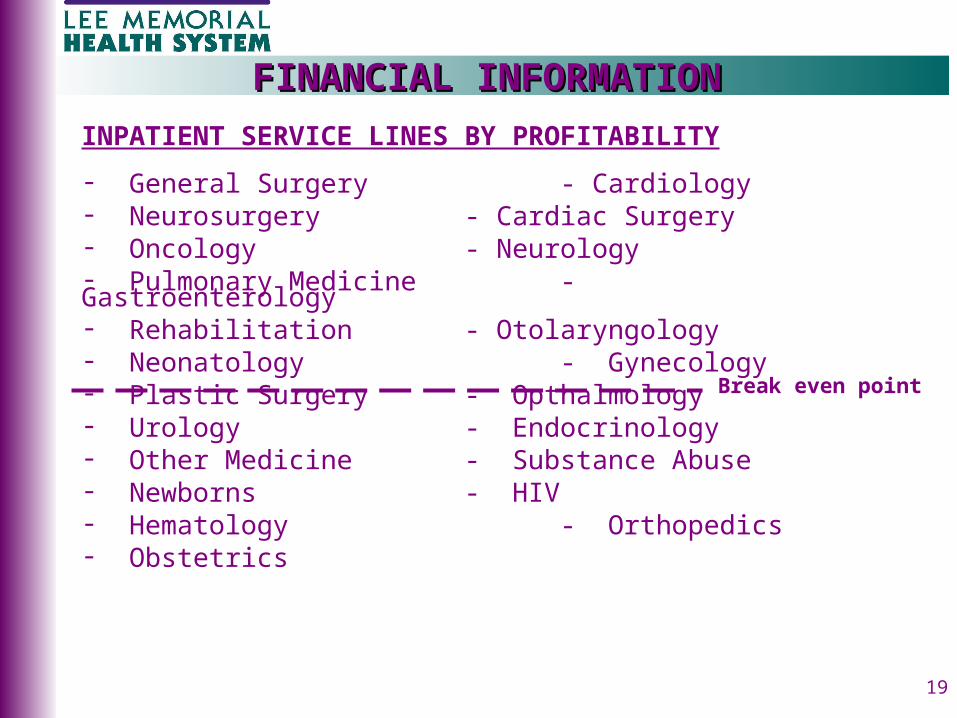
INPATIENT SERVICE LINES BY PROFITABILITY
- General Surgery - Cardiology- Neurosurgery - Cardiac Surgery- Oncology - Neurology- Pulmonary Medicine - Gastroenterology- Rehabilitation - Otolaryngology- Neonatology - Gynecology- Plastic Surgery - Opthalmology- Urology - Endocrinology- Other Medicine - Substance Abuse- Newborns - HIV- Hematology - Orthopedics- Obstetrics
Break even point
20
FINANCIAL INFORMATIONFINANCIAL INFORMATION
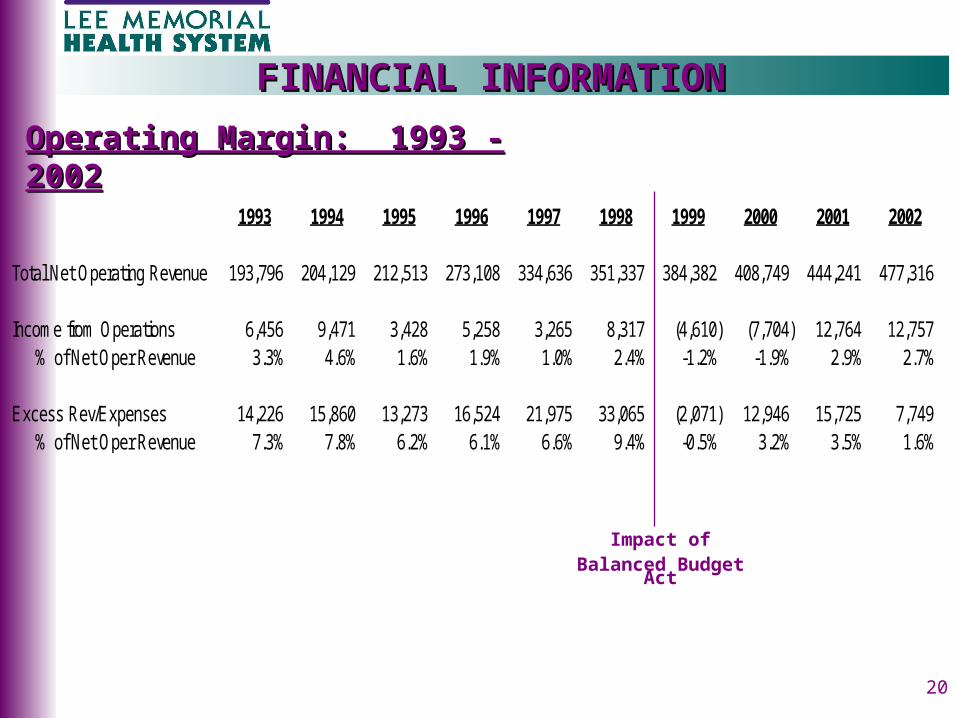
Operating Margin: 1993 - Operating Margin: 1993 - 20022002
1993 1994 1995 1996 1997 1998 1999 2000 2001 2002
Total Net Operating Revenue 193,796 204,129 212,513 273,108 334,636 351,337 384,382 408,749 444,241 477,316
Income from Operations 6,456 9,471 3,428 5,258 3,265 8,317 (4,610) (7,704) 12,764 12,757 % of Net Oper Revenue 3.3% 4.6% 1.6% 1.9% 1.0% 2.4% -1.2% -1.9% 2.9% 2.7%
Excess Rev/Expenses 14,226 15,860 13,273 16,524 21,975 33,065 (2,071) 12,946 15,725 7,749 % of Net Oper Revenue 7.3% 7.8% 6.2% 6.1% 6.6% 9.4% -0.5% 3.2% 3.5% 1.6%
Impact ofBalanced Budget
Act
21
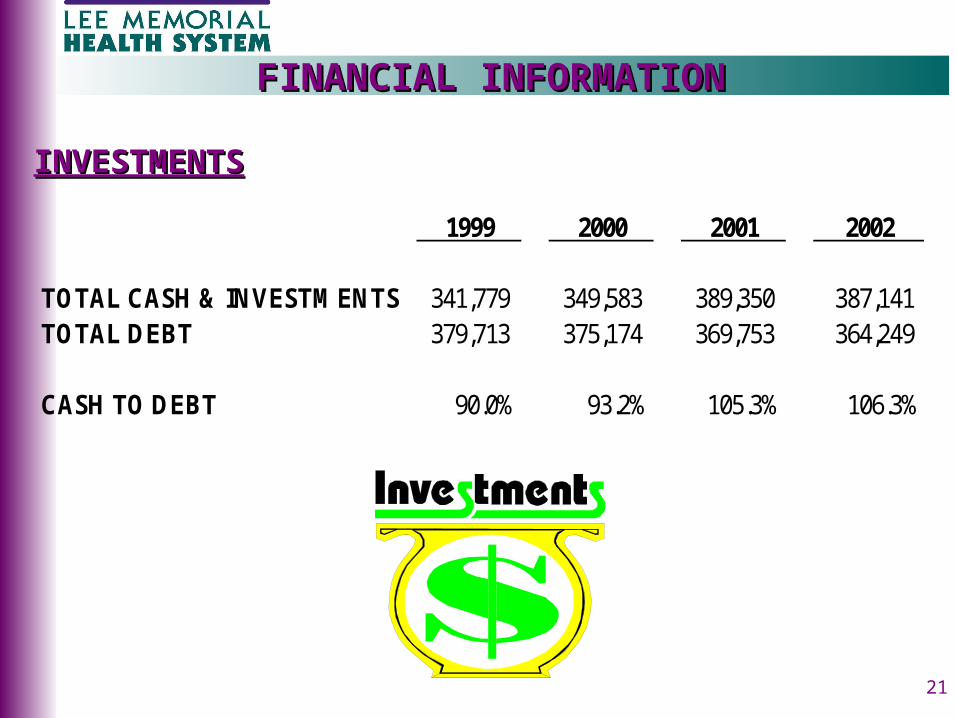
INVESTMENTSINVESTMENTS
1999 2000 2001 2002
TOTAL CASH & INVESTMENTS 341,779 349,583 389,350 387,141TOTAL DEBT 379,713 375,174 369,753 364,249
CASH TO DEBT 90.0% 93.2% 105.3% 106.3%
FINANCIAL INFORMATIONFINANCIAL INFORMATION
22
FINANCIAL INFORMATIONFINANCIAL INFORMATIONJOHN SITTIG - PARTNER, PRICE WATERHOUSE COOPERSJOHN SITTIG - PARTNER, PRICE WATERHOUSE COOPERS
• 16 years of public accounting experience dedicated solely to non-profit and public healthcare clients - Acute care hospitals - Nursing Homes - Home Health Agencies - Skilled nursing Facilities - Physician groups - Foundations
• Specializes in: - Reimbursement - Mergers and acquisitions - Revenue cycle projects - Corporate compliance - Bond financing
23
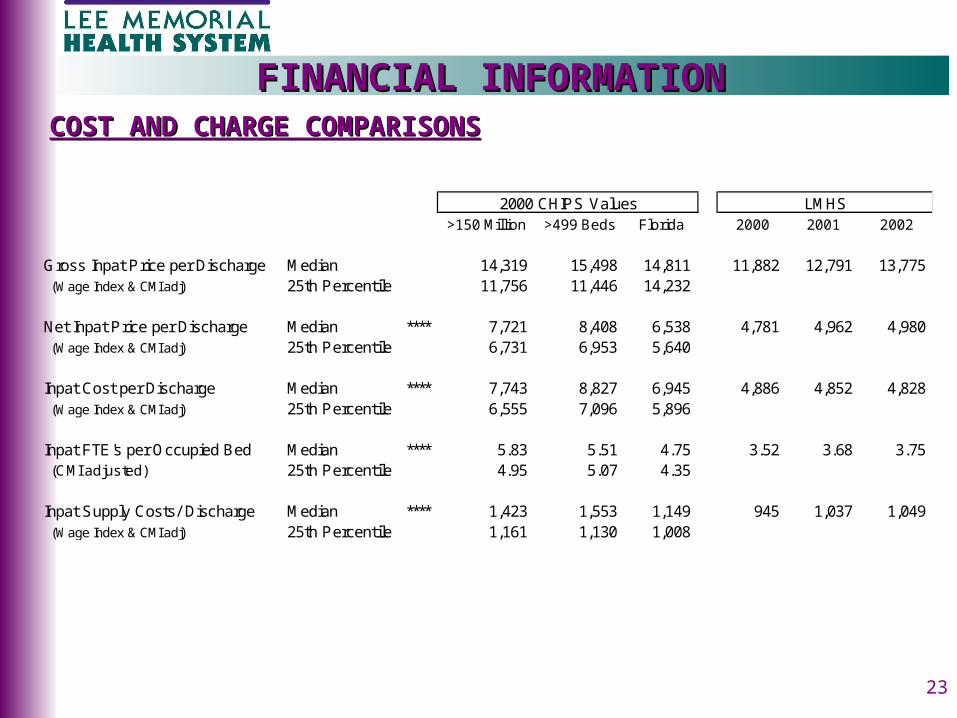
FINANCIAL INFORMATIONFINANCIAL INFORMATIONCOST AND CHARGE COMPARISONSCOST AND CHARGE COMPARISONS
>150 Million >499 Beds Florida 2000 2001 2002
Gross Inpat Price per Discharge Median 14,319 15,498 14,811 11,882 12,791 13,775 (Wage Index & CMI adj) 25th Percentile 11,756 11,446 14,232
Net Inpat Price per Discharge Median **** 7,721 8,408 6,538 4,781 4,962 4,980 (Wage Index & CMI adj) 25th Percentile 6,731 6,953 5,640
Inpat Cost per Discharge Median **** 7,743 8,827 6,945 4,886 4,852 4,828 (Wage Index & CMI adj) 25th Percentile 6,555 7,096 5,896
Inpat FTE's per Occupied Bed Median **** 5.83 5.51 4.75 3.52 3.68 3.75 (CMI adjusted) 25th Percentile 4.95 5.07 4.35
Inpat Supply Costs/ Discharge Median **** 1,423 1,553 1,149 945 1,037 1,049 (Wage Index & CMI adj) 25th Percentile 1,161 1,130 1,008
2000 CHIPS Values LMHS
24
FINANCIAL INFORMATIONFINANCIAL INFORMATIONJIM ANDREWS - V.P. GOLDMAN, SACHSJIM ANDREWS - V.P. GOLDMAN, SACHS
• 27 years of investment banking and healthcare financial consulting experience - Debt financing - Acquisitions and divestitures - Long-term capital plans • Clients include: - Adventist Health Systems/Sunbelt - CareAlliance Health - Mt. Sinai NYU Health - North Mississippi Health Services - Sentara Healthcare - Trinity Health Corporation - Vanderbilt University
25
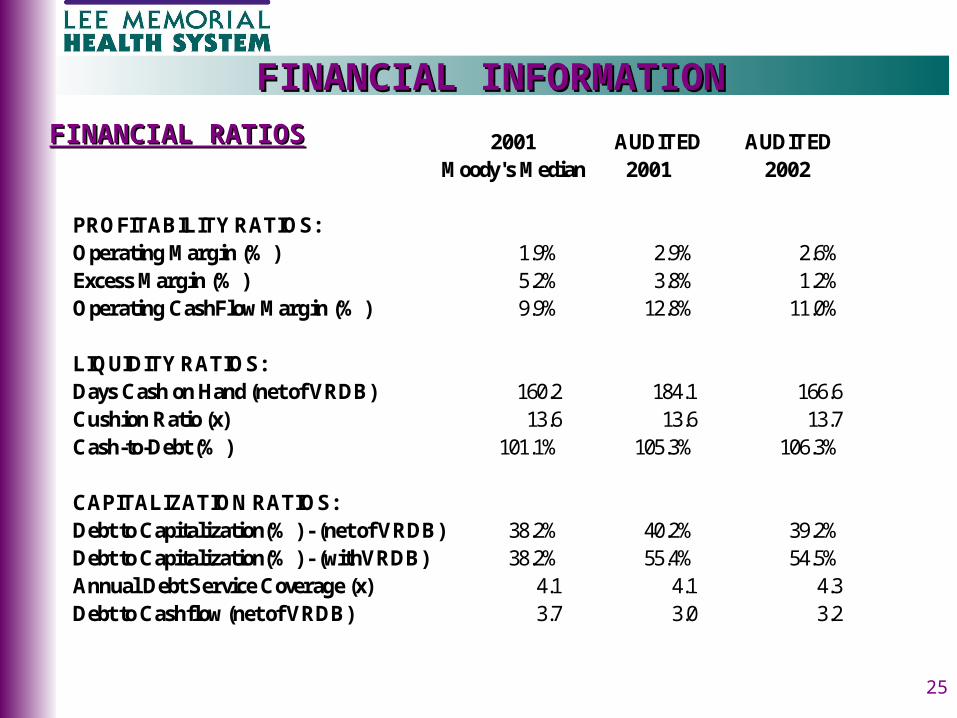
FINANCIAL RATIOSFINANCIAL RATIOS
FINANCIAL INFORMATIONFINANCIAL INFORMATION
2001 AUDITED AUDITEDMoody's Median 2001 2002
PROFITABILITY RATIOS:Operating Margin (% ) 1.9% 2.9% 2.6%Excess Margin (% ) 5.2% 3.8% 1.2%Operating CashFlow Margin (% ) 9.9% 12.8% 11.0%
LIQUIDITY RATIOS:Days Cash on Hand (net of VRDB) 160.2 184.1 166.6Cushion Ratio (x) 13.6 13.6 13.7Cash-to-Debt (% ) 101.1% 105.3% 106.3%
CAPITALIZATION RATIOS:Debt to Capitalization(% ) - (net of VRDB) 38.2% 40.2% 39.2%Debt to Capitalization(% ) - (withVRDB) 38.2% 55.4% 54.5%Annual Debt Service Coverage (x) 4.1 4.1 4.3Debt to Cashflow (net of VRDB) 3.7 3.0 3.2
26
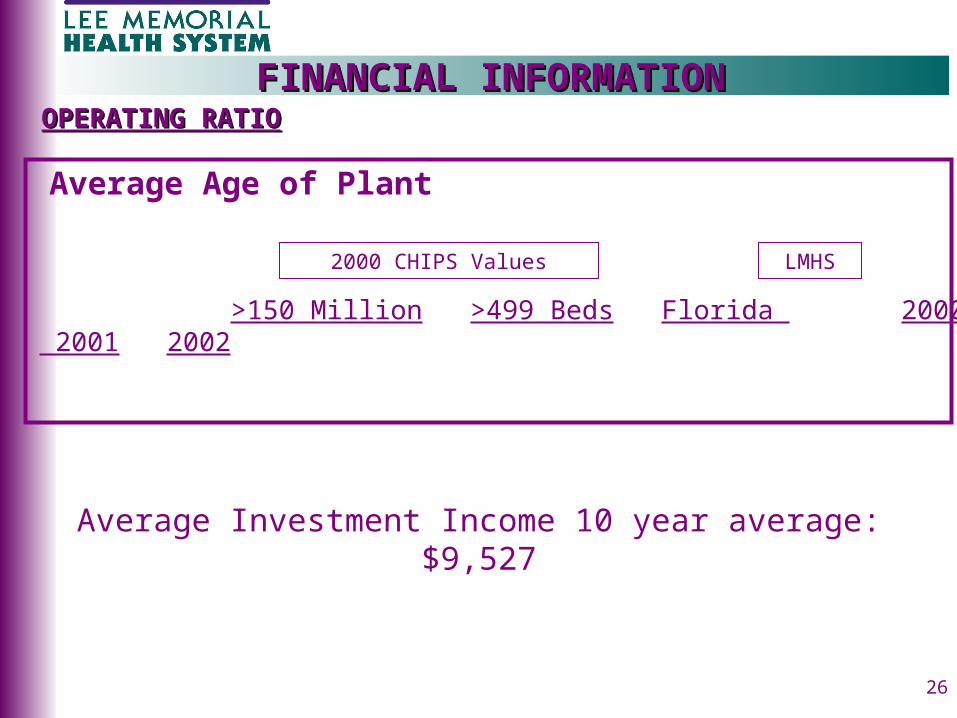
>150 Million >499 Beds Florida 2000 2001 2002
Median 9.03 9.40 7.53 7.94 9.57 9.69 25th Percentile 7.72 8.48 6.31
FINANCIAL INFORMATIONFINANCIAL INFORMATIONOPERATING RATIOOPERATING RATIO
2000 CHIPS Values LMHS
Average Age of Plant
Average Investment Income 10 year average: $9,527
27
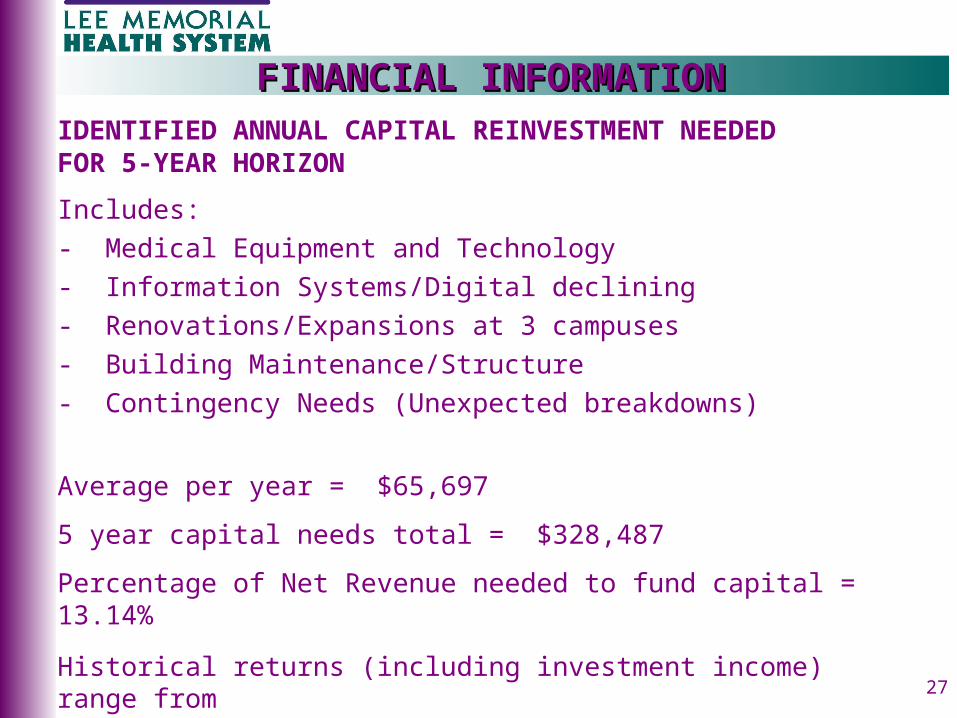
FINANCIAL INFORMATIONFINANCIAL INFORMATION
Includes:- Medical Equipment and Technology- Information Systems/Digital declining- Renovations/Expansions at 3 campuses- Building Maintenance/Structure- Contingency Needs (Unexpected breakdowns)
Average per year = $65,697
5 year capital needs total = $328,487
Percentage of Net Revenue needed to fund capital = 13.14%
Historical returns (including investment income) range from (-.5%) to 9.4%
IDENTIFIED ANNUAL CAPITAL REINVESTMENT NEEDEDFOR 5-YEAR HORIZON
28
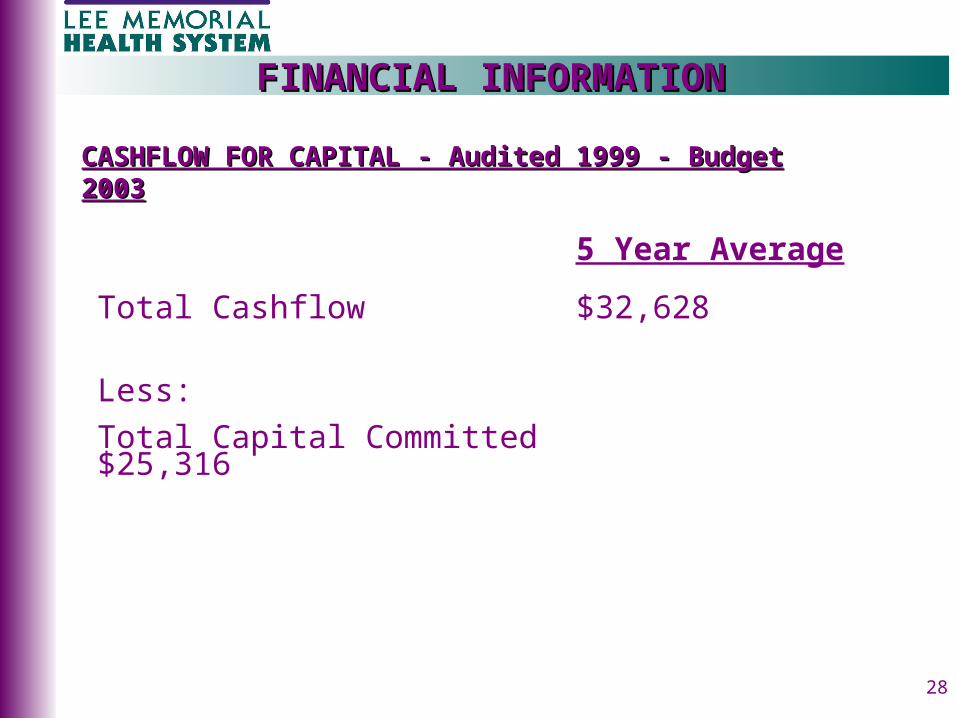
FINANCIAL INFORMATIONFINANCIAL INFORMATION
CASHFLOW FOR CAPITAL - Audited 1999 - Budget CASHFLOW FOR CAPITAL - Audited 1999 - Budget 20032003
5 Year Average
Total Cashflow $32,628
Less:
Total Capital Committed $25,316

29
• Insufficient cash from operations to meet capital needs
• Limited capacity to borrow more money
• Has LMHS maximized what it can from operations to fund capital? WE BELIEVE WE HAVE!
FINANCIAL INFORMATIONFINANCIAL INFORMATION
30
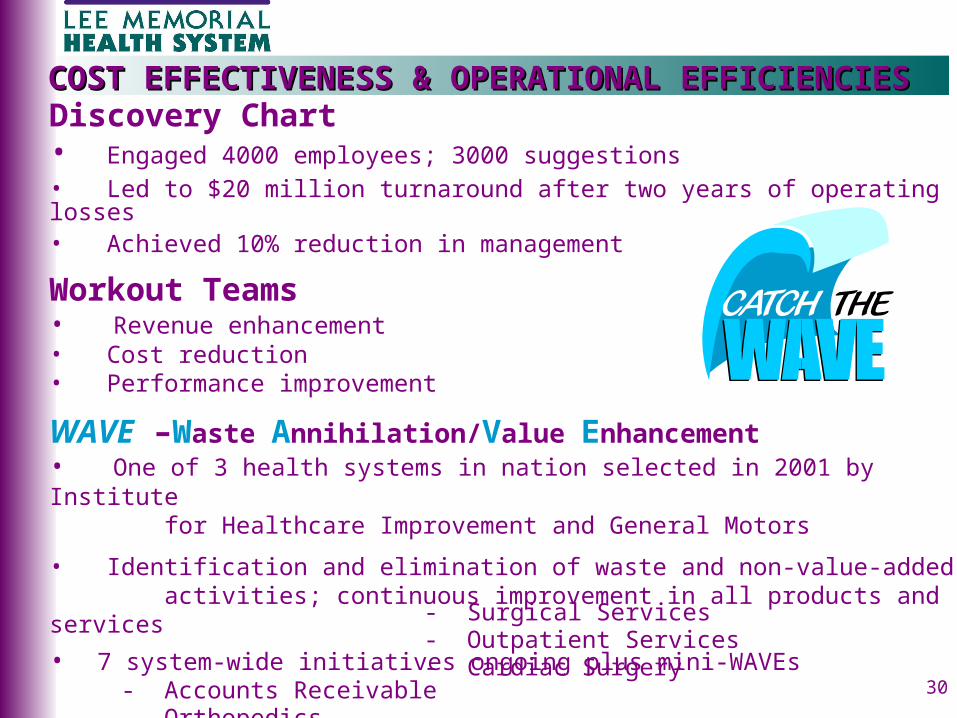
• Engaged 4000 employees; 3000 suggestions• Led to $20 million turnaround after two years of operating losses • Achieved 10% reduction in management
Workout Teams• Revenue enhancement• Cost reduction• Performance improvement
WAVE –Waste Annihilation/Value Enhancement• One of 3 health systems in nation selected in 2001 by Institute for Healthcare Improvement and General Motors
• Identification and elimination of waste and non-value-added activities; continuous improvement in all products and services
• 7 system-wide initiatives ongoing plus mini-WAVEs - Accounts Receivable - Orthopedics - Emergency Department - Medical Telemetry
Discovery ChartCOST EFFECTIVENESS & OPERATIONAL COST EFFECTIVENESS & OPERATIONAL
EFFICIENCIESEFFICIENCIES
- Surgical Services- Outpatient Services- Cardiac Surgery
31
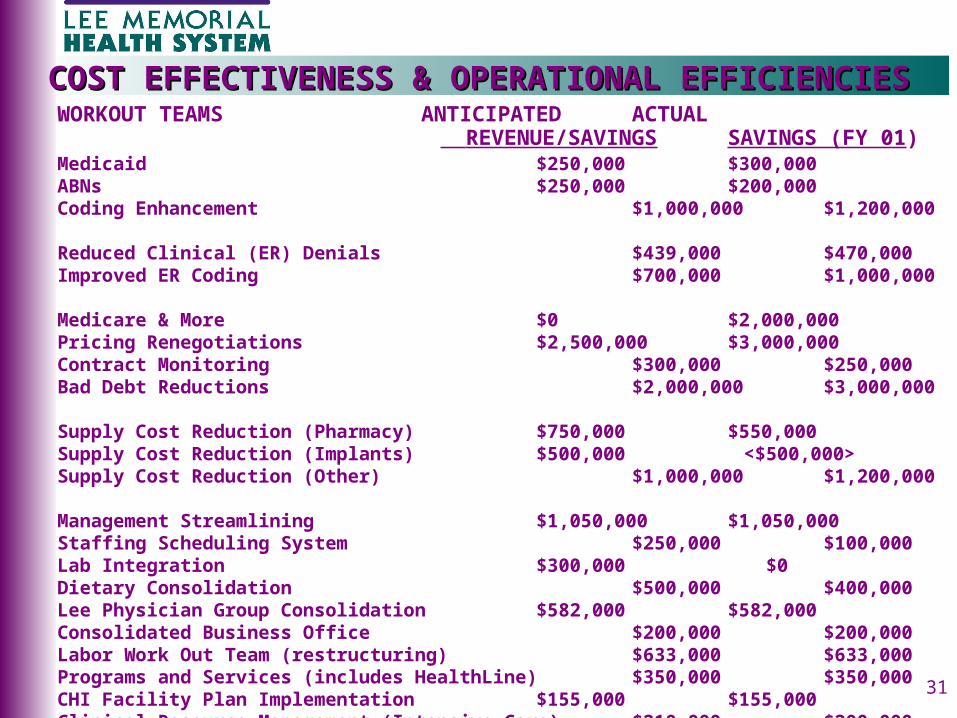
Medicaid $250,000 $300,000
ABNs $250,000 $200,000
Coding Enhancement $1,000,000 $1,200,000
Reduced Clinical (ER) Denials $439,000$470,000Improved ER Coding $700,000$1,000,000Medicare & More $0 $2,000,000Pricing Renegotiations $2,500,000 $3,000,000Contract Monitoring $300,000$250,000Bad Debt Reductions $2,000,000 $3,000,000
Supply Cost Reduction (Pharmacy) $750,000 $550,000
Supply Cost Reduction (Implants) $500,000 <$500,000>Supply Cost Reduction (Other) $1,000,000 $1,200,000
Management Streamlining $1,050,000 $1,050,000Staffing Scheduling System $250,000$100,000Lab Integration $300,000 $0Dietary Consolidation $500,000$400,000Lee Physician Group Consolidation $582,000 $582,000
Consolidated Business Office $200,000$200,000Labor Work Out Team (restructuring) $633,000$633,000Programs and Services (includes HealthLine) $350,000 $350,000
CHI Facility Plan Implementation $155,000 $155,000
Clinical Resource Management (Intensive Care) $210,000$200,000Clinical Resource Management (ER Rapid Response) $250,000$420,000
TOTAL (FY 2001) $14,169,000 $16,760,000
COST EFFECTIVENESS & OPERATIONAL COST EFFECTIVENESS & OPERATIONAL EFFICIENCIESEFFICIENCIESWORKOUT TEAMS ANTICIPATED ACTUAL
REVENUE/SAVINGS SAVINGS (FY 01)
32
Hospitalists• Designed to reduce length of stay• Improve ICU efficiency• Support unassigned patients
Institute for Healthcare Improvement(1 of 80 in the United States)
• Improve room turnover and bed availability by 25%• Reduce delays and waiting by 25%
COST EFFECTIVENESS & OPERATIONAL COST EFFECTIVENESS & OPERATIONAL EFFICIENCIESEFFICIENCIES
33
COST EFFECTIVENESS & OPERATIONAL COST EFFECTIVENESS & OPERATIONAL EFFICIENCIESEFFICIENCIES
National Nursing Services Magnet Recognition• Gold standard for nursing services • 64 hospitals out of 6000 have thus far achieved
Electronic Intensive Care Units (Visicu, Inc., Johns Hopkins)• Mortality (-25%)• Length of stay (-20%)• Average treatment cost per patient (-$2000)• Capital investment $2,800,000• Annual operating costs $2,200,000
National Quality Forum Safety Practices• Over 2/3s of identified best practices already implemented at LMHS
34
Cape Coral Hospital Acquisition• CCH lost $2 million per month for two years prior to LMHS acquisition 1996• Helped spread fixed costs; reduce management overhead• Under LMHS leadership, turned profit in eight months• Solidified market position LeeSar & Cooperative Services of Florida• In partnership with Sarasota Memorial Healthcare System• Centralized buying power, inventory control and distribution• Significant purchasing and distribution savings • Savings for FY 2002 $5.3 million• Savings since inception $30.54 million
COST EFFECTIVENESS & OPERATIONAL COST EFFECTIVENESS & OPERATIONAL EFFICIENCIESEFFICIENCIES
35
COST EFFECTIVENESS & OPERATIONAL COST EFFECTIVENESS & OPERATIONAL EFFICIENCIESEFFICIENCIES
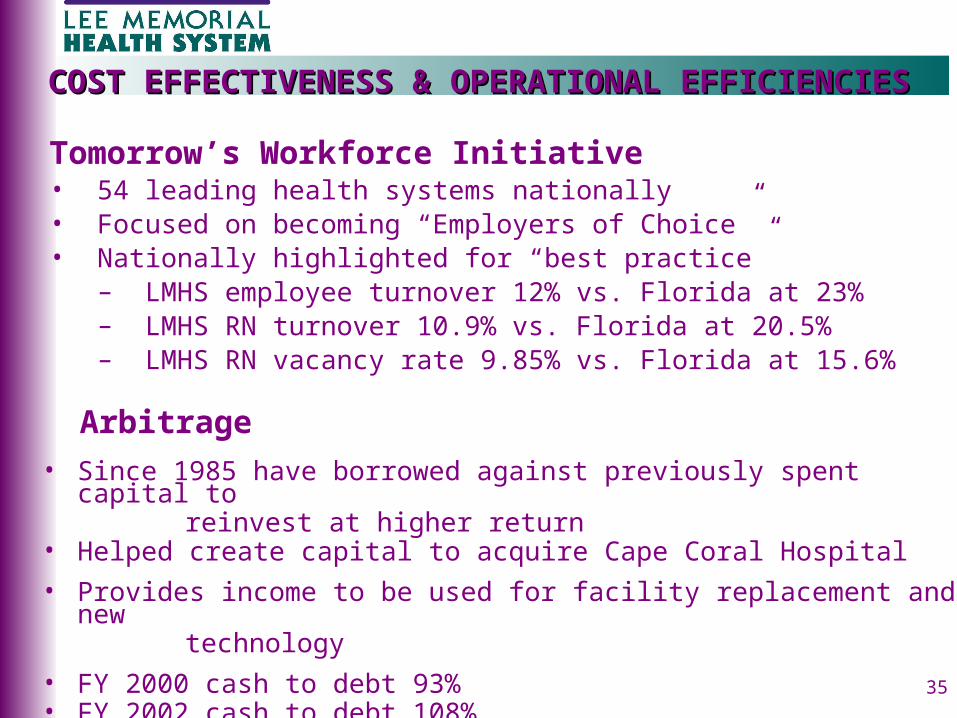
Tomorrow’s Workforce Initiative • 54 leading health systems nationally• Focused on becoming “Employers of Choice”• Nationally highlighted for “best practice”
– LMHS employee turnover 12% vs. Florida at 23%– LMHS RN turnover 10.9% vs. Florida at 20.5%– LMHS RN vacancy rate 9.85% vs. Florida at 15.6%
Arbitrage• Since 1985 have borrowed against previously spent capital to reinvest at higher return• Helped create capital to acquire Cape Coral Hospital• Provides income to be used for facility replacement and new technology• FY 2000 cash to debt 93%• FY 2002 cash to debt 108%
36
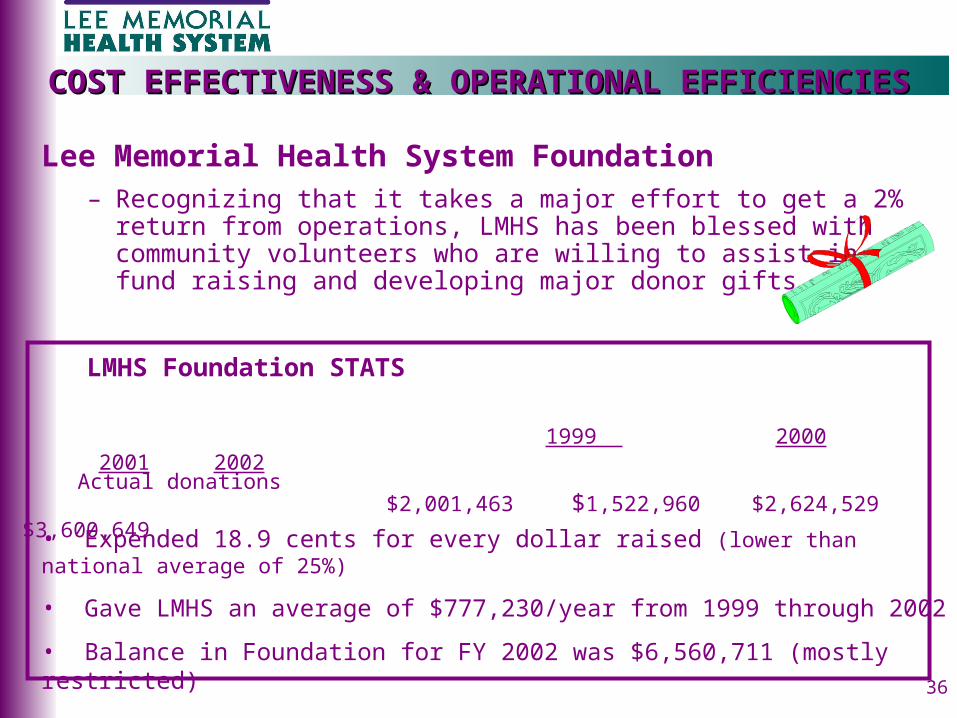
Lee Memorial Health System Foundation– Recognizing that it takes a major effort to get a 2% return
from operations, LMHS has been blessed with community volunteers who are willing to assist in fund raising and developing major donor gifts
LMHS Foundation STATS
1999 2000 2001 2002
$2,001,463 $1,522,960 $2,624,529 $3,600,649
Actual donations
• Expended 18.9 cents for every dollar raised (lower than national average of 25%)
• Gave LMHS an average of $777,230/year from 1999 through 2002
• Balance in Foundation for FY 2002 was $6,560,711 (mostly restricted)
COST EFFECTIVENESS & OPERATIONAL COST EFFECTIVENESS & OPERATIONAL EFFICIENCIESEFFICIENCIES
37
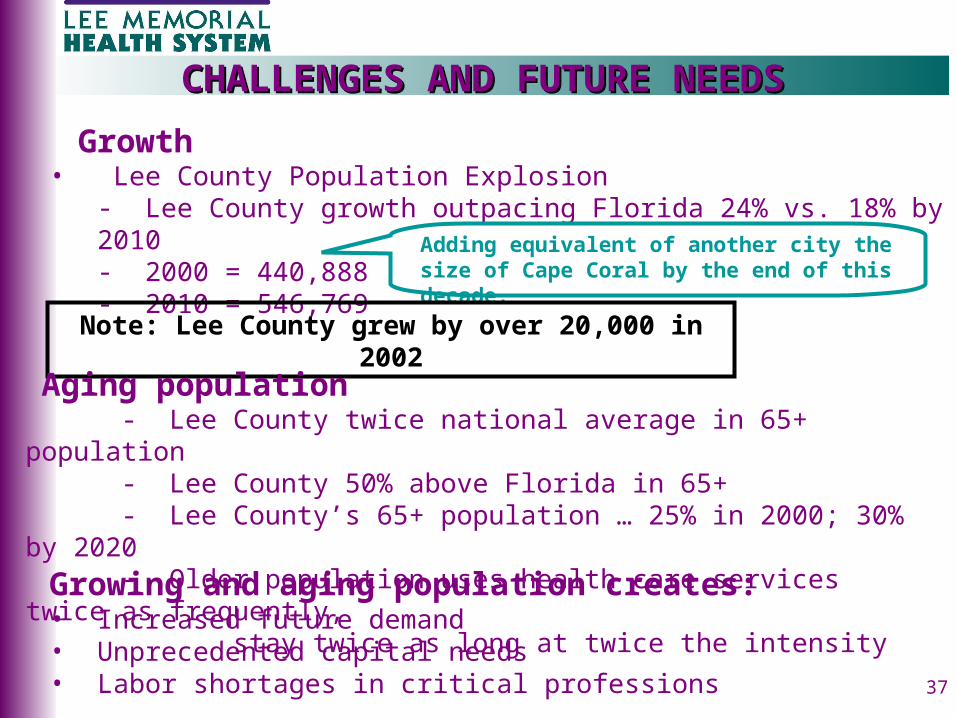
CHALLENGES AND FUTURE CHALLENGES AND FUTURE NEEDSNEEDS Growth
• Lee County Population Explosion- Lee County growth outpacing Florida 24% vs. 18% by 2010 - 2000 = 440,888- 2010 = 546,769
Growing and aging population creates:• Increased future demand• Unprecedented capital needs• Labor shortages in critical professions
Adding equivalent of another city the size of Cape Coral by the end of this decade.
Note: Lee County grew by over 20,000 in 2002
Aging population - Lee County twice national average in 65+ population
- Lee County 50% above Florida in 65+- Lee County’s 65+ population … 25% in 2000; 30% by
2020 - Older population uses health care services twice as frequently, stay twice as long at twice the intensity
38
CHALLENGES AND FUTURE CHALLENGES AND FUTURE NEEDSNEEDS
Conditions unfavorable to meeting future community needs
Uninsured increasing• 1993: 37 million uninsured• 2002: 43 million uninsured• 75%+: uninsured are employed• 21% of Floridians under age 65 are uninsured vs. national average of 16%
Underinsured increasing• Government(s) reducing coverage • Insurance rates increasing• Employers passing on greater insurance risk• Insurance companies leaving unprofitable markets
NUMBER OF INSURED
39
Conditions unfavorable to meeting future community needs (continued)
Payments• Dependent on fixed government reimbursement (Medicare, Medicaid)
• Managed care negotiate price discounts
• Increases in costs are more than payment increases
• Physician reimbursement declining - 2002 (declined 5.4%) - 2003 (declining 4.4%) - 2003-2006 (declining 18%)
CHALLENGES AND FUTURE CHALLENGES AND FUTURE NEEDSNEEDS
40
Conditions unfavorable to meeting future community needs (continued)
Operating Expenses Unregulated • While reimbursement relatively flat; expenses increasing at rapid rate• Labor: 4.5-6% annually (could easily be 10%)• Drugs: 16% per year (time lag on reimbursement)• Other supplies: 3.5 - 10%
–cardiac implants–orthopedic implants
• Technology • Insurance: malpractice/general liability • Bio-terrorism readiness
CHALLENGES AND FUTURE CHALLENGES AND FUTURE NEEDSNEEDS
41
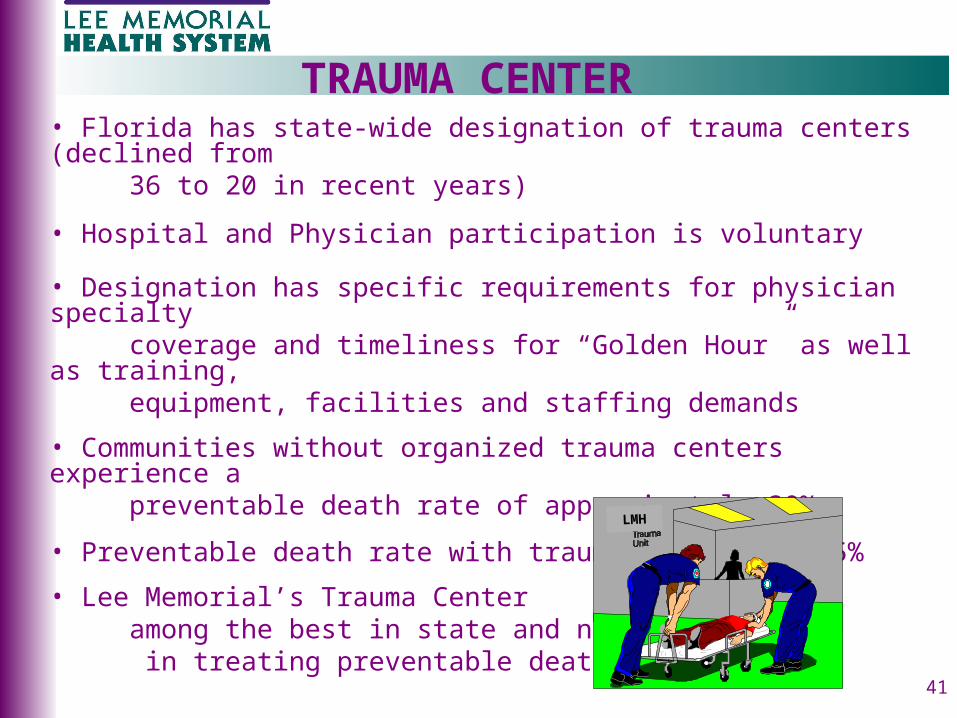
• Florida has state-wide designation of trauma centers (declined from 36 to 20 in recent years)
• Hospital and Physician participation is voluntary
• Designation has specific requirements for physician specialty coverage and timeliness for “Golden Hour” as well as training, equipment, facilities and staffing demands
• Communities without organized trauma centers experience a preventable death rate of approximately 30%
• Preventable death rate with trauma centers … 4-5%
• Lee Memorial’s Trauma Center among the best in state and nation in treating preventable deaths … 2%
TRAUMA CENTER
LMH
42
TRAUMA CENTER
Physician surgical specialties required for Trauma Center Designation:- Trauma surgeons - Emergency physicians- General Surgeons - OB/GYN physicians- Neurosurgery physicians - Ophthalmology physicians- Oral/Maxillofacial Surgeons - Hand Surgeons- Cardiac Surgeons - Orthopedic Surgeons- Plastic Surgeons - Thoracic Surgeons- Urology Surgeons - Otolaryngology Surgeons
Other physician specialties required for Trauma Center Designation:- Cardiac - Gastroenterology- Hematology - Infectious Disease- Internal Medicine - Nephrology- Pathology - Pulmonary Medicine
Trauma requires massive blood demands
43
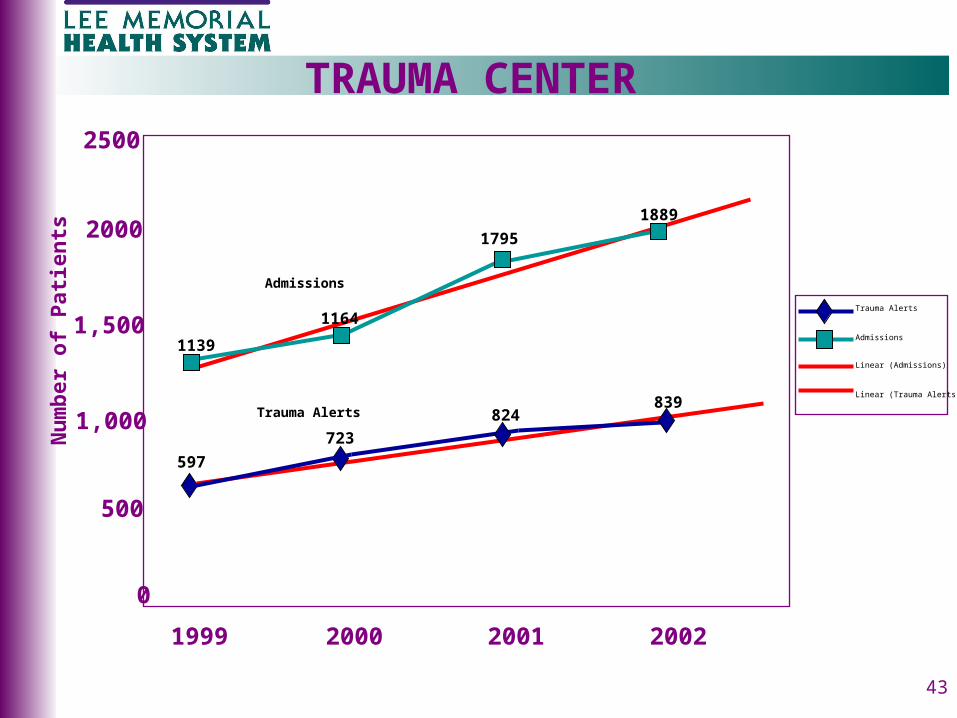
TRAUMA CENTER2500
0
2000
1,500
1,000
500
1999 2000 2001 2002
Trauma Alerts
Admissions
Admissions
Trauma Alerts
Linear (Admissions)
Linear (Trauma Alerts)
597
723824
839
1139
1164
1795
1889
Nu
mb
er
of
Pati
en
ts
44
TRAUMA CENTER
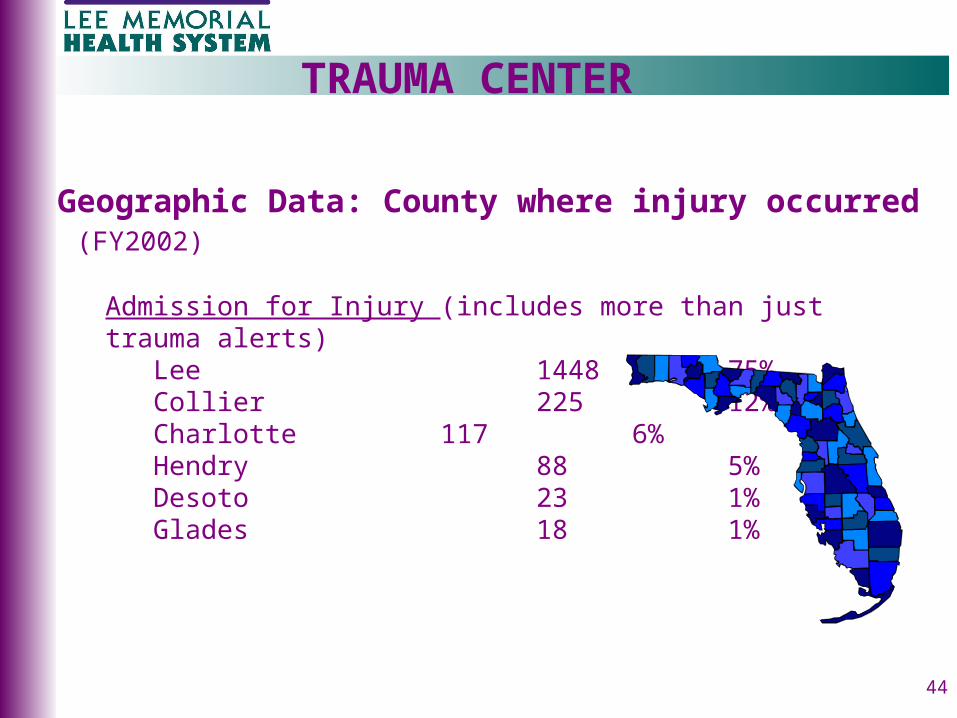
Geographic Data: County where injury occurred (FY2002)
Admission for Injury (includes more than just trauma alerts)Lee 1448 75%Collier 225 12%Charlotte 117 6%Hendry 88 5%Desoto 23 1%Glades 18 1%
45
TRAUMA CENTER
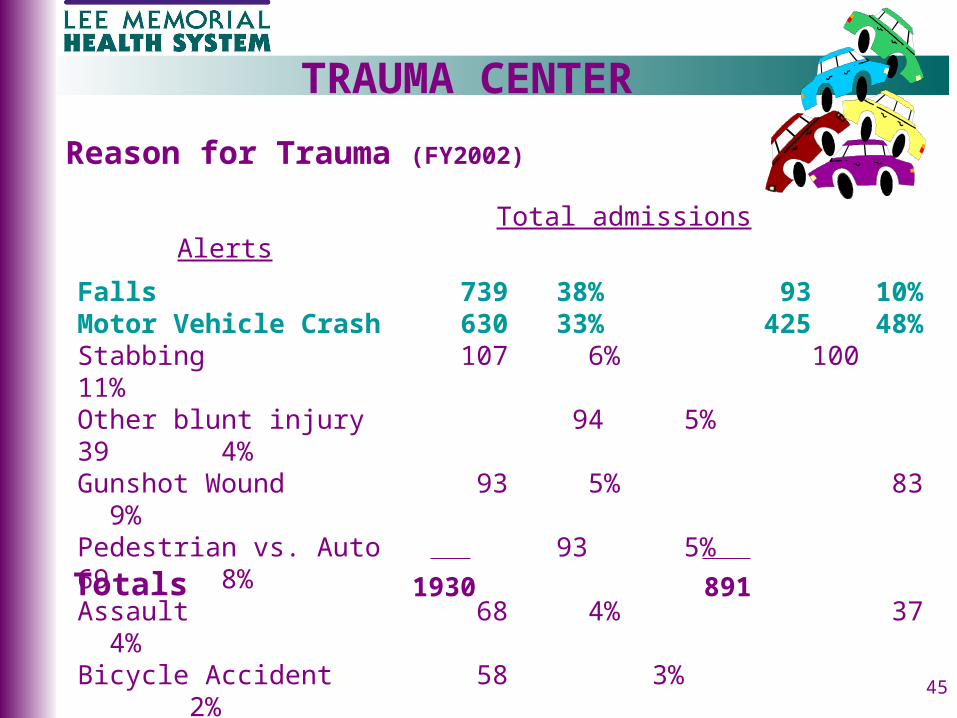
Reason for Trauma (FY2002)
Total admissions Alerts
Falls 739 38% 93 10%Motor Vehicle Crash 630 33% 425 48%Stabbing 107 6% 100 11%Other blunt injury 94 5% 39 4%Gunshot Wound 93 5% 83 9%Pedestrian vs. Auto 93 5% 69 8%Assault 68 4% 37 4%Bicycle Accident 58 3% 21 2%Other penetrating injury 48 2%Burns 24 3%
Totals 1930 891
46
Disruption to normal operations
• Trauma patients take precedence – emergency– diagnostic (CT, MRI, X-ray)– operating rooms– staff
- physician, patient and family frustration and clinical concerns
• Backlog of patients in the emergency department
• Capacity issues cause diversions to other facilities and delays in
available inpatient beds
• Staff frustration, burnout can result in transfers to less stressful environment
TRAUMA CENTER
47
Competition for physician support• Prolonged work hours; heavy workload• Complicated cases• Increased liability risk• Non-reimbursement• Recruitment and retention• Opportunity to choose other hospitals for active staff privileges - loss of neurosurgeons - loss of general surgeons
Cost factors• Low payment for services • Collection rate under 30%• Opportunity costs far exceed direct losses
TRAUMA CENTER
48
TRAUMA CENTER
Community Impact if Trauma Designation is Lost:• Destination protocols for EMS Transportation change to nearest facility
• Potential to create back logs and diversions in all Emergency Departments in Lee County
• No organized trauma support system
Short-Term Solutions (2003)
• LMHS committed $7 million for FY 2003
• County working to assist with $1.5 million
• Fundraising and other efforts - $1.5 million
Equaling $10 million
49
TRAUMA CENTER
Funding Needs:
Direct costs for operating trauma center $6,286,000
Reimbursement for private on-call physicians 2,820,000
Reimbursement for physician follow-up care 1,000,000
Total funding required $10,106,000
50
LMHS Recommendations to Legislative Delegation
• Create Lee County Trauma District
• Strengthen the Health Care Responsibility Act to assure out of county payments
• Amend or create statute that allows for sales tax to solely fund trauma services
• Pursue dedicated sources of funding – i.e. - surcharges on automobile licenses - expanded fees on DUI violations
• Strengthen Florida’s Good Samaritan Act and/or provide/expand limits of sovereign immunity to protect physicians and hospital emergency personnel
• Clarify laws between state and federal EMTALA lessening conflicts and confusion
• Expand health insurance coverage to reduce the number of uninsured
TRAUMA CENTER
51
• Credible
• Committed to our community and quality patient care
• Committed to our employees/volunteers
• Currently financially stable
• Attempting to effectively plan for medical needs of a growing and aging population
• Attempting to protect the future of an excellent Trauma Center with a long-term solution rather than a band-aid approach
CONCLUSIONCONCLUSION
Lee Memorial Health System is: