Embed Size (px)
Citation preview
1
"Life and the Sciences of Complexity" Iberall
Distinguished Lecture Series
Douglas R. WhiteDecember 5, 2008
Social physics: Networks & causal chains (emergent causality in network cohesion)
C:\Documents and Settings\User\My Documents\pub\SocialPhysics
2
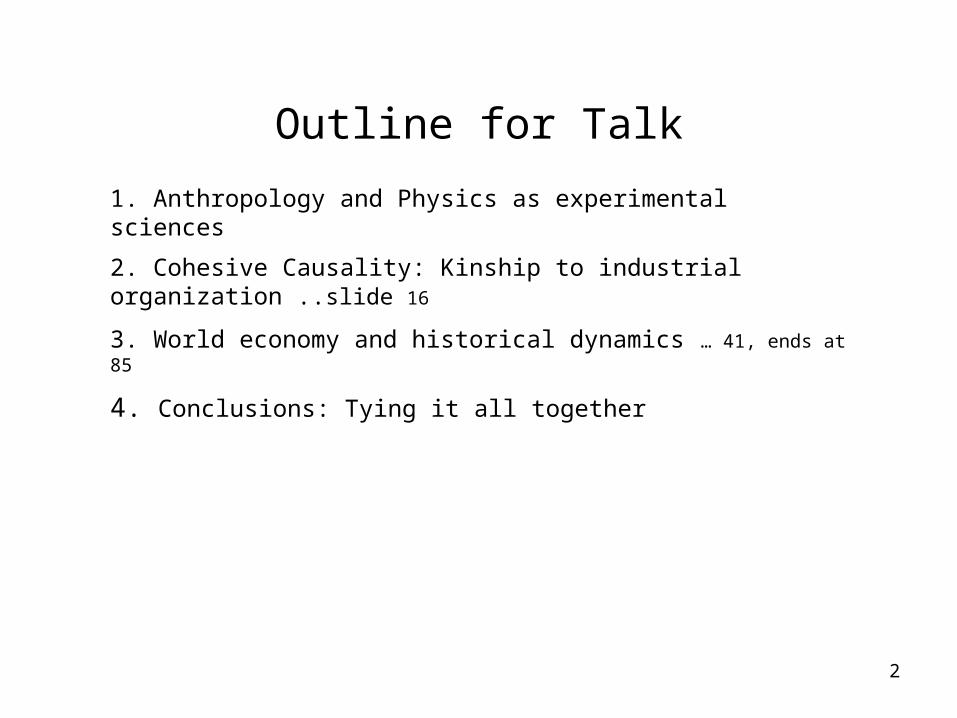
Outline for Talk
1. Anthropology and Physics as experimental sciences
2. Cohesive Causality: Kinship to industrial organization ..slide 16
3. World economy and historical dynamics … 41, ends at 85
4. Conclusions: Tying it all together
3
Anthropology as an experimental science
• Anthropologists are the experimentalists of the social sciences.
• They gather meticulous data (ethnography)
• About 40% of the best ethnography adds a time dimension (the rest are “idealized” static structures). Iberall’s advice: you have to do your case studies through time (and study process, i.e., dynamics).
• Using the temporal access, the dynamics of social processes can be studied in all of its “compartments.”
• I followed his advice.
4
Anthropology as diachronic/policy science
• I followed that advice by teaming up with one of the best time-series projects in Africa, one that did before-after studies of the impact of relocation of 100,000+ people with building the Kariba Dam in Zambia
• Rather than changes from one “static” state to another, their blanket ethnography, every 2-3 years, showed new emergents and massive changes in everyone of a dozen of these short time period, and no emergent stability.
• Their study “informed” World Bank and IMF policy on resettlement projects: contrary to economists’ views, people were not “open” to innovation after resettlement, they were instead oriented more conservatively toward reestablishing their life-ways, which took about four years, after which they were more open to innovation.
• (By that time economists would have implemented their plan, failed, and tried to erase the tracks of their failures, which are nonetheless in the documentary records of development programs).
5
Cohesive emergence in the sciences• Given atomisms interacting at one “level” of study that are
made up of smaller atomists at a finer scale, interacting to form the larger units, it is not experimentally proven that the relation among levels is strictly hierarchical. Thus no strict “vertical reduction” principle of explanation in the sciences. Explanations do not apply as hierarchical reductionism but laterally. In complex systems, through memory, storage bins, interactions, cohesive emergence of atomisms, how atomisms are built, with cohesion linked to stability.
• This observation has two consequences: (1) a key measure of complexity is the extent to which at any level the interaction of entities is subject to time-lagged effects internal to their atomisms that resurface to alter their interactions (bins, processes and memory). (THAT COMPLEXITY WILL BE IN EVIDENCE IN THE COHESIVE GROUPS WE STUDY)
6
The Lateral principles of science
• Consequence (2): general principles do not apply so much vertically (hierarchical reductionism) but laterally. Phil Anderson agreed as do many physicists today.
• Iberall viewed the study of processes at any level as “chains of causality.” These form networks. Networks don’t simply link elements. They form cohesive units that represent emergence of a higher out of a lower level of atomisms.
• Interactions leading to emergent cohesion of atomisms at one scale may produce atomisms at a larger scale.
7
The Network principles of science• Iberall and I had in common a view of atomisms
and networks at all these non-strictly hierarchical levels. My “networks of processes” are his “chains of causality” but they take a different shape with cohesive units.
• In the past four decades, especially the last, the “network sciences” have become a lingua franca of experimental science (simulation & observational) in physical, chemical, biological, social, economic & now, anthropological and political sciences. Emergent causality has yet to be fully incorporated into the network sciences.
8
What are atomisms?
• At any level of study, the atomisms are the entities that persist so as to interact at some time scale (“asts”), so as to produce effects. The very concept of atomism is linked to causality as observable effects asts.
• Entities that persist so as to interact => interact to persist must have the two key properties of cohesion: (1) resistance to destruction (asts) by external shocks and (2) interactions among their components (internal bonds) that not only resist destruction but that facilitate the coordinations that enable persistence and activity (asts) that produce external effects – thru cohesion.
9
So what are the “cohesive units” of networks?
Iberall convinced me that networks don’t just link elements (lacking strictly bounded units larger than a single node) but that there are cohesive units within networks.
Investigating this possibility led me to an unusual idea of how groups are constituted in networks.
The idea is based on a fundamental formalism of network and graph theory that defines the boundaries of cohesion. (e.g., Harary 1969)
10
Structural k-cohesion: a fundamental definition
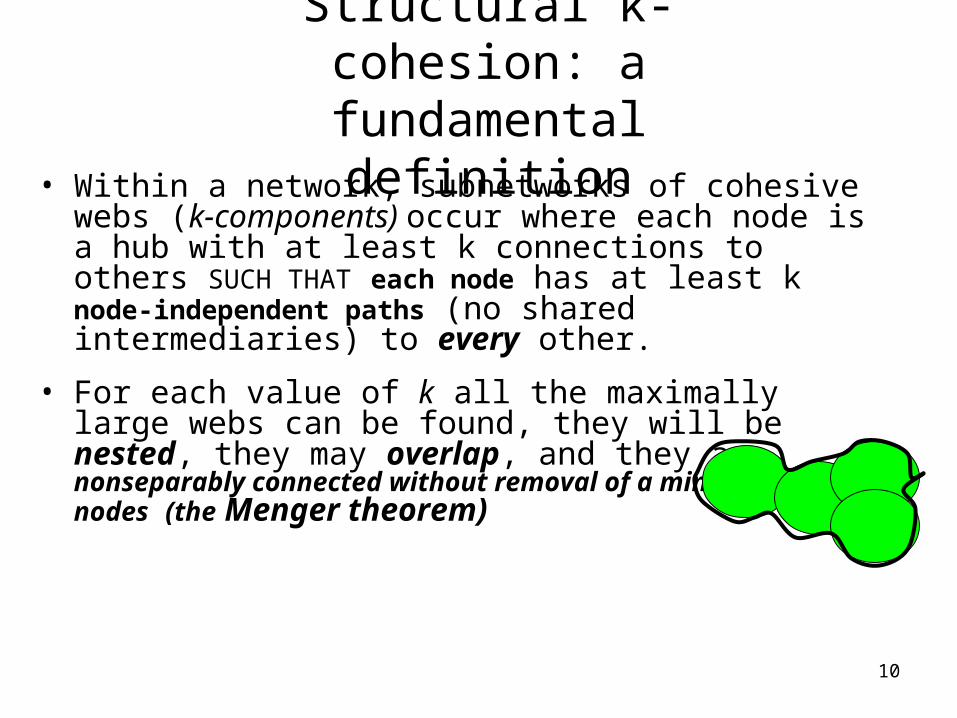
• Within a network, subnetworks of cohesive webs (k-components) occur where each node is a hub with at least k connections to others SUCH THAT each node has at least k node-independent paths (no shared intermediaries) to every other.
• For each value of k all the maximally large webs can be found, they will be nested, they may overlap, and they are nonseparably connected without removal of a minimum of k nodes (the Menger theorem)
11
A science of cohesion & causality
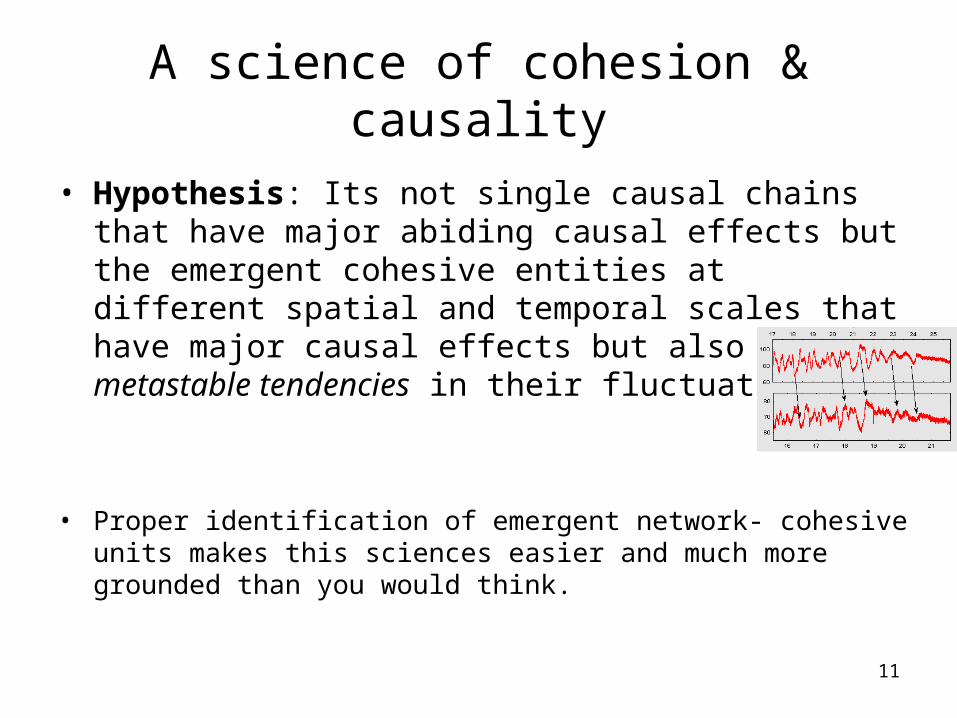
• Hypothesis: Its not single causal chains that have major abiding causal effects but the emergent cohesive entities at different spatial and temporal scales that have major causal effects but also metastable tendencies in their fluctuations.
• Proper identification of emergent network- cohesive units makes this sciences easier and much more grounded than you would think.
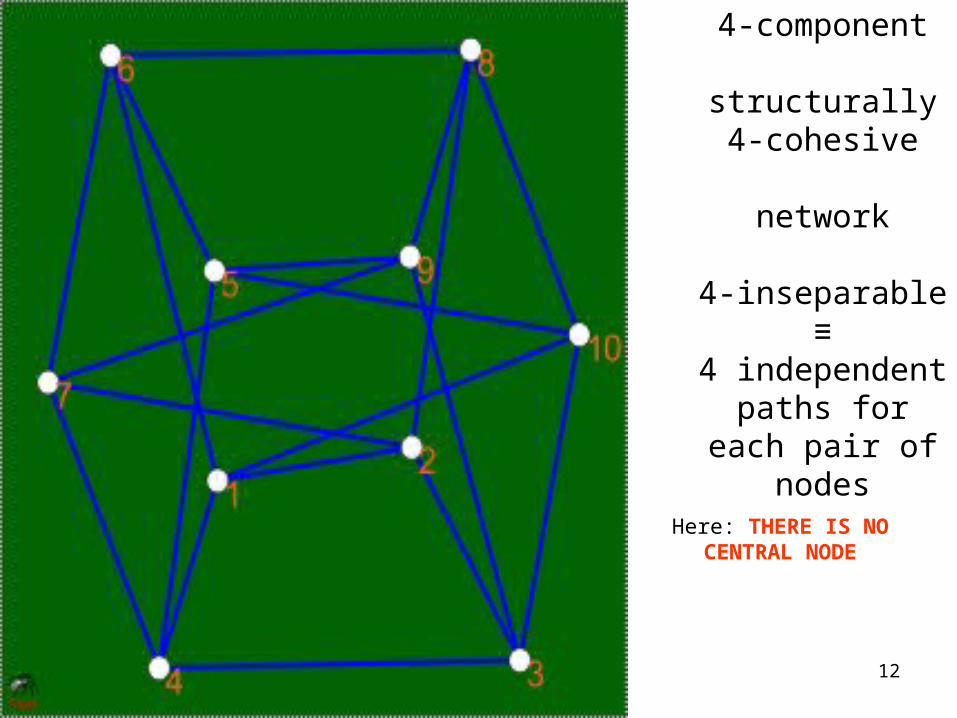
12
4-component
structurally 4-cohesive
network
4-inseparable≡
4 independent paths for each pair of nodes
Here: THERE IS NO CENTRAL NODE
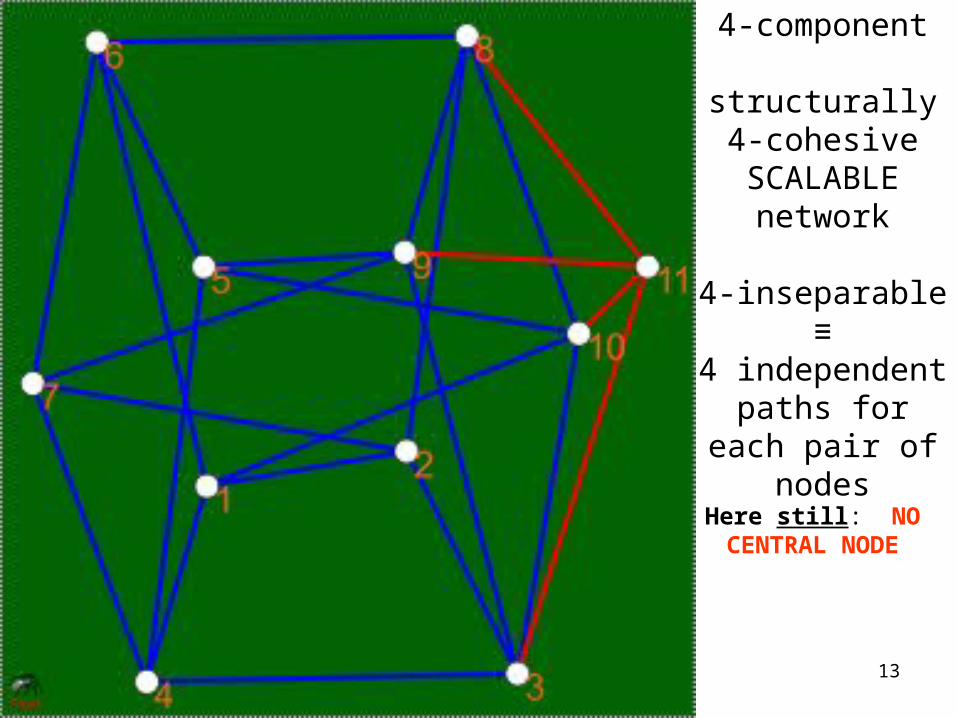
13
Here still: NO CENTRAL NODE
4-component
structurally 4-cohesive
SCALABLEnetwork
4-inseparable≡
4 independent paths for each pair of nodes
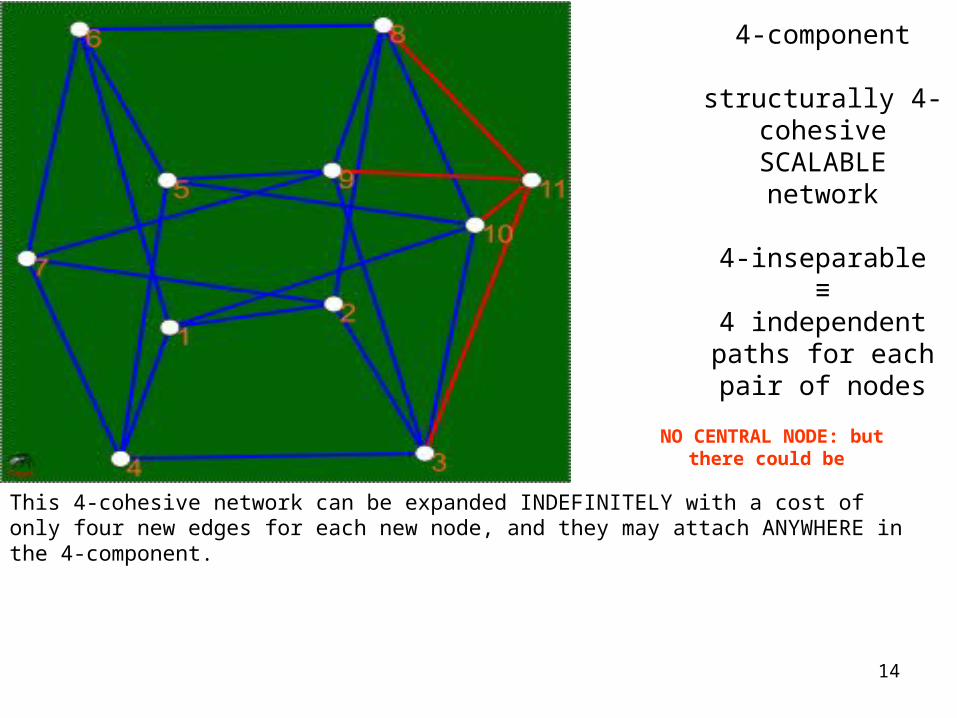
14
4-component
structurally 4-cohesive
SCALABLEnetwork
4-inseparable≡
4 independent paths for each pair of nodes
This 4-cohesive network can be expanded INDEFINITELY with a cost of only four new edges for each new node, and they may attach ANYWHERE in the 4-component.
NO CENTRAL NODE: but there could be
15
Metaphors for the new science
• Intuitive models for network-cohesive units in this new science are (1) Bucky Fuller’s geodesic domes with many elements cohesively connected (2) Art Iberall’s spacesuit design with the stable points of bodily dynamics linked by a flexible web.
• I am going to run quickly through 50! slides for a series of examples of causal impacts of structural cohesion that give the core ideas of how this science applies everywhere, with myriad applications.
16
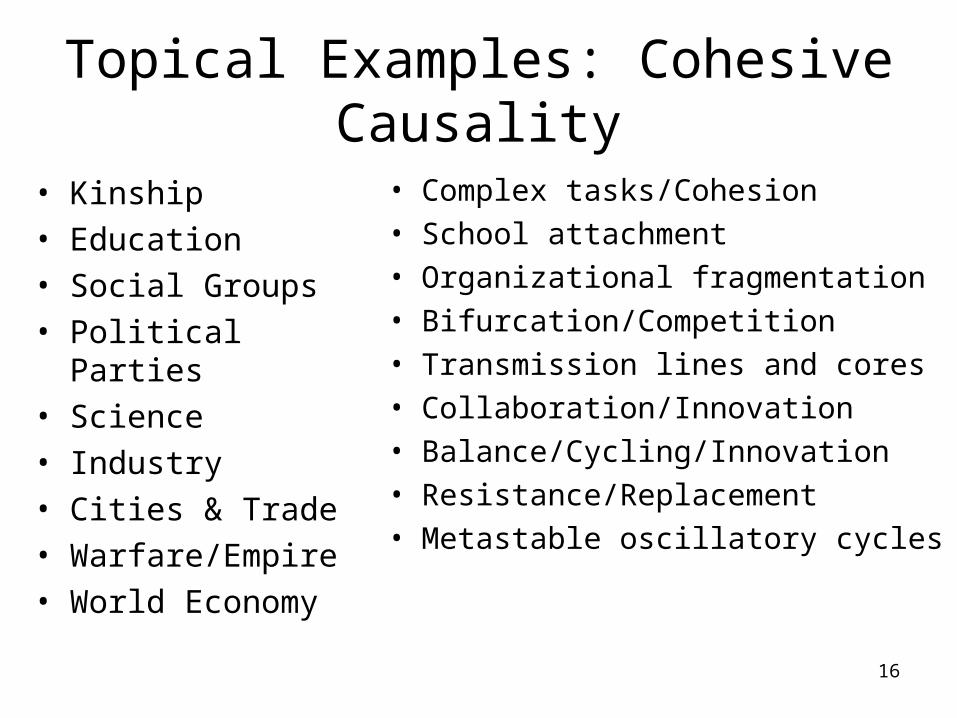
Topical Examples: Cohesive Causality
• Kinship• Education• Social Groups• Political Parties• Science• Industry• Cities & Trade• Warfare/Empire• World Economy
• Complex tasks/Cohesion• School attachment• Organizational fragmentation• Bifurcation/Competition• Transmission lines and cores• Collaboration/Innovation• Balance/Cycling/Innovation• Resistance/Replacement• Metastable oscillatory cycles
17
These k-cohesive “units” define scalable human groups
Since k-cohesion in a network with n nodes requires only a constant number of ties (k) per person, a k-cohesive group can expand indefinitely at a constant cost per person. This entails that k-cohesive groups are scalable, that is, they are able to scale-up in number or grow indefinitely without extra costs per person. The growth of cohesive ethnicities plays a fundamental role in historical dynamics.
The minimum benefit b of independent cycles per person is nearly constant (b < (k-1)/2) while the non-independent cycles per person grow exponentially, offsetting the effects of distance. Excess in m links above the minimum k*n/2 for k-cohesion can provide centralization, additional local cohesion, etcetera.
18
These units of human groups are our informal superatomistic
organizations Normally we think of “groups” as necessarily having leaders, names, lists of members known to each other through communications from central to peripheral members or through face-to-face meetings. Sociologists since Durkheim have a conception of a social ”group” as having an implicit charter and constitution, a kind of corporation, analogous to the idea of a formal organization. Structural cohesion is a more generic idea of a group more on the model of a community, where people may be multiply and densely connected, operating as organizations but informally, and scaling up even to ethnicities and their inclusions in the lesser cohesive nationalities.
19
with effective causality and agency
• I am not saying that structurally cohesive groups (of kin, in schools, organizations, politics, science, industry, etc.) have the agency and decision-making analogous to individuals (clearly ethnicities do not, tho nationalities as national governments do). But structurally k-cohesive groups do have k times greater efficacy to do so with k-times the potential :
• 1) for internal group coordination through mutual influence and communication
• 2) for external causality, whether through agency or unintended effects
• 3) to operate as organizations, even without central leadership.
20
So what are the “units” of human groups? The nested atomistic
levels? So a more general idea of a group, more on the model of a community core can be based on the formalism of k-cohesion, where people are not only more densely connected but all pairs of members are k-cohesive with one another. This definition does not require that the group is named, with a formal organizational charter or membership, but implies the capacity for a level k of intensity of redundancy in communication and resistance to disconnection.
Nesting of cohesive groups occurs by virtue of intensity: a group where all pairs have connection intensity k are a subgroup of those with intensity k-1. These groups are not just named entities but have interaction intensities.
21
The “units” of human groups and nested atomistic levels
In kinship and other networks, there are entities that we can identify as “groups” because they are cohesive, they coordinate their actions, have divisions of labor, and may carry distinctive recognizable markers, including self-recognition and identity.
Cohesive groups of this sort may define community, social class, ethnicities, the stable cohesive local subgroups of populations as distinct from migrants.
22
(2a) Cohesion in kinship networks as constituents of
human societiesA. What are the atomisms of human kinship? Persons, couples creating children and reproduction, and larger cohesive units (superatomisms) of social coordination multiply connected through marriage.
B. This opens the study of cohesive kinship units and of the constituents of these units that lend cohesion.
C. A key question concerns their mutually causal correlates
23
Kinship and cohesion: examples of mutual causality or causal
effects• Kinship cohesion and Social Class in an
Austrian farming community• Heirship/Structural endogamy R2>>.29(.9?)
– (Structural Endogamy – Social Class elsewhere?)
• Kinship cohesion and Stayers/Leavers in a Turkish Nomad clan
• Stayers/Structural endogamy R2 =.90
• Cohesive sidedness for Garo Moieties, – 23 cycles, R2 =1.0 p<.00001
24
The stacking of kinship atomisms and their nested levels
Persons–&–couples creating children & reproduction
The larger units of social cohesion/coordination (superatomisms) created by coupling or marriage
bicomponents (cohesive linkages) that may define community, ethnicity, emergent from networking.
To observe this stacking of atomisms we create an appropriate formalism that includes such ideas as larger units that have cohesion because of redundant linkages, like multiple overlapping social circles.
25
How to “see” the atomisms of human kinship at nested atomistic
levels? The network formalism that is needed identifies distinct levels with distinct types of units: persons, couples, families and cohesive clusters of families and groups like those that self-identify by descent or intermarriage.
It allows us to see how units at a smaller scale are embedded in those of a higher level. If we take P to denote the Parental ties that form into kinship networks, we can name the formalisms as P-systems, graphs of networks where graphs for relations among atomists can contain other graphs.
26
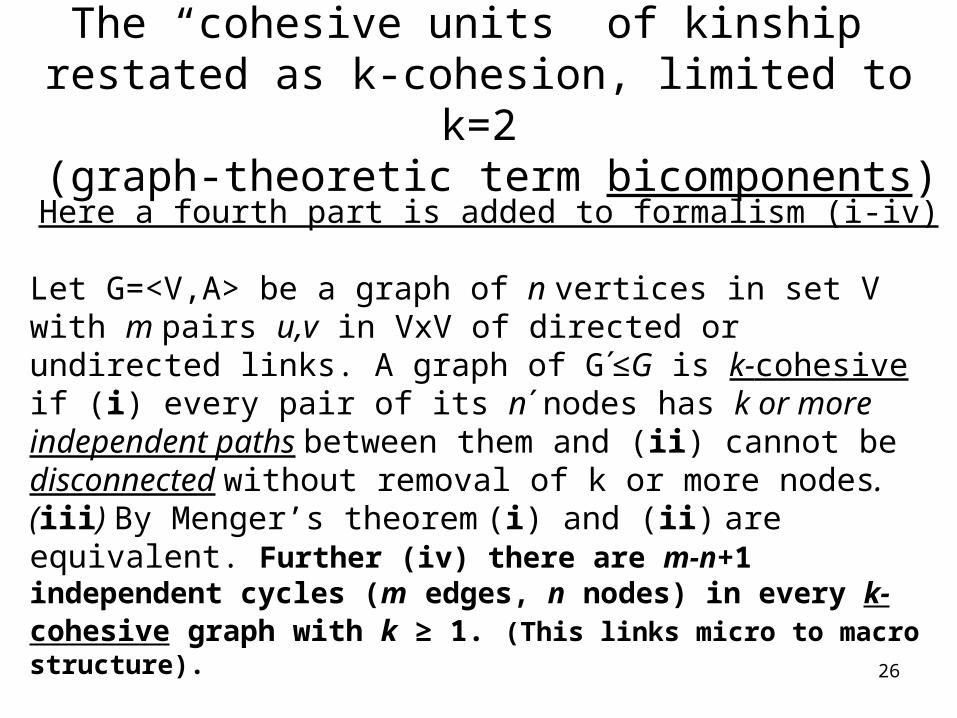
The “cohesive units” of kinship restated as k-cohesion, limited to k=2 (graph-theoretic term bicomponents)
Here a fourth part is added to formalism (i-iv)
Let G=<V,A> be a graph of n vertices in set V with m pairs u,v in VxV of directed or undirected links. A graph of G΄≤G is k-cohesive if (i) every pair of its n΄ nodes has k or more independent paths between them and (ii) cannot be disconnected without removal of k or more nodes. (iii) By Menger’s theorem (i) and (ii) are equivalent. Further (iv) there are m-n+1 independent cycles (m edges, n nodes) in every k-cohesive graph with k ≥ 1. (This links micro to macro structure).
27
Capturing the “units” and nested atomistic levels of human kinship
The idea of the P-system formalism is to capture overlapping cycles in (micro-structure of marriage) to find the boundaries of 2-cohesive (bi)components (macro-structure) of kinship networks. In these bicomponents, every person or couple is linked by at least 2 independent paths (marriage circles) that overlap to form in larger cohesive subsets of structural endogamy as a special case of structural 2-cohesion (k-cohesion with k=2).
28
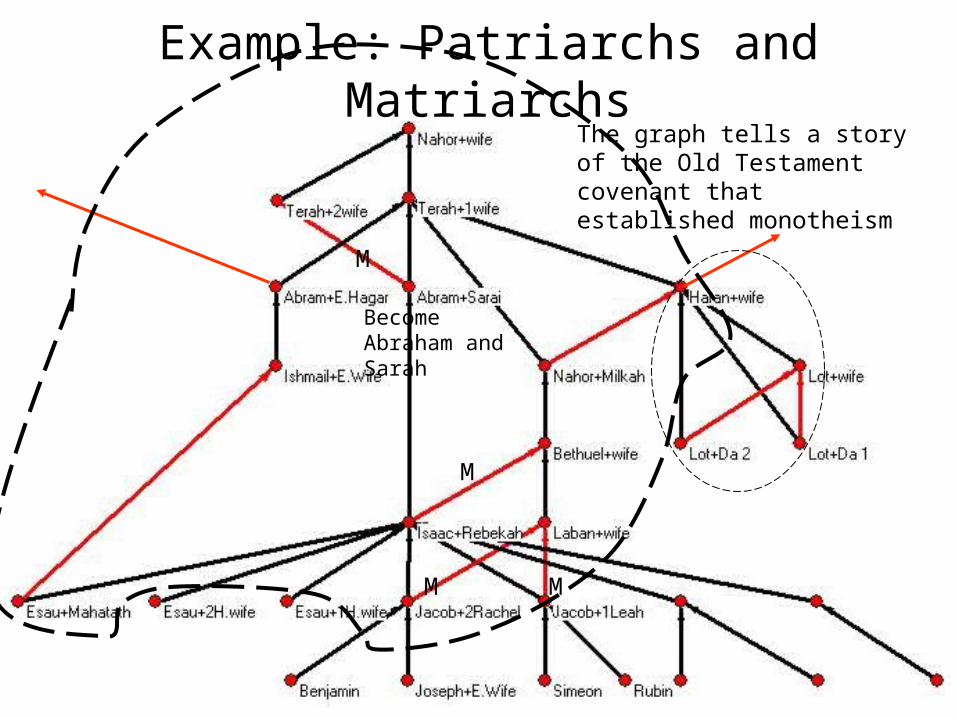
Example: Patriarchs and Matriarchs
M
M M
M
The graph tells a story of the Old Testament covenant that established monotheism
Become Abraham and Sarah
29
14. We look next at Arabized Turkish Nomads, similar in structure to the Canaanites, and show how a similar
concrete implicate order of structural endogamy applies to how lineages are linked into clans, and consequences for those who stay and those who
leave the clan.
30
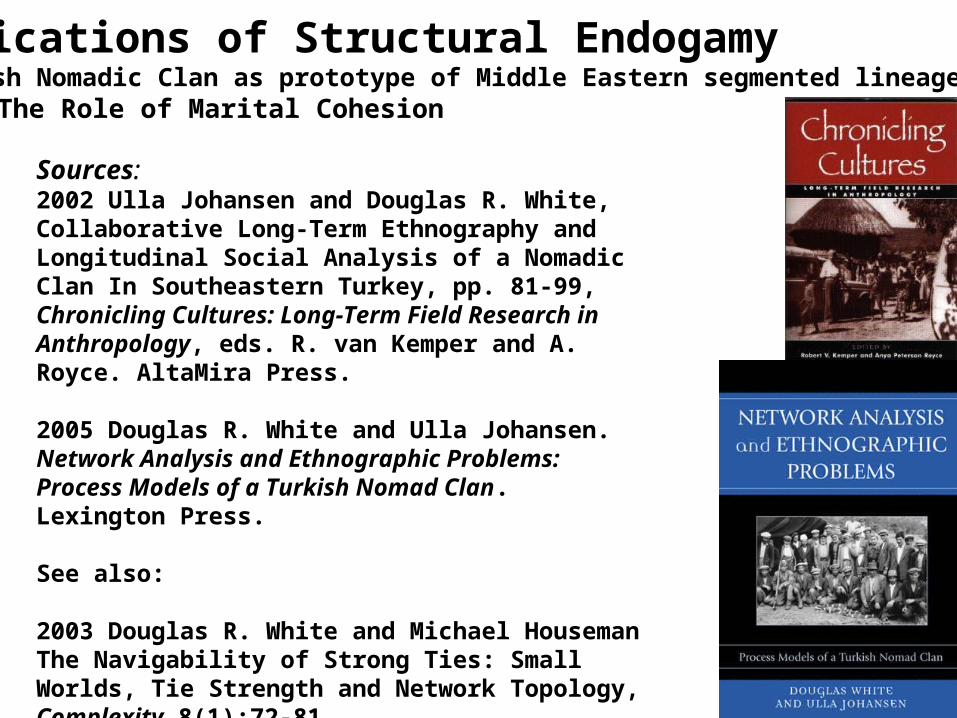
Applications of Structural EndogamyA Turkish Nomadic Clan as prototype of Middle Eastern segmented lineage systems:
The Role of Marital Cohesion
Sources: 2002 Ulla Johansen and Douglas R. White, Collaborative Long-Term Ethnography and Longitudinal Social Analysis of a Nomadic Clan In Southeastern Turkey, pp. 81-99, Chronicling Cultures: Long-Term Field Research in Anthropology, eds. R. van Kemper and A. Royce. AltaMira Press.
2005 Douglas R. White and Ulla Johansen. Network Analysis and Ethnographic Problems: Process Models of a Turkish Nomad Clan. Lexington Press.
See also:
2003 Douglas R. White and Michael Houseman The Navigability of Strong Ties: Small Worlds, Tie Strength and Network Topology, Complexity 8(1):72-81.(How highways of trust are established through reciprocal ties in structurally endogamous conical clan systems)
31
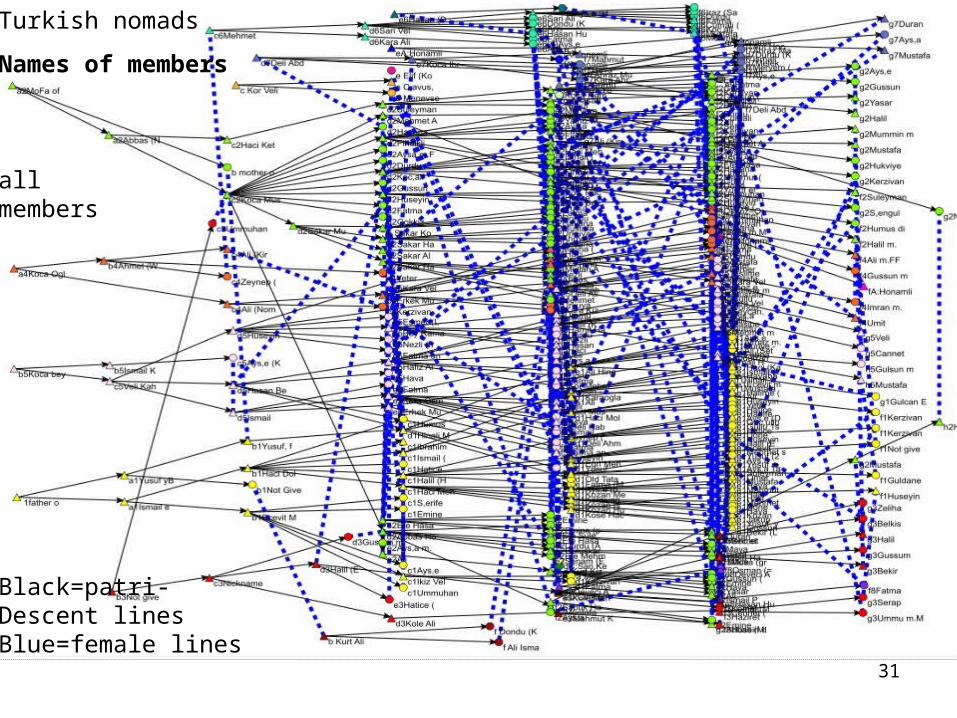
Turkish nomads
Names of members
allmembers
Black=patri-Descent linesBlue=female lines
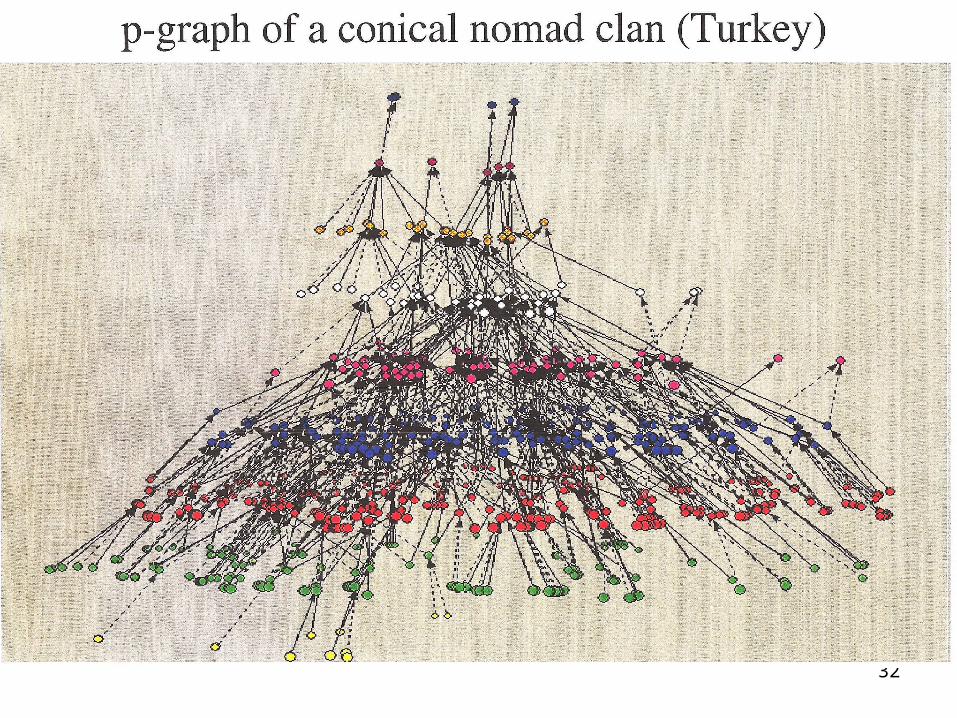
32
33
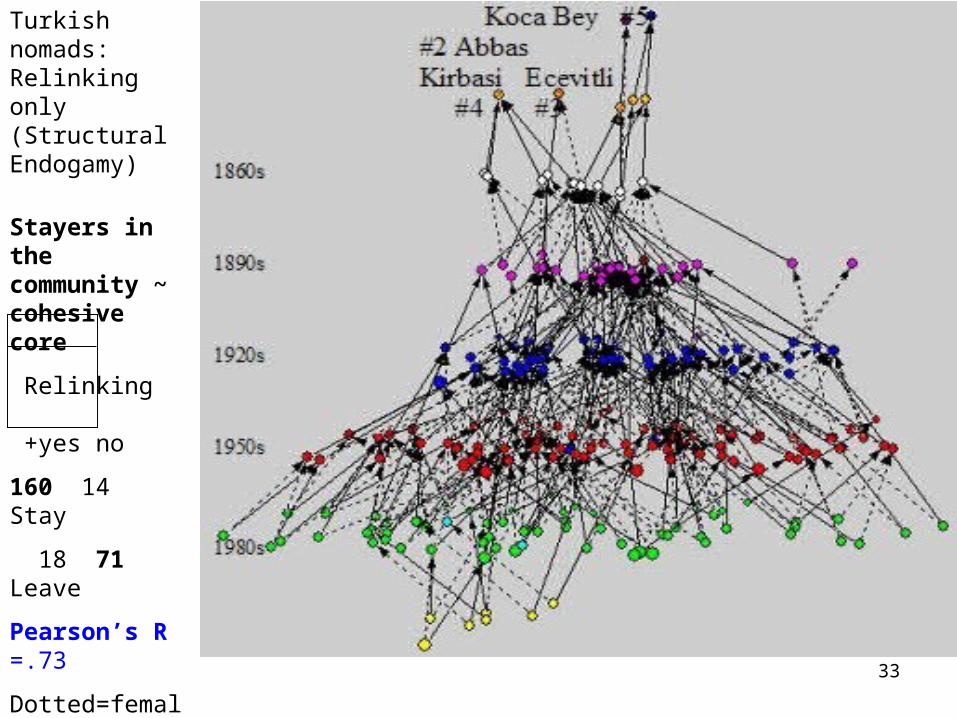
Turkish nomads: Relinking only (Structural Endogamy)
Stayers in the community ~ cohesive core
Relinking +yes no
160 14 Stay
18 71 Leave
Pearson’s R =.73
Dotted=female lines
Black=patri-Descent lines
34
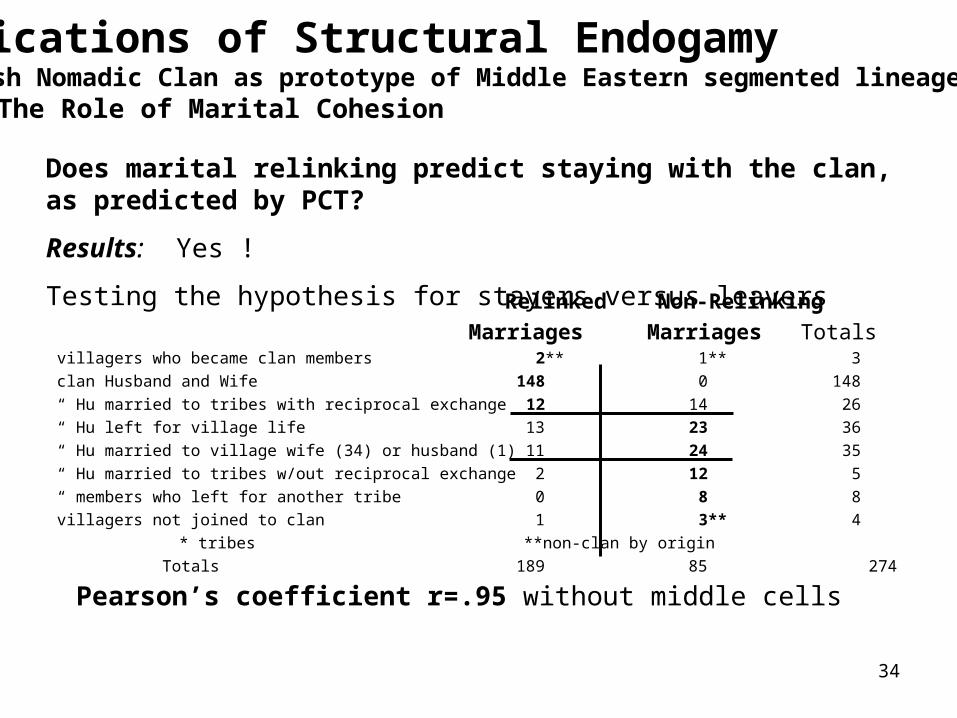
Applications of Structural EndogamyA Turkish Nomadic Clan as prototype of Middle Eastern segmented lineage systems:
The Role of Marital Cohesion
Does marital relinking predict staying with the clan, as predicted by PCT?
Results: Yes !
Testing the hypothesis for stayers versus leavers Relinked Non-Relinking
Marriages Marriages Totals villagers who became clan members 2** 1** 3
clan Husband and Wife 148 0 148
“ Hu married to tribes with reciprocal exchange 12 14 26
“ Hu left for village life 13 23 36
“ Hu married to village wife (34) or husband (1) 11 24 35
“ Hu married to tribes w/out reciprocal exchange 2 12 5
“ members who left for another tribe 0 8 8
villagers not joined to clan 1 3** 4
* tribes **non-clan by origin
Totals 189 85 274
Pearson’s coefficient r=.95 without middle cells
35
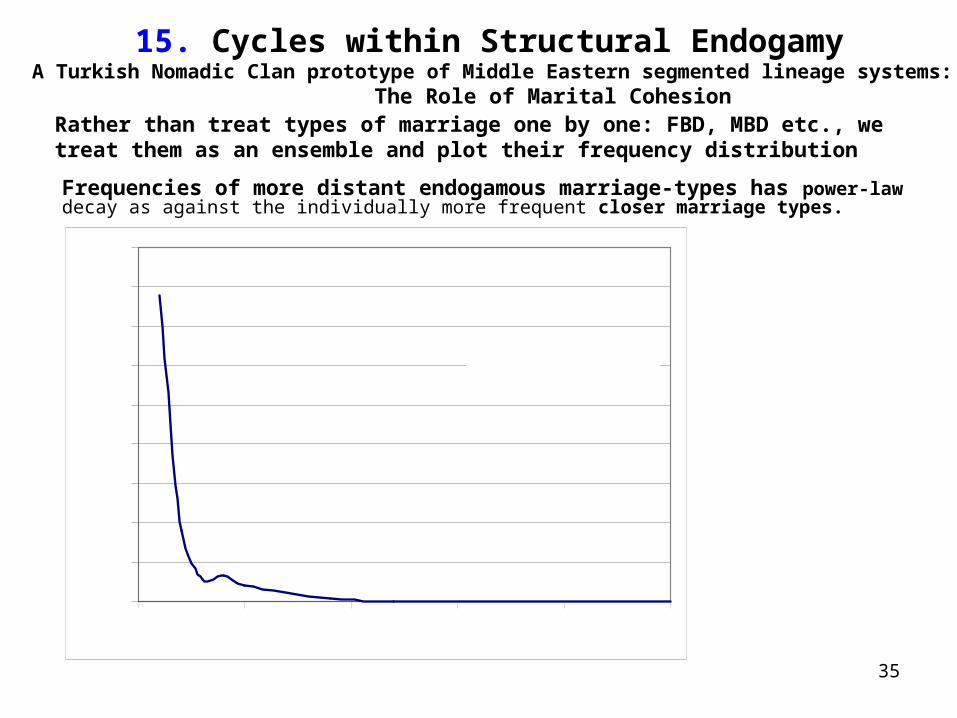
15. Cycles within Structural Endogamy A Turkish Nomadic Clan prototype of Middle Eastern segmented lineage systems:
The Role of Marital Cohesion
Frequencies of more distant endogamous marriage-types has power-law decay as against the individually more frequent closer marriage types.
Rather than treat types of marriage one by one: FBD, MBD etc., we treat them as an ensemble and plot their frequency distribution
0
20
40
60
80
100
120
140
160
180
0 5 10 15 20 25
Frequency
0 + 156/x 2̂
FFZSD FFBSD:10-11 FZD:14 MBD:16 FBD:31
MM =206/x2
Raw frequency
(power law preferential curve)
# of Couples
# of Types
FFZSD FFBSD FZD MBD FBD
# of couples
# of kin types
This is an ancient (4500 year old ) complex-system integration of scalable integration from families to subcontinents and from small feuds to international conflicts. Already present in the Canaan conical lineage as a form of organization.
36
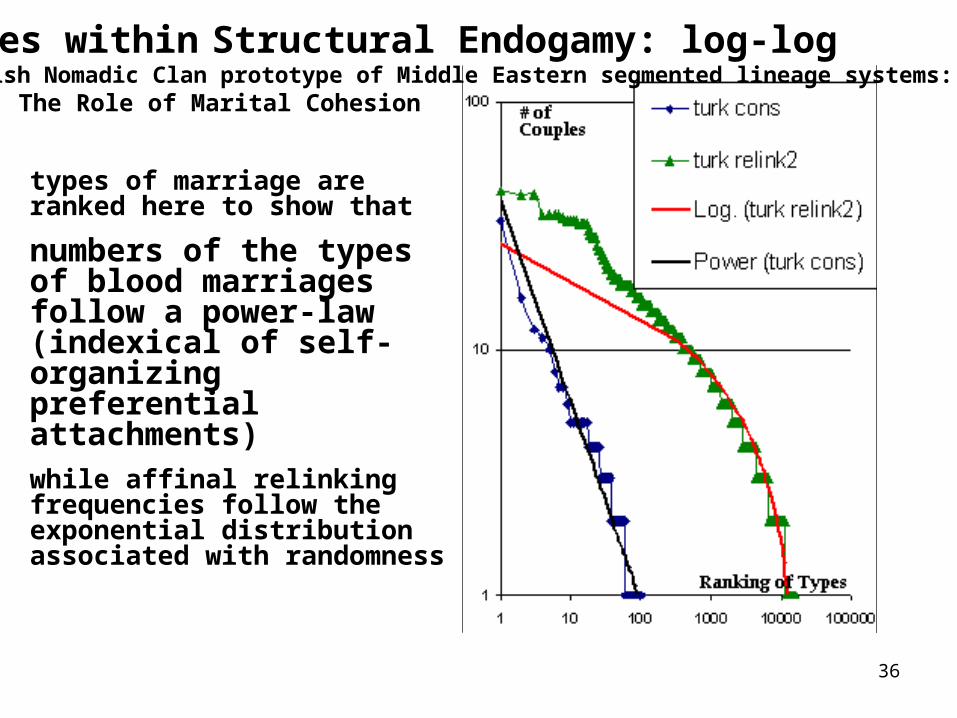
Cycles within Structural Endogamy: log-logA Turkish Nomadic Clan prototype of Middle Eastern segmented lineage systems:
The Role of Marital Cohesion
types of marriage are ranked here to show that
numbers of the types of blood marriages follow a power-law (indexical of self-organizing preferential attachments)
while affinal relinking frequencies follow the exponential distribution associated with randomness
37
We look at marriage bicomponent analysis to a European town
(here, no blood marriages)
How do marriage cycles and structural endogamy have consequences in this
case?
Relinkings are marriages that reconnect 1 or more families
38
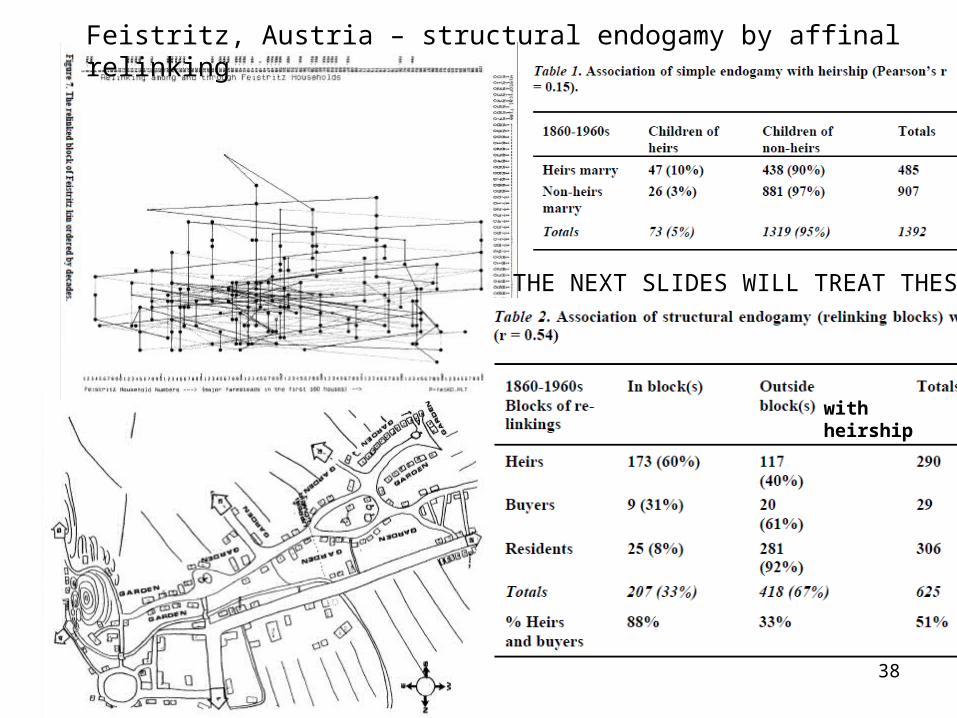
with heirship
THE NEXT SLIDES WILL TREAT THESE
Feistritz, Austria – structural endogamy by affinal relinking
39
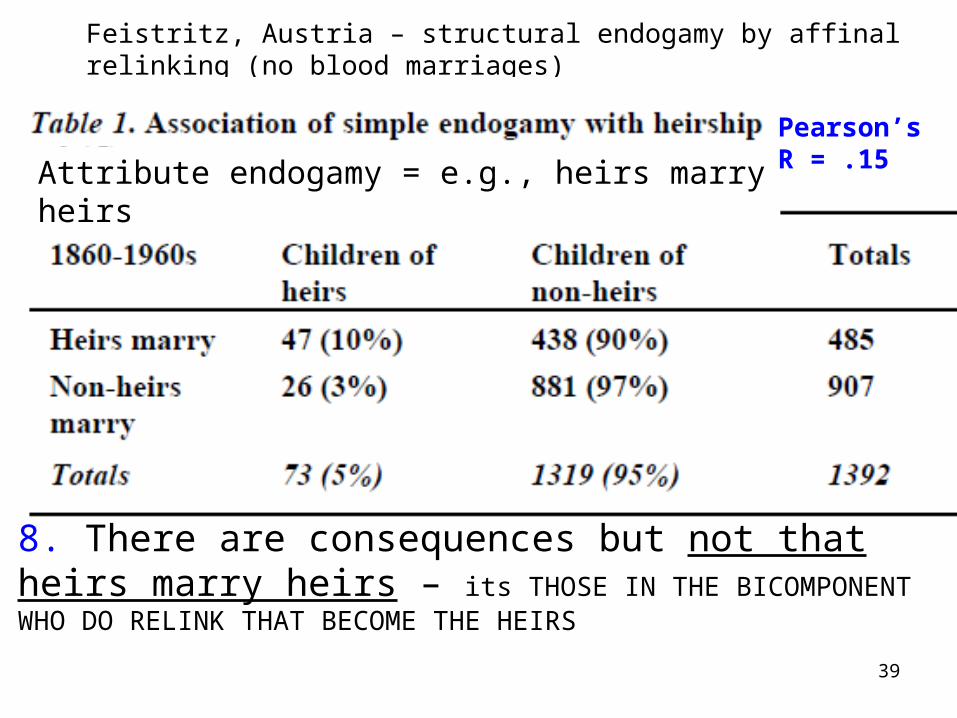
Feistritz, Austria – structural endogamy by affinal relinking (no blood marriages)
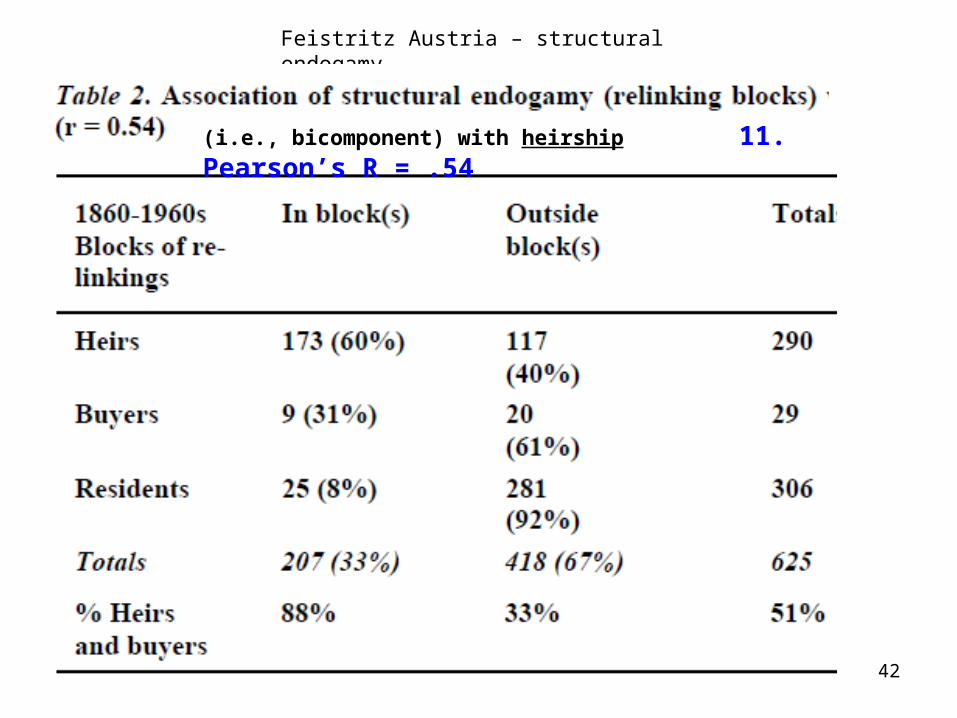
8. There are consequences but not that heirs marry heirs – its THOSE IN THE BICOMPONENT WHO DO RELINK THAT BECOME THE HEIRS
Attribute endogamy = e.g., heirs marry heirs
Pearson’s R = .15
40
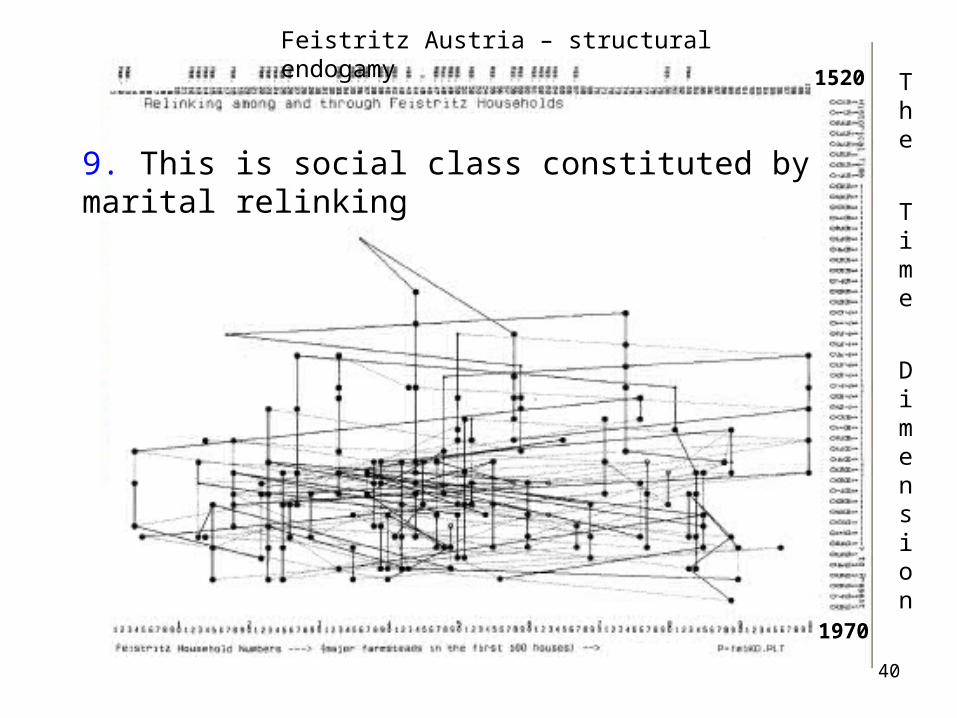
Feistritz Austria – structural endogamy
9. This is social class constituted by marital relinking
The
Time
Dimens ion
1970
1520
41
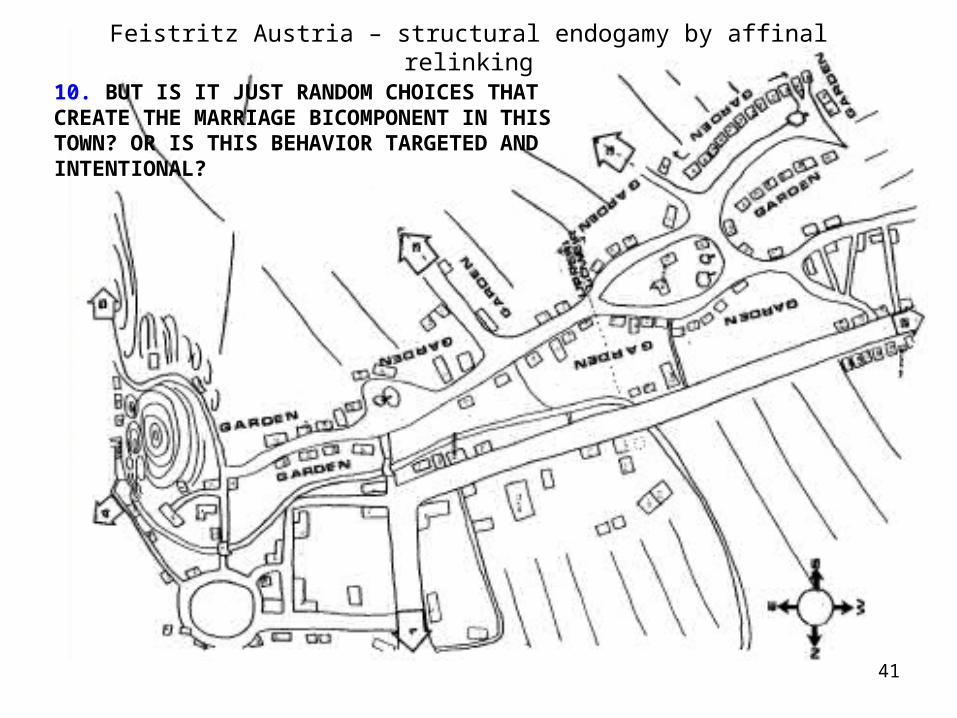
Feistritz Austria – structural endogamy by affinal relinking
10. BUT IS IT JUST RANDOM CHOICES THAT CREATE THE MARRIAGE BICOMPONENT IN THIS TOWN? OR IS THIS BEHAVIOR TARGETED AND INTENTIONAL?
42
Feistritz Austria – structural endogamy
(i.e., bicomponent) with heirship 11. Pearson’s R = .54
43
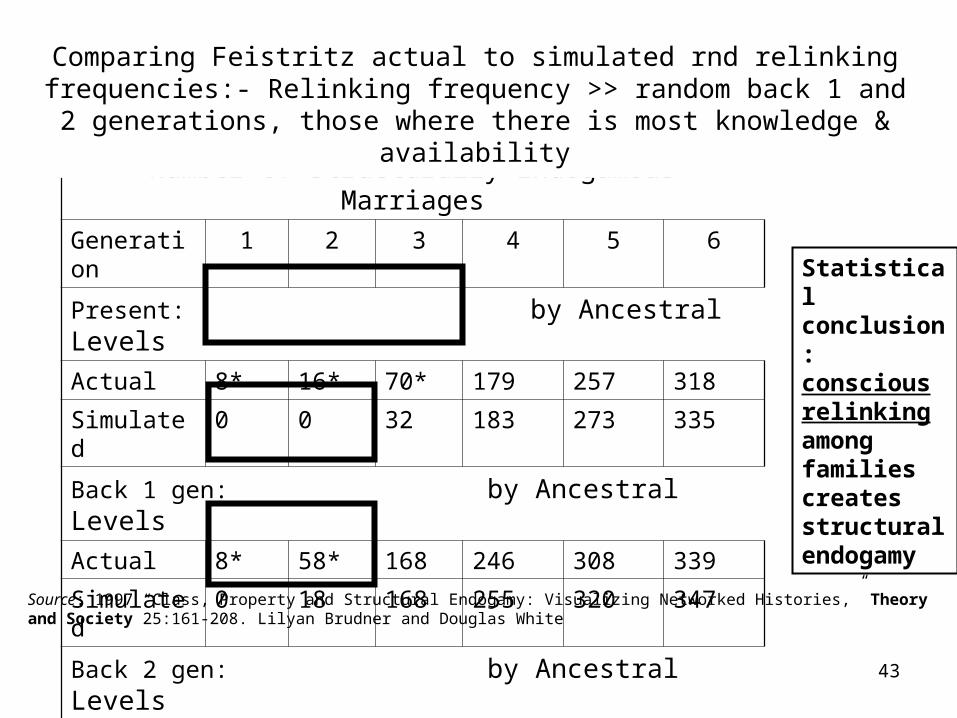
Number of Structurally Endogamous Marriages
Generation
1 2 3 4 5 6
Present: by Ancestral Levels
Actual 8* 16* 70* 179 257 318
Simulated 0 0 32 183 273 335
Back 1 gen: by Ancestral Levels
Actual 8* 58* 168 246 308 339
Simulated 0 18 168 255 320 347
Back 2 gen: by Ancestral Levels
Actual 26* 115* 178 243 278 292
Simulated 0 98 194 262 291 310Source: 1997 “Class, Property and Structural Endogamy: Visualizing Networked Histories,” Theory and Society 25:161-208. Lilyan Brudner and Douglas White
Statistical conclusion: conscious relinking among families creates structural endogamy
Comparing Feistritz actual to simulated rnd relinking frequencies:- Relinking frequency >> random back 1 and 2 generations, those
where there is most knowledge & availability
44
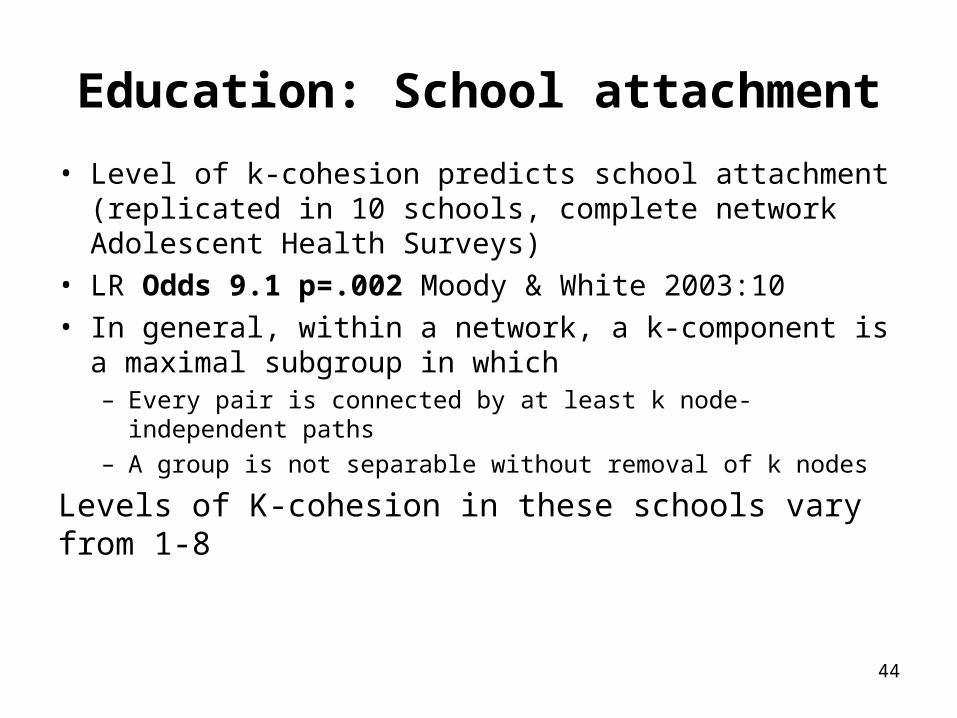
Education: School attachment
• Level of k-cohesion predicts school attachment (replicated in 10 schools, complete network Adolescent Health Surveys)
• LR Odds 9.1 p=.002 Moody & White 2003:10• In general, within a network, a k-component is a
maximal subgroup in which– Every pair is connected by at least k node-independent
paths– A group is not separable without removal of k nodes
Levels of K-cohesion in these schools vary from 1-8
45
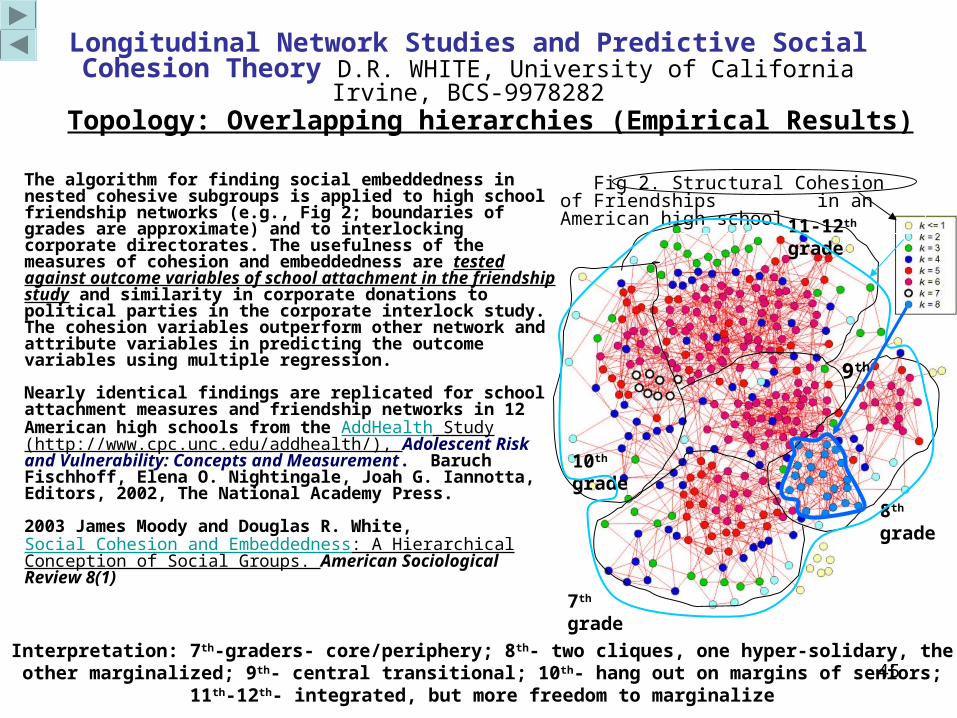
Topology: Overlapping hierarchies (Empirical Results)
The algorithm for finding social embeddedness in nested cohesive subgroups is applied to high school friendship networks (e.g., Fig 2; boundaries of grades are approximate) and to interlocking corporate directorates. The usefulness of the measures of cohesion and embeddedness are tested against outcome variables of school attachment in the friendship study and similarity in corporate donations to political parties in the corporate interlock study. The cohesion variables outperform other network and attribute variables in predicting the outcome variables using multiple regression.
Nearly identical findings are replicated for school attachment measures and friendship networks in 12 American high schools from the AddHealth Study (http://www.cpc.unc.edu/addhealth/), Adolescent Risk and Vulnerability: Concepts and Measurement. Baruch Fischhoff, Elena O. Nightingale, Joah G. Iannotta, Editors, 2002, The National Academy Press.
2003 James Moody and Douglas R. White, Social Cohesion and Embeddedness: A Hierarchical Conception of Social Groups. American Sociological Review 8(1)
Longitudinal Network Studies and Predictive Social Cohesion Theory D.R. WHITE, University of California Irvine, BCS-9978282
Fig 2. Structural Cohesion of Friendships _______in an American high school
8th grade
7th grade
11-12th grade
10th grade
9th
Interpretation: 7th-graders- core/periphery; 8th- two cliques, one hyper-solidary, the other marginalized; 9th- central transitional; 10th- hang out on margins of seniors; 11th-12th-
integrated, but more freedom to marginalize
46
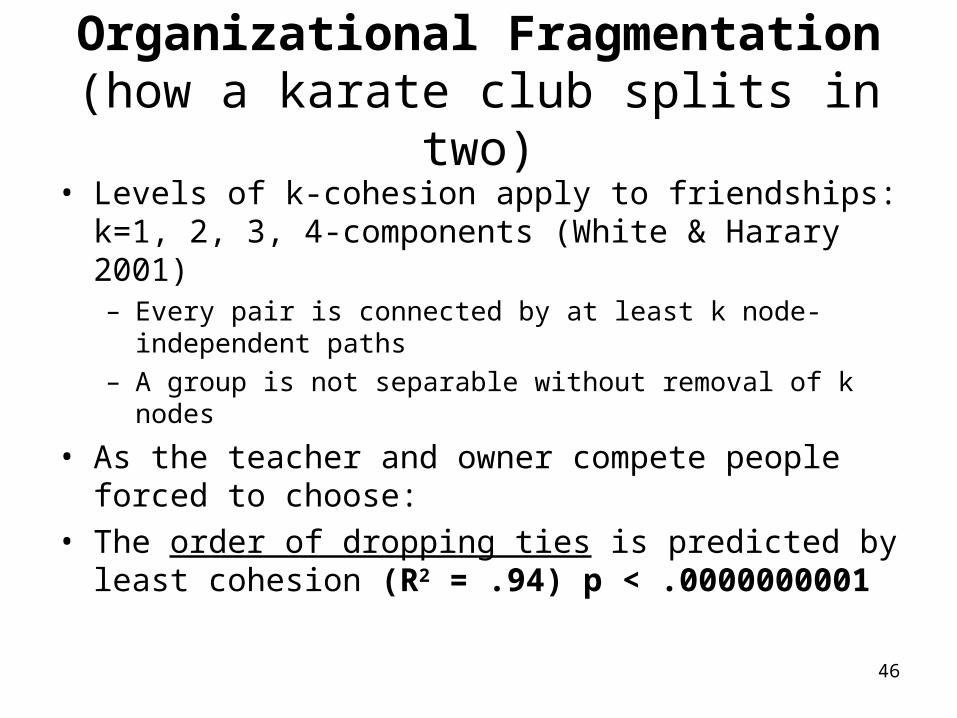
Organizational Fragmentation(how a karate club splits in two)
• Levels of k-cohesion apply to friendships: k=1, 2, 3, 4-components (White & Harary 2001)– Every pair is connected by at least k node-independent
paths– A group is not separable without removal of k nodes
• As the teacher and owner compete people forced to choose:
• The order of dropping ties is predicted by least cohesion (R2 = .94) p < .0000000001
47
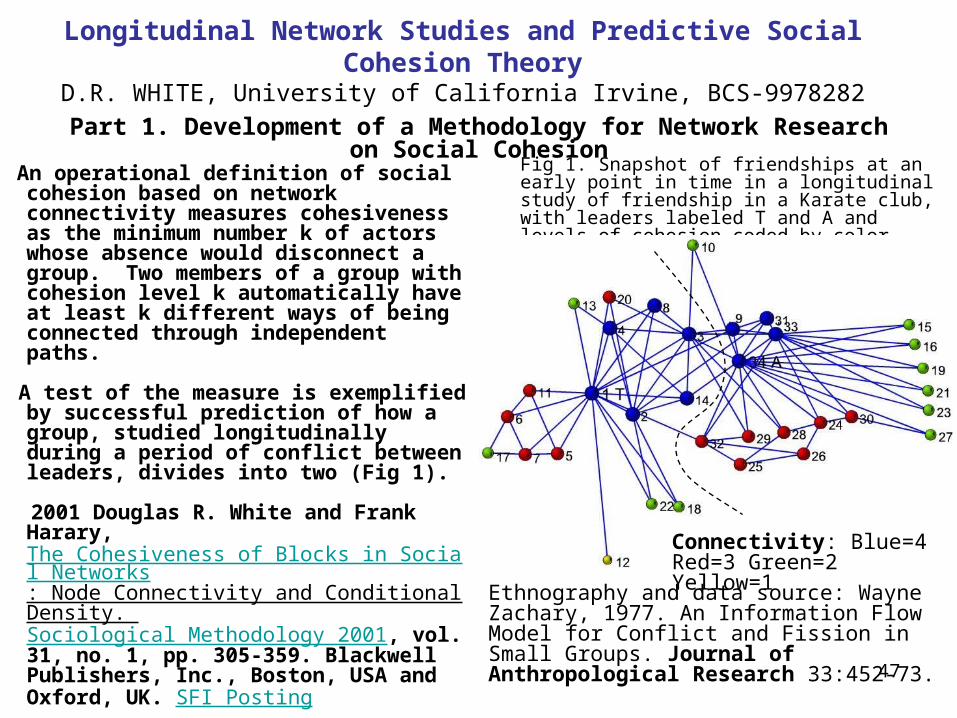
Longitudinal Network Studies and Predictive Social Cohesion Theory
D.R. WHITE, University of California Irvine, BCS-9978282
An operational definition of social cohesion based on network connectivity measures cohesiveness as the minimum number k of actors whose absence would disconnect a group. Two members of a group with cohesion level k automatically have at least k different ways of being connected through independent paths.
A test of the measure is exemplified by successful prediction of how a group, studied longitudinally during a period of conflict between leaders, divides into two (Fig 1).
2001 Douglas R. White and Frank Harary, The Cohesiveness of Blocks in Social Networks: Node Connectivity and Conditional Density. Sociological Methodology 2001, vol. 31, no. 1, pp. 305-359. Blackwell Publishers, Inc., Boston, USA and Oxford, UK. SFI Posting
Part 1. Development of a Methodology for Network Research on Social Cohesion
Fig 1. Snapshot of friendships at an early point in time in a longitudinal study of friendship in a Karate club, with leaders labeled T and A and levels of cohesion coded by color.
Ethnography and data source: Wayne Zachary, 1977. An Information Flow Model for Conflict and Fission in Small Groups. Journal of Anthropological Research 33:452-73.
Connectivity: Blue=4 Red=3 Green=2 Yellow=1

48
Figure 1a,b,c Data source: Wayne Zachary, 1977. An Information Flow Model for Conflict and Fission in Small Groups. Journal of Anthropological Research 33:452-73.
T = karate teacher
A = club administrator
Block Connectivity:
Blue k=4 (quadricomponent)
Red k=3 (tricomponent)
Green k=2 (bicomponent)
Yellow k=1 (component)
T
T’s side A’s side
A
T and A start to fight: some must choose sides Opposing cohesive sides emerge
TA
The sides separate along cohesive fracture
members of a group with cohesion level k automatically have at least k different ways of being connected through (k) node-independent paths
T A
Loss of cohesion
49
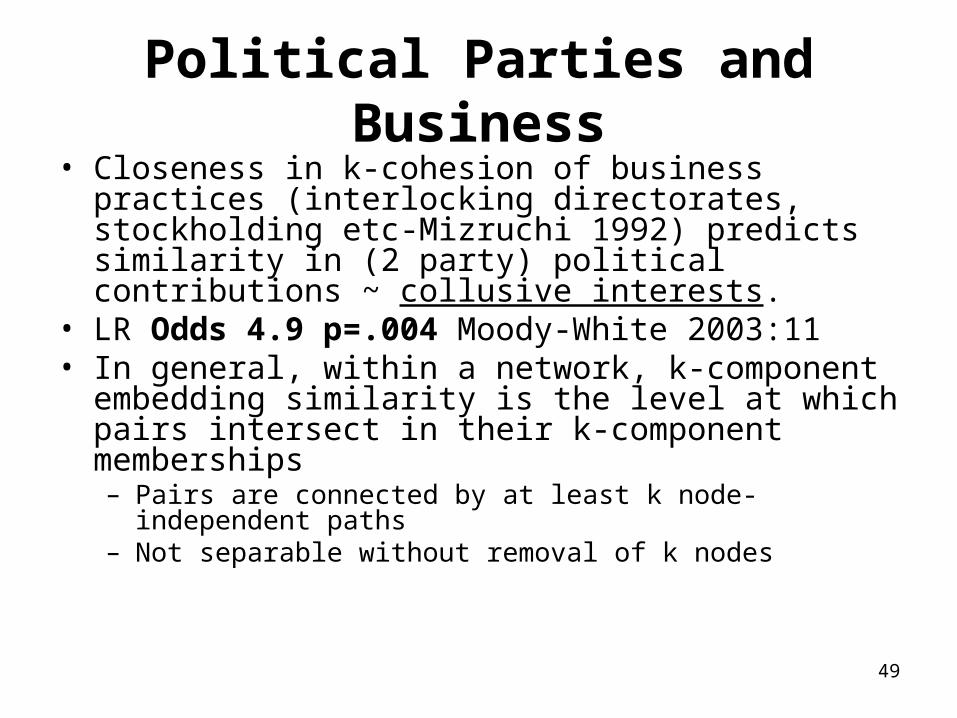
Political Parties and Business
• Closeness in k-cohesion of business practices (interlocking directorates, stockholding etc-Mizruchi 1992) predicts similarity in (2 party) political contributions ~ collusive interests.
• LR Odds 4.9 p=.004 Moody-White 2003:11• In general, within a network, k-component
embedding similarity is the level at which pairs intersect in their k-component memberships– Pairs are connected by at least k node-independent
paths– Not separable without removal of k nodes
50
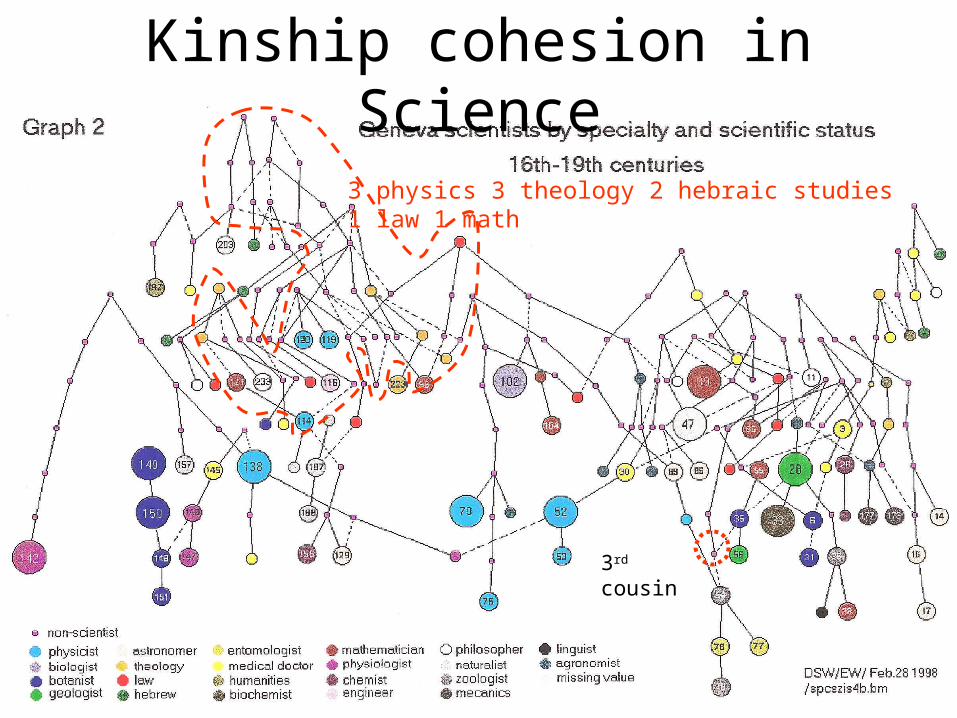
Science transmission• This example gives an aspect of the social
transmission of science in terms of genealogical relations among scientists in Geneva, 16th-19th centuries (Eric Widmer 1998).
• Cohesive & (Connected but noncohesive) groups differ in their specialties, with physics, math, law and theology in the temporally early cohesive core
• Transmission gives way to universities at later time periods
51
Kinship cohesion in Science
3 physics 3 theology 2 hebraic studies 1 law 1 math
3rd cousin
52
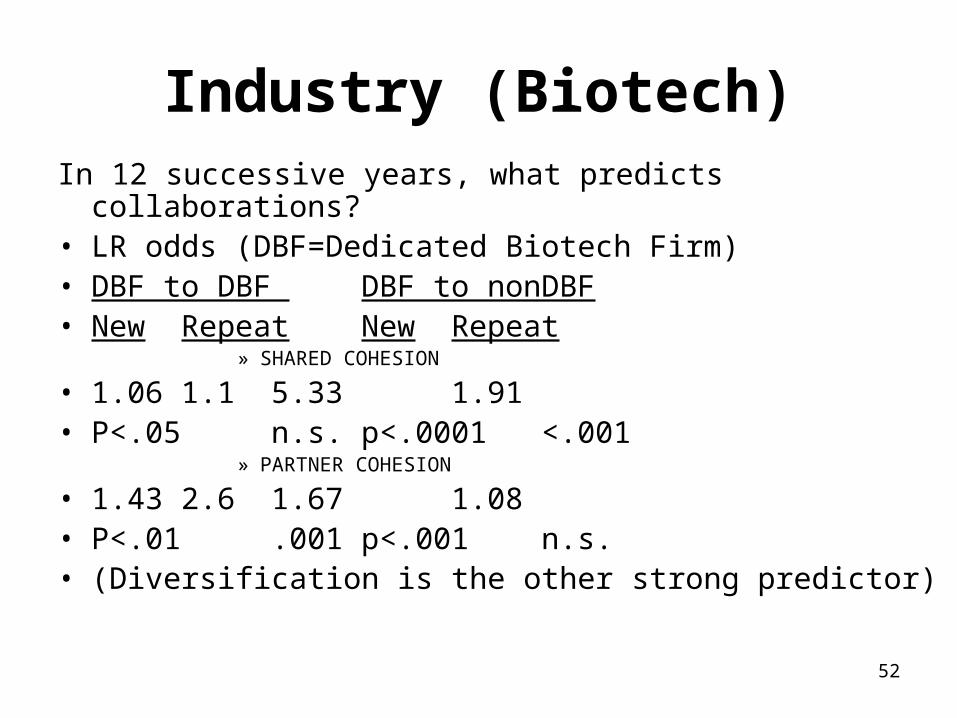
Industry (Biotech)In 12 successive years, what predicts collaborations?• LR odds (DBF=Dedicated Biotech Firm)• DBF to DBF DBF to nonDBF• New Repeat New Repeat
» SHARED COHESION
• 1.06 1.1 5.33 1.91• P<.05 n.s. p<.0001 <.001
» PARTNER COHESION
• 1.43 2.6 1.67 1.08• P<.01 .001 p<.001 n.s.• (Diversification is the other strong predictor)
53
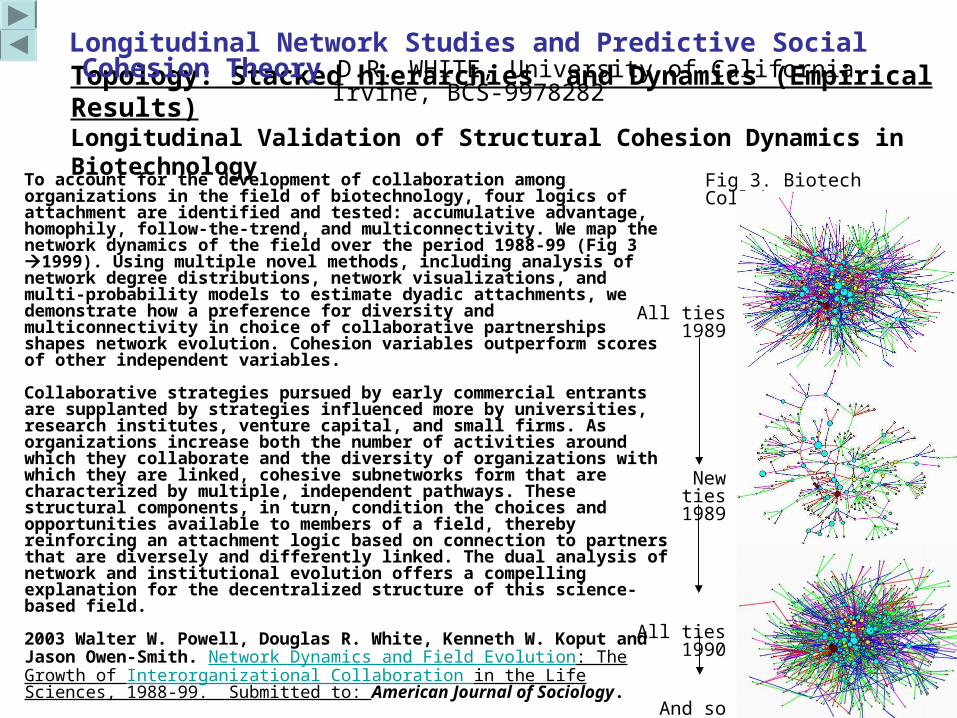
To account for the development of collaboration among organizations in the field of biotechnology, four logics of attachment are identified and tested: accumulative advantage, homophily, follow-the-trend, and multiconnectivity. We map the network dynamics of the field over the period 1988-99 (Fig 3 1999). Using multiple novel methods, including analysis of network degree distributions, network visualizations, and multi-probability models to estimate dyadic attachments, we demonstrate how a preference for diversity and multiconnectivity in choice of collaborative partnerships shapes network evolution. Cohesion variables outperform scores of other independent variables.
Collaborative strategies pursued by early commercial entrants are supplanted by strategies influenced more by universities, research institutes, venture capital, and small firms. As organizations increase both the number of activities around which they collaborate and the diversity of organizations with which they are linked, cohesive subnetworks form that are characterized by multiple, independent pathways. These structural components, in turn, condition the choices and opportunities available to members of a field, thereby reinforcing an attachment logic based on connection to partners that are diversely and differently linked. The dual analysis of network and institutional evolution offers a compelling explanation for the decentralized structure of this science-based field.
2003 Walter W. Powell, Douglas R. White, Kenneth W. Koput and Jason Owen-Smith. Network Dynamics and Field Evolution: The Growth of Interorganizational Collaboration in the Life Sciences, 1988-99. Submitted to: American Journal of Sociology.
Topology: Stacked hierarchies and Dynamics (Empirical Results) Longitudinal Validation of Structural Cohesion Dynamics in Biotechnology
Longitudinal Network Studies and Predictive Social Cohesion Theory D.R. WHITE, University of California Irvine, BCS-9978282
Fig 3. Biotech Collaborations
All ties 1989
New ties 1989
All ties 1990
And so on to 1999
54
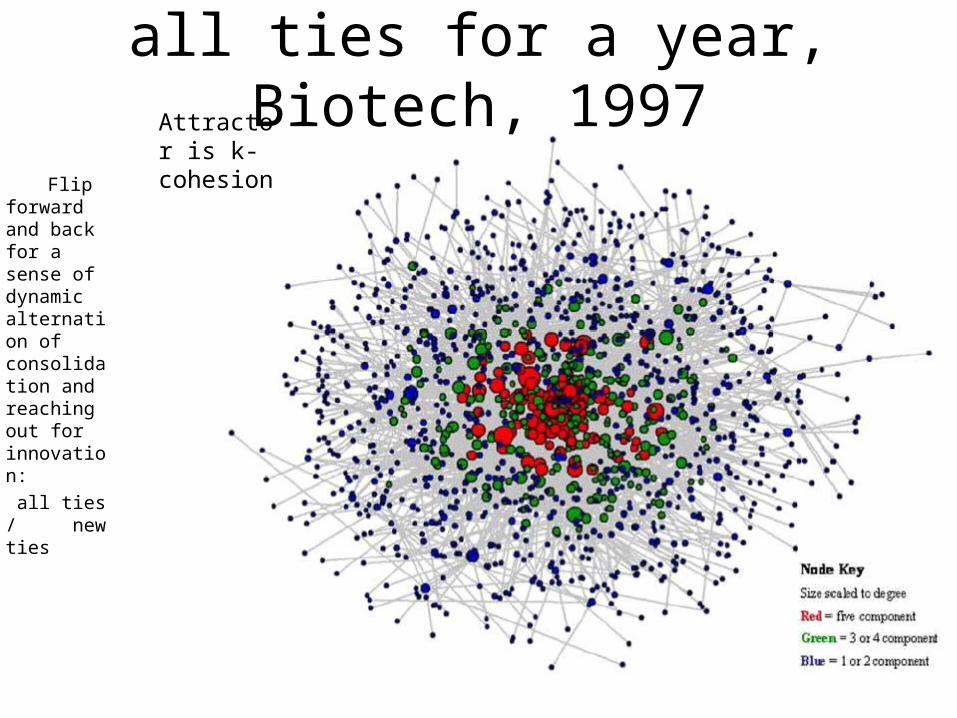
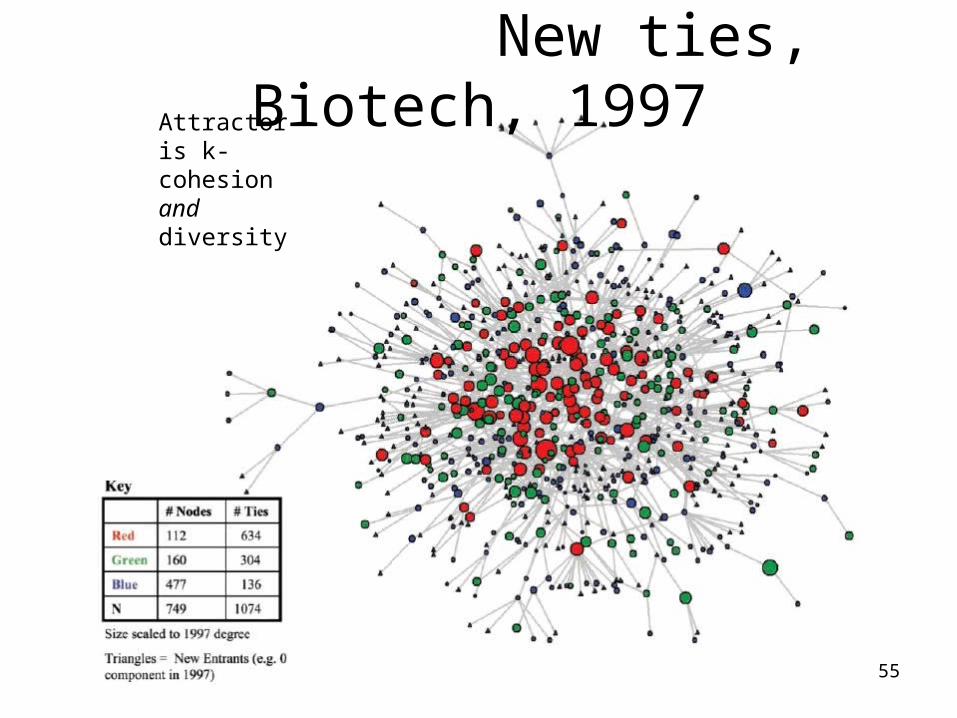
Flip forward and back for a sense of dynamic alternation of consolidation and reaching out for innovation: all ties / new ties
all ties for a year, Biotech, 1997Attractor
is k-cohesion
55
New ties, Biotech,
1997
(flip back)
Attractor is k-cohesion and diversity
56
Cities and Trade
• Medieval Renaissance: trade routes are cohesive, equalization of trade benefits
• Banking routes are hierarchical, tree-like, noncohesive, unequal advantage
• Commodity wealth accrues to Genoa, via short-path betweenness centrality
• Over 3 centuries trade flow centrality brings financial profits to the Low Countries banking cities.
• 20th century trade-commodity flows are hierarchical, unequal position in trade relations
57Later: a look at how population cycles and trade networks promote/demote industries
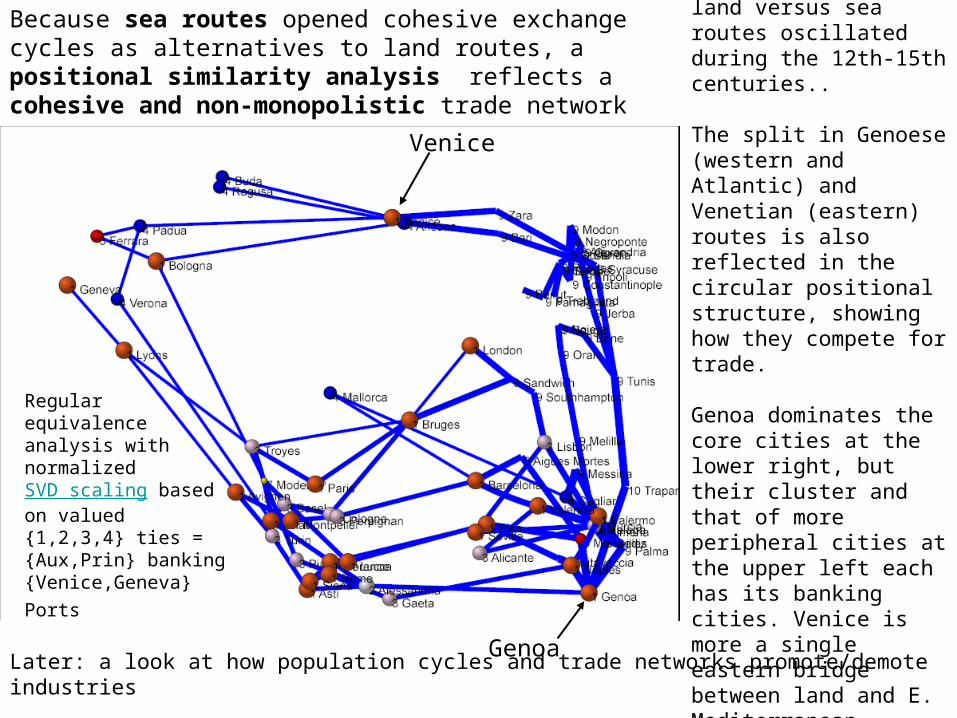
Because sea routes opened cohesive exchange cycles as alternatives to land routes, a positional similarity analysis reflects a cohesive and non-monopolistic trade network
The importance of land versus sea routes oscillated during the 12th-15th centuries..
The split in Genoese (western and Atlantic) and Venetian (eastern) routes is also reflected in the circular positional structure, showing how they compete for trade.
Genoa dominates the core cities at the lower right, but their cluster and that of more peripheral cities at the upper left each has its banking cities. Venice is more a single eastern bridge between land and E. Mediterranean.
Regular equivalence analysis with normalized SVD scaling based on valued {1,2,3,4} ties = {Aux,Prin} banking {Venice,Geneva}
Ports
Venice
Genoa
58
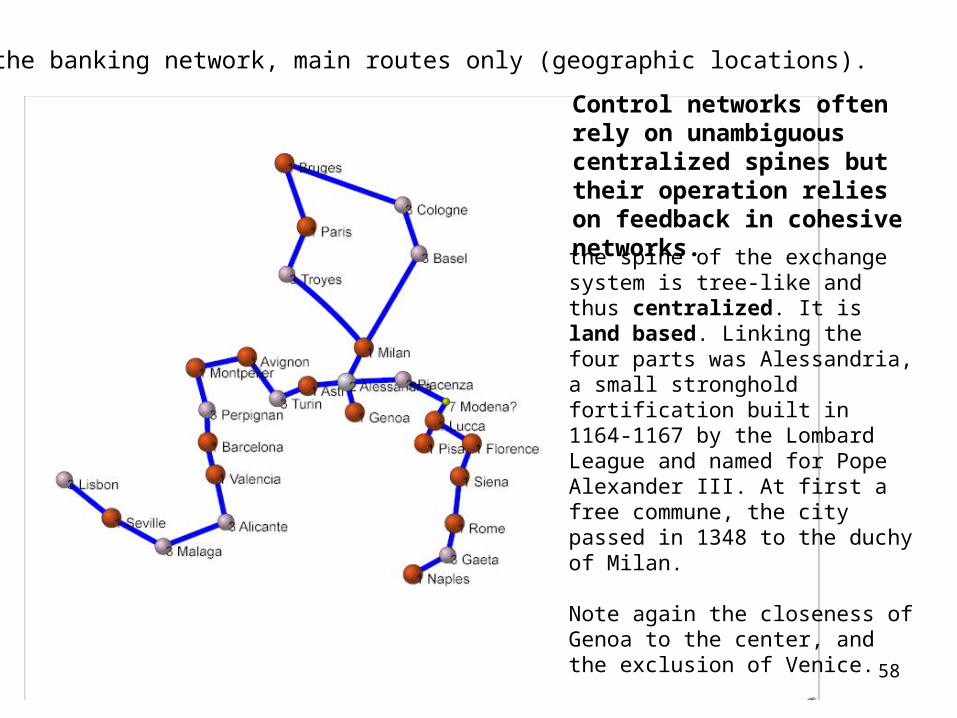
the banking network, main routes only (geographic locations).
the spine of the exchange system is tree-like and thus centralized. It is land based. Linking the four parts was Alessandria, a small stronghold fortification built in 1164-1167 by the Lombard League and named for Pope Alexander III. At first a free commune, the city passed in 1348 to the duchy of Milan.
Note again the closeness of Genoa to the center, and the exclusion of Venice.
Control networks often rely on unambiguous centralized spines but their operation relies on feedback in cohesive networks.
59
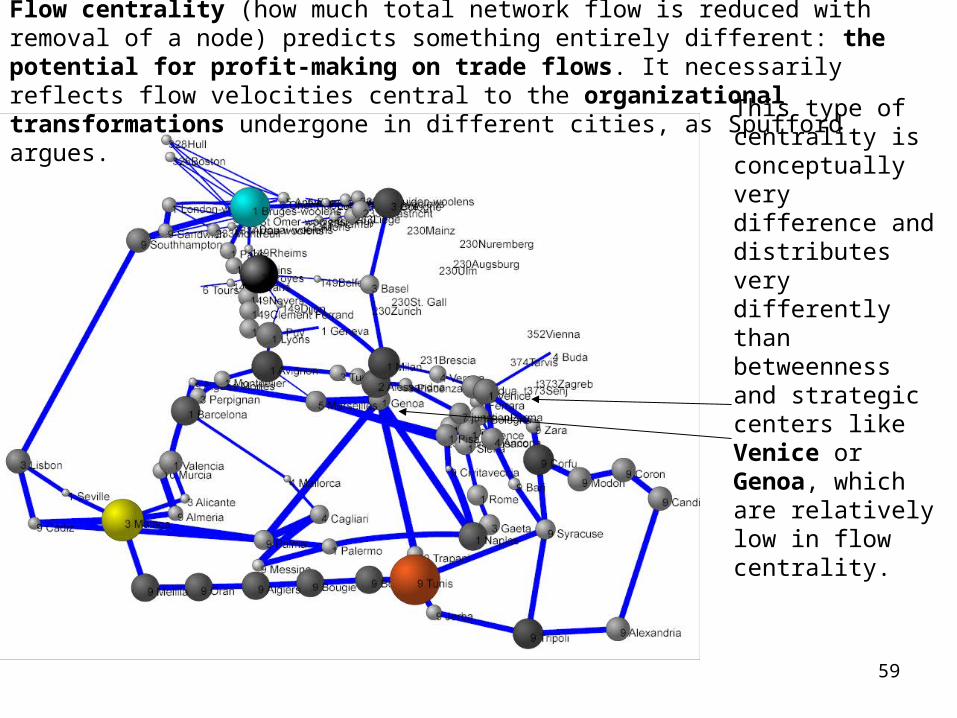
Flow centrality (how much total network flow is reduced with removal of a node) predicts something entirely different: the potential for profit-making on trade flows. It necessarily reflects flow velocities central to the organizational transformations undergone in different cities, as Spufford argues. This type of
centrality is conceptually very difference and distributes very differently than betweenness and strategic centers like Venice or Genoa, which are relatively low in flow centrality.
60
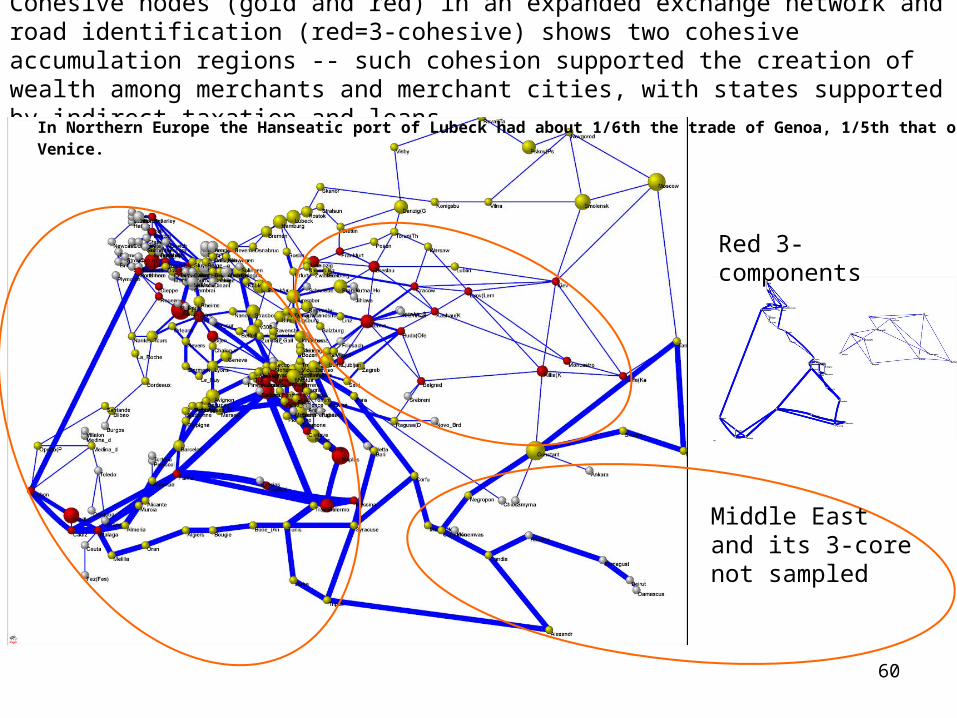
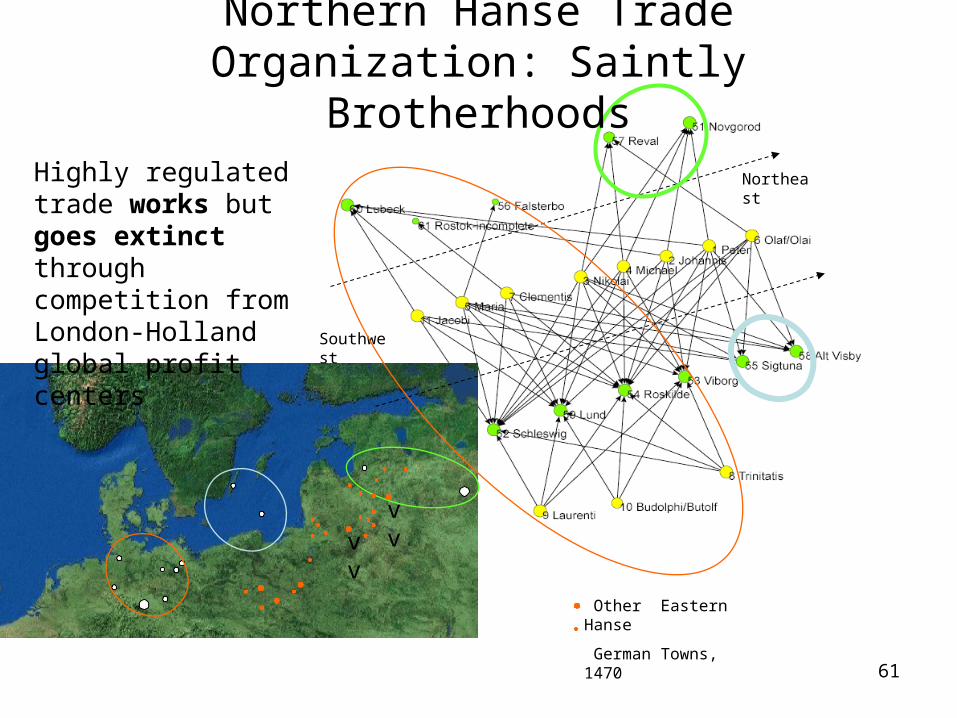
Cohesive nodes (gold and red) in an expanded exchange network and road identification (red=3-cohesive) shows two cohesive accumulation regions -- such cohesion supported the creation of wealth among merchants and merchant cities, with states supported by indirect taxation and loans.
Red 3-components
Middle East and its 3-core not sampled
In Northern Europe the Hanseatic port of Lubeck had about 1/6th the trade of Genoa, 1/5th that of Venice.
61
Northeast
Southwest
Northern Hanse Trade Organization: Saintly Brotherhoods
vv
vv
Other Eastern Hanse
German Towns, 1470
Highly regulated trade works but goes extinct through competition from London-Holland global profit centers
62
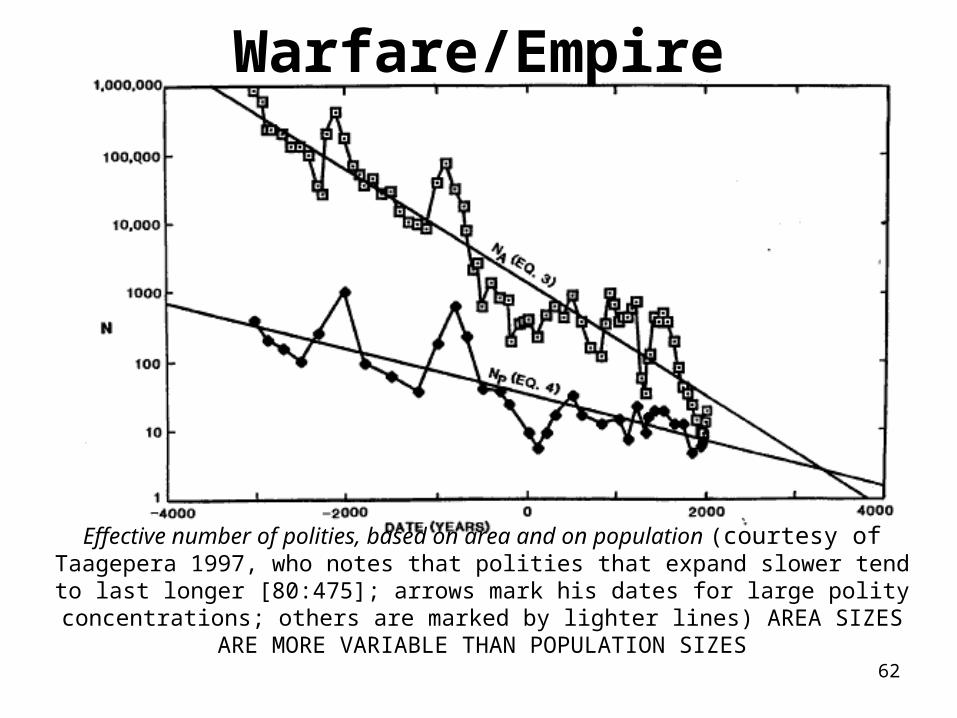
Warfare/Empire
Effective number of polities, based on area and on population (courtesy of Taagepera 1997, who notes that polities that expand slower tend to last
longer [80:475]; arrows mark his dates for large polity concentrations; others are marked by lighter lines) AREA SIZES ARE MORE VARIABLE THAN
POPULATION SIZES
63
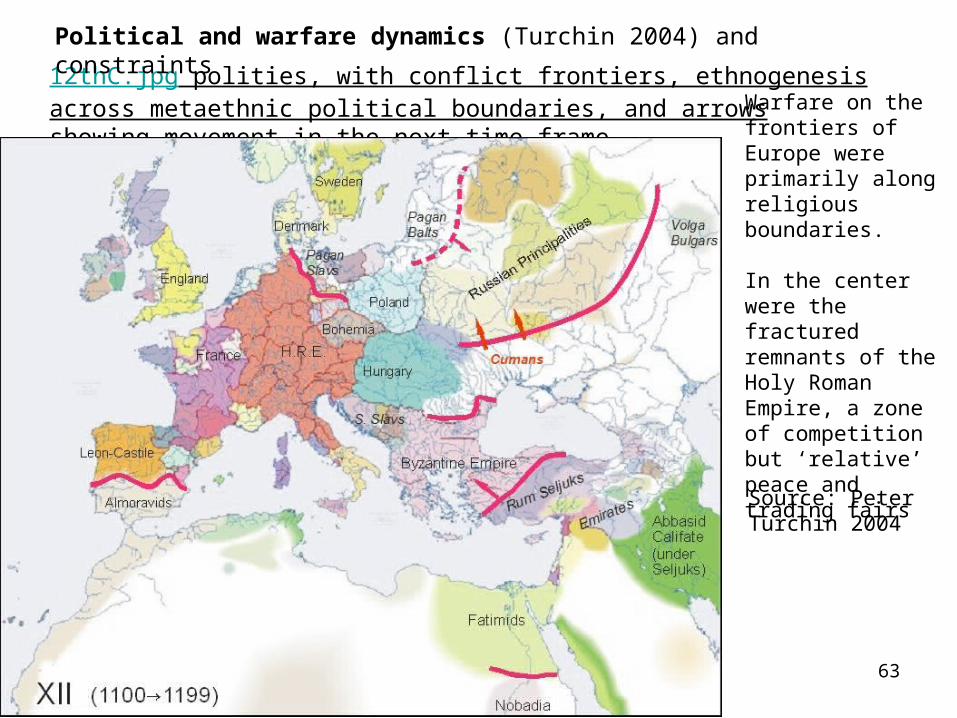
12thC.jpg polities, with conflict frontiers, ethnogenesis across metaethnic political boundaries, and arrows showing movement in the next time frame
Source: Peter Turchin 2004
Political and warfare dynamics (Turchin 2004) and constraints
Warfare on the frontiers of Europe were primarily along religious boundaries.
In the center were the fractured remnants of the Holy Roman Empire, a zone of competition but ‘relative’ peace and trading fairs
64
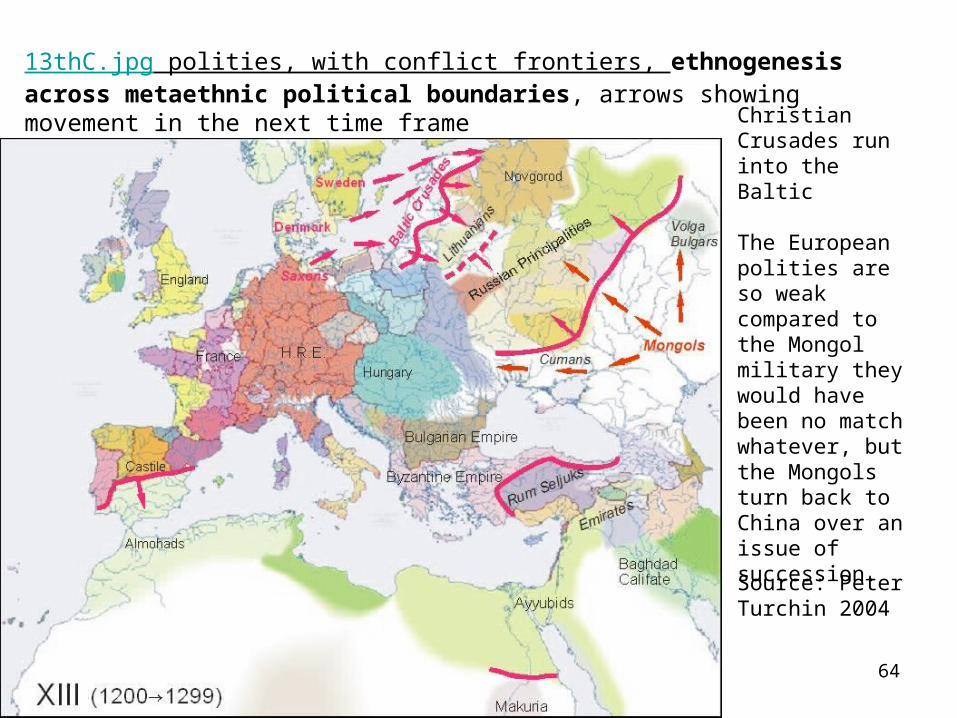
13thC.jpg polities, with conflict frontiers, ethnogenesis across metaethnic political boundaries, arrows showing movement in the next time frame
Source: Peter Turchin 2004
Christian Crusades run into the Baltic
The European polities are so weak compared to the Mongol military they would have been no match whatever, but the Mongols turn back to China over an issue of succession.
65
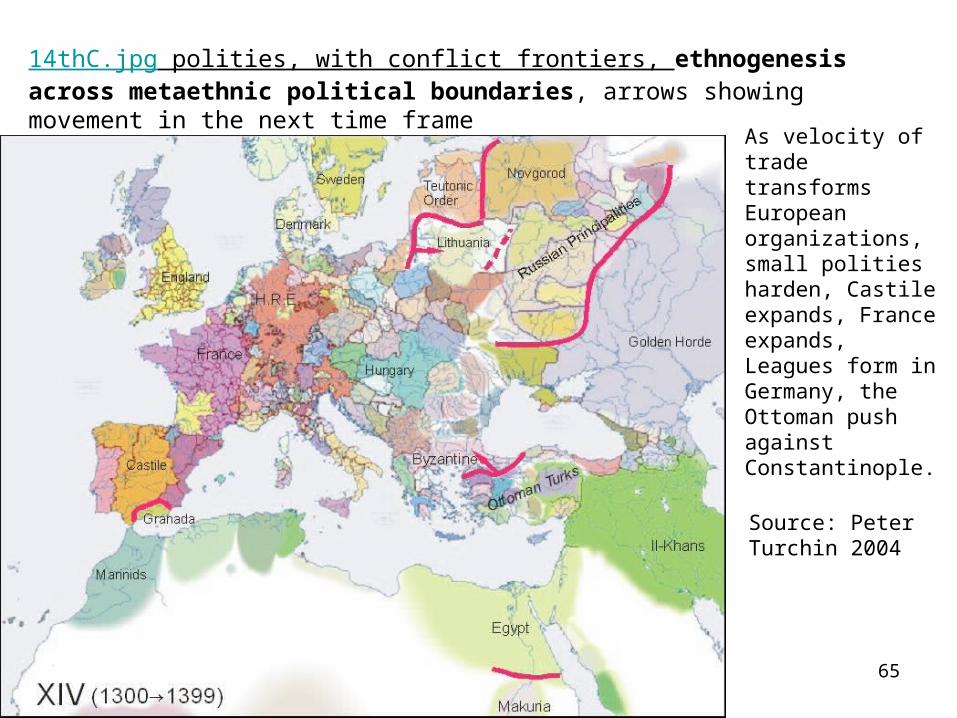
14thC.jpg polities, with conflict frontiers, ethnogenesis across metaethnic political boundaries, arrows showing movement in the next time frame
Source: Peter Turchin 2004
As velocity of trade transforms European organizations, small polities harden, Castile expands, France expands, Leagues form in Germany, the Ottoman push against Constantinople.
66
Historical Cycles• Peter Turchin shows agrarian empire
metastabilty in 200+ year “secular” cycles of growth/decline in people/resource ratios leading internecine conflict cycles by ¼ cycle (+) feedback, conflict leads negative (-) feedback on people/resource ratios.
• Longer and many successively shorter cycles have temporal phase-length doublings; conflicts alternately open and close exchange boundaries as doublings.
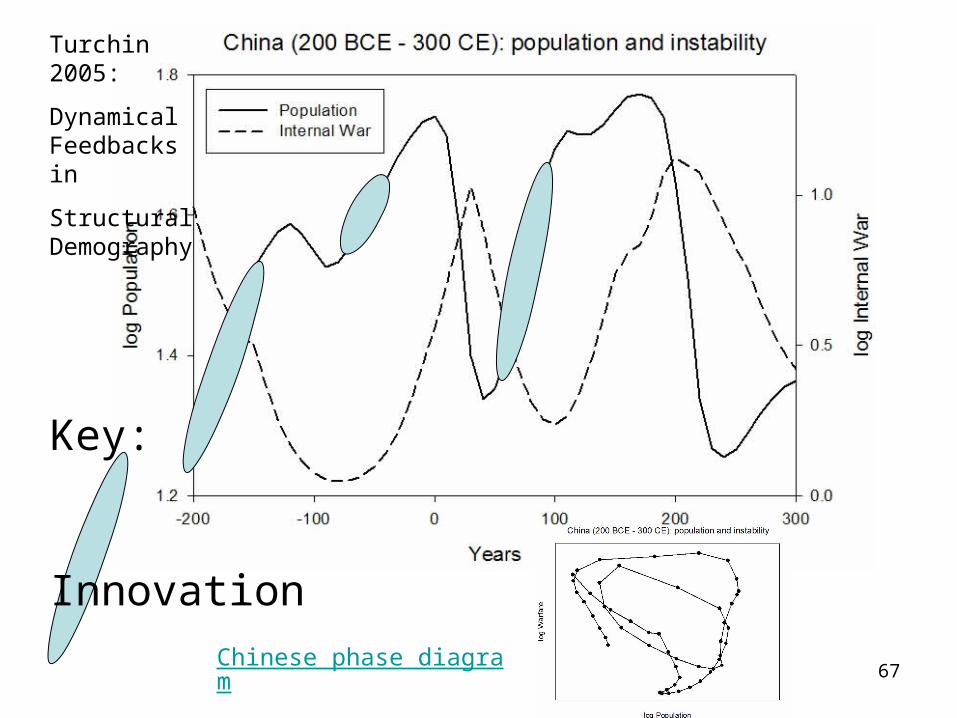
67Chinese phase diagram
Turchin 2005:
Dynamical Feedbacks in
Structural Demography
Key:
Innovation
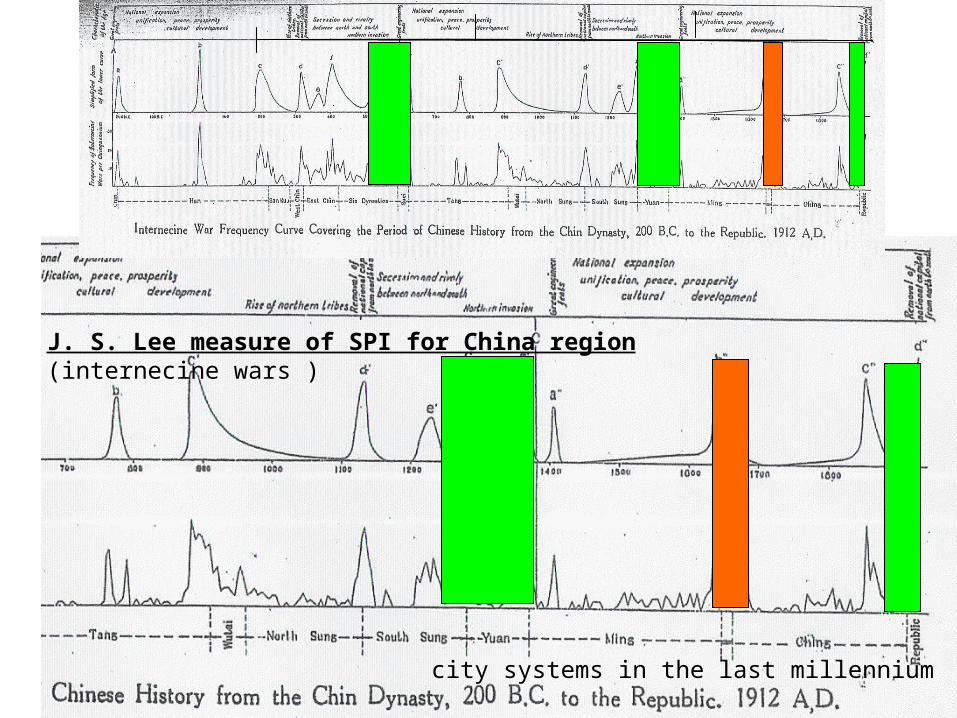
68city systems in the last millennium
J. S. Lee measure of SPI for China region (internecine wars )
69
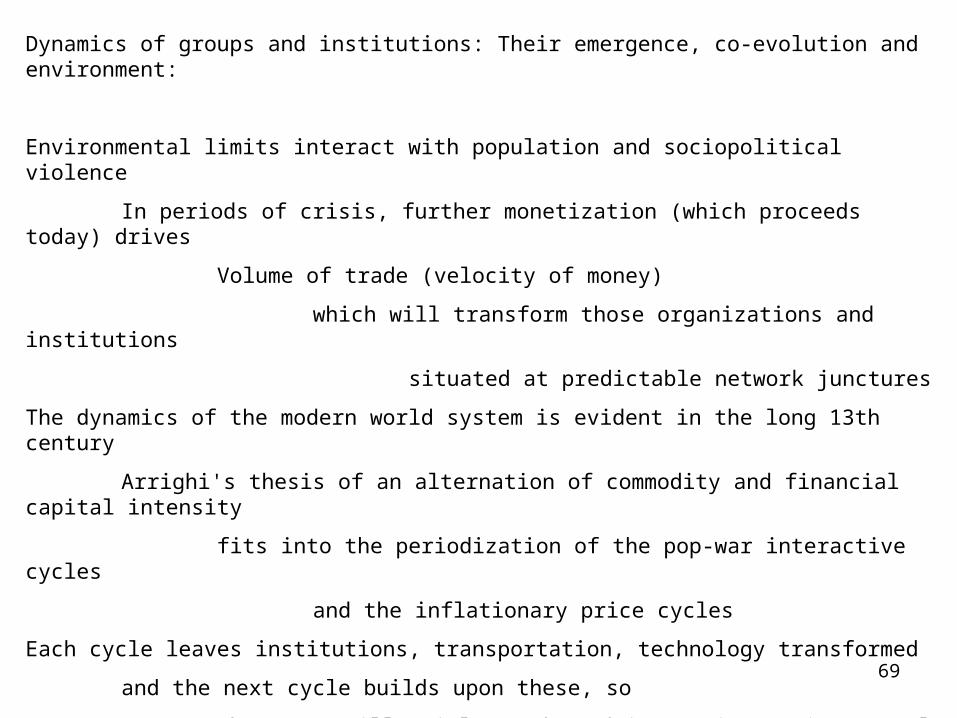
Dynamics of groups and institutions: Their emergence, co-evolution and environment:
Environmental limits interact with population and sociopolitical violence
In periods of crisis, further monetization (which proceeds today) drives
Volume of trade (velocity of money)
which will transform those organizations and institutions
situated at predictable network junctures
The dynamics of the modern world system is evident in the long 13th century
Arrighi's thesis of an alternation of commodity and financial capital intensity
fits into the periodization of the pop-war interactive cycles
and the inflationary price cycles
Each cycle leaves institutions, transportation, technology transformed
and the next cycle builds upon these, so
there are millennial trends and increasing environmental capacity
that also predict network-situated innovation
70
Cities in Historical Dynamics• Cities and their size distributions are affected by
agrarian empire metastabilty in 200+ year “secular” cycles of growth/decline in people/resource ratios leading internecine conflict cycles by ¼ cycle (+) feedback, conflict leads negative (-) feedback on people/resource ratios.
• Zipfian balanced “power law” distributions are not constant but metastable: tails are affected by global trade, smaller sizes by fluctuations in rural trade and land routes.
71city systems in the last millennium
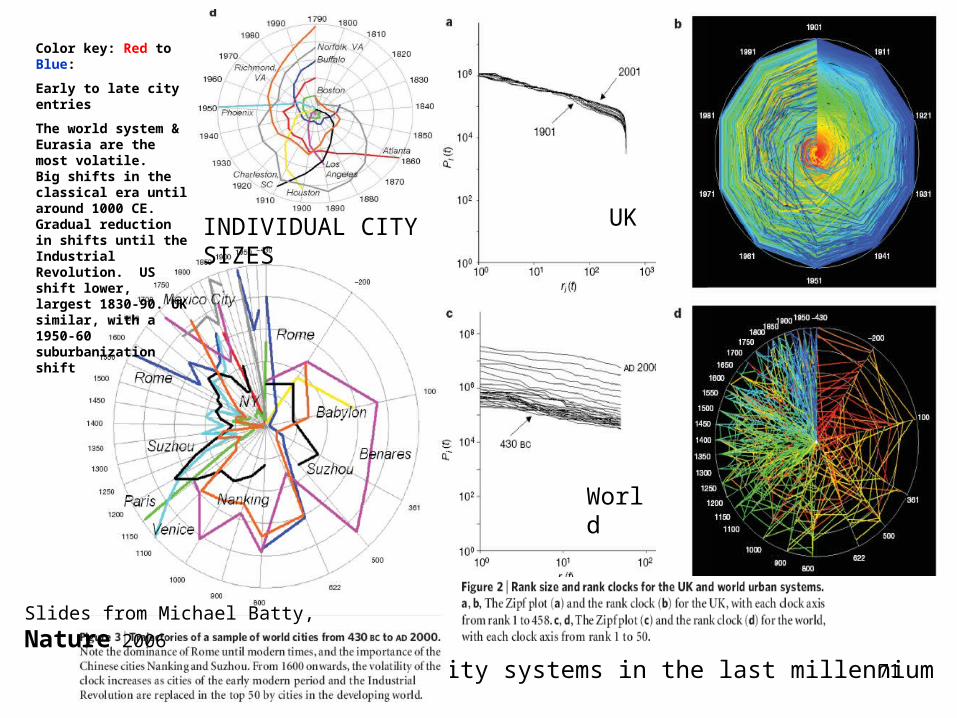
Color key: Red to Blue:
Early to late city entries
The world system & Eurasia are the most volatile. Big shifts in the classical era until around 1000 CE. Gradual reduction in shifts until the Industrial Revolution. US shift lower, largest 1830-90. UK similar, with a 1950-60 suburbanization shift
UK
World
Slides from Michael Batty, Nature 2006
INDIVIDUAL CITY SIZES
72
2019181716151413121110987654321
12
11
10
9
8
7
6
5
m1970m1950m1925m1914m1900m1875m1850m1825m1800m1750m1700m1650m1600m1575m1550m1500m1450m1400m1350m1300m1250m1200m1150m1100m1000
m900c1970c1950c1925c1914c1900c1875c1850c1825c1800c1750c1700c1650c1600c1575c1550c1500c1450c1400c1350c1300c1250c1200c1150c1100c1000c900
e1970e1950e1925e1914e1900e1875e1860e1825e1800e1750e1700e1650e1600e1575e1550e1500e1450e1400e1350e1300e1250e1200e1150e1100e1000e900ZipfCum
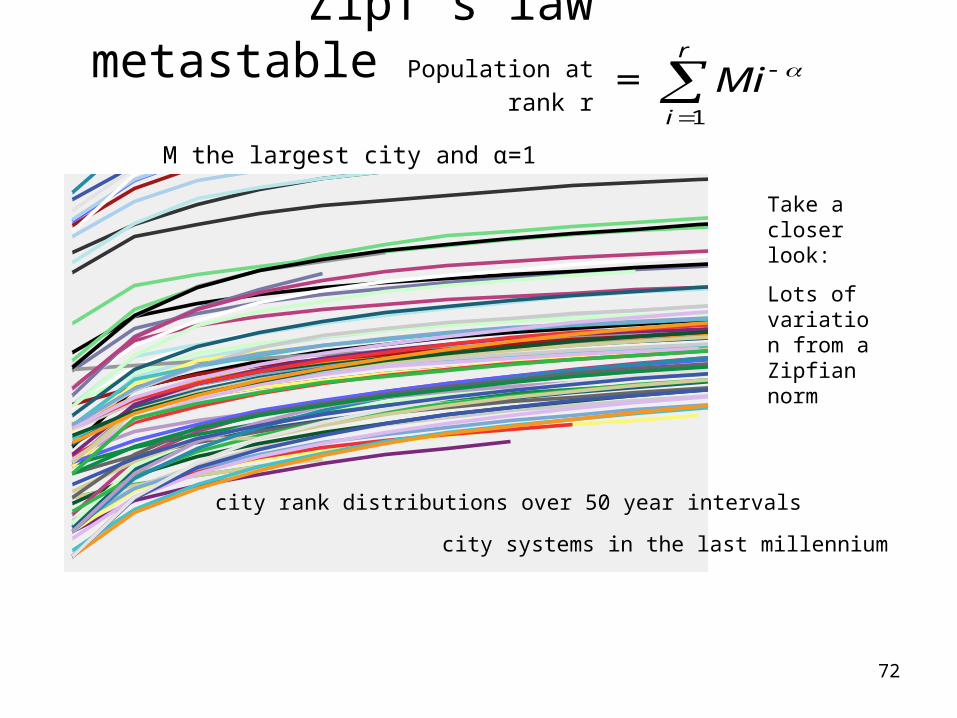
Zipf’s law metastable Population at rank r
M the largest city and α=1
city systems in the last millennium
city rank distributions over 50 year intervals
RTr =
r
i
Mi1
Take a closer look:
Lots of variation from a Zipfian norm
73
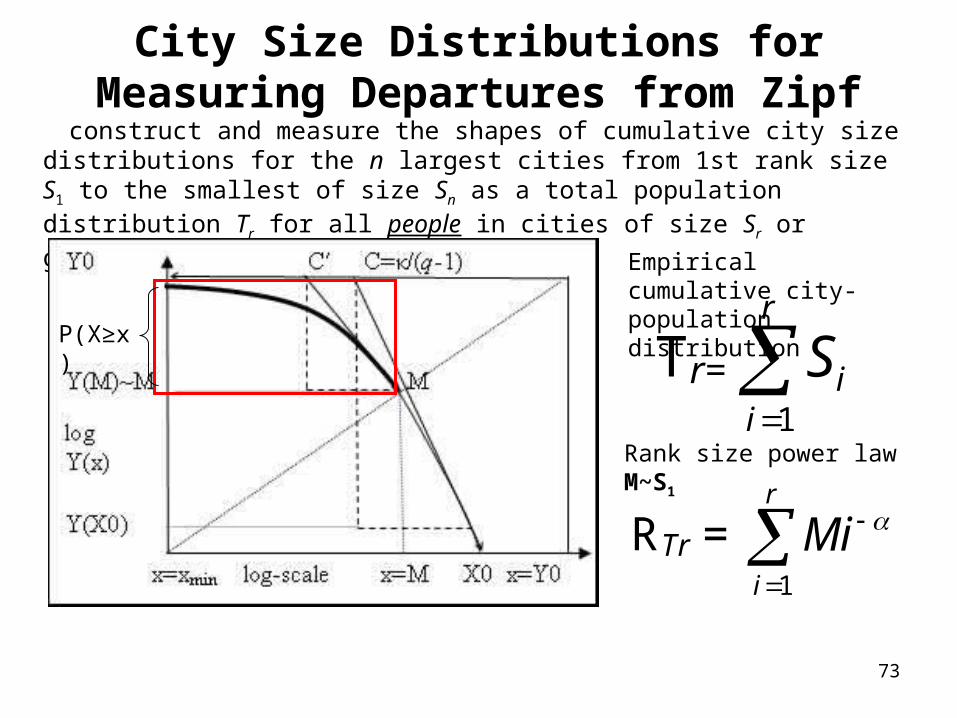
City Size Distributions for Measuring Departures from Zipf
construct and measure the shapes of cumulative city size distributions for the n largest cities from 1st rank size S1 to the smallest of size Sn as a total population distribution Tr for all people in cities of size Sr or greater, where r=1,n is city rank
Tr=
r
iiS
1
RTr =
r
i
Mi1
Rank size power law M~S1
Empirical cumulative city-population distribution
P(X≥x)
74
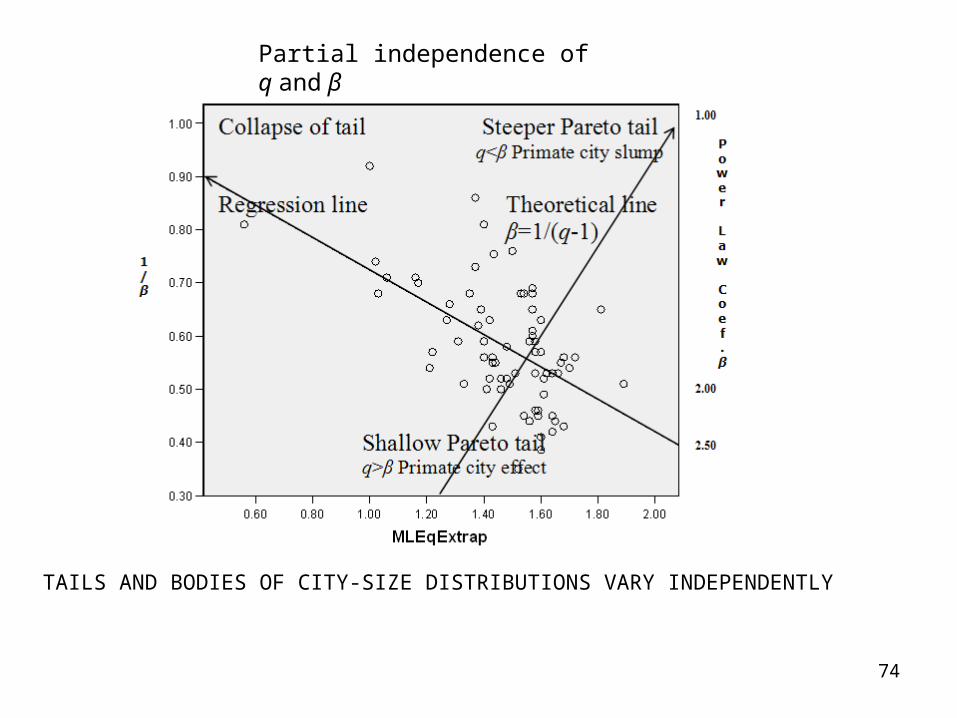
TAILS AND BODIES OF CITY-SIZE DISTRIBUTIONS VARY INDEPENDENTLY
Partial independence of q and β
75
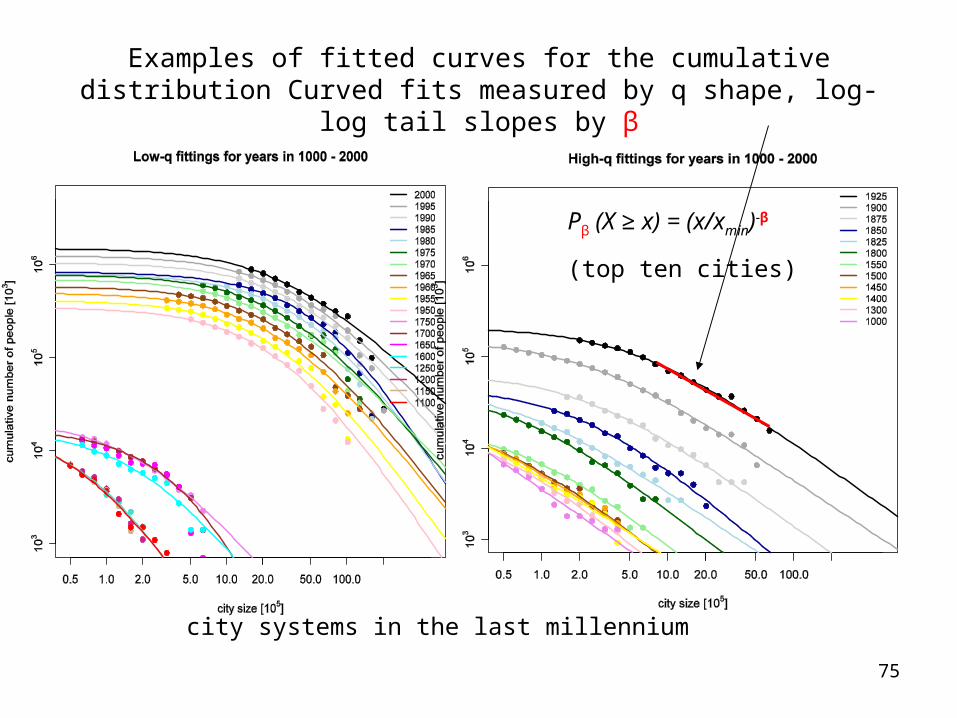
Examples of fitted curves for the cumulative distribution Curved fits measured by q shape, log-log tail slopes by β
city systems in the last millennium
Pβ (X ≥ x) = (x/xmin)-β
(top ten cities)
76
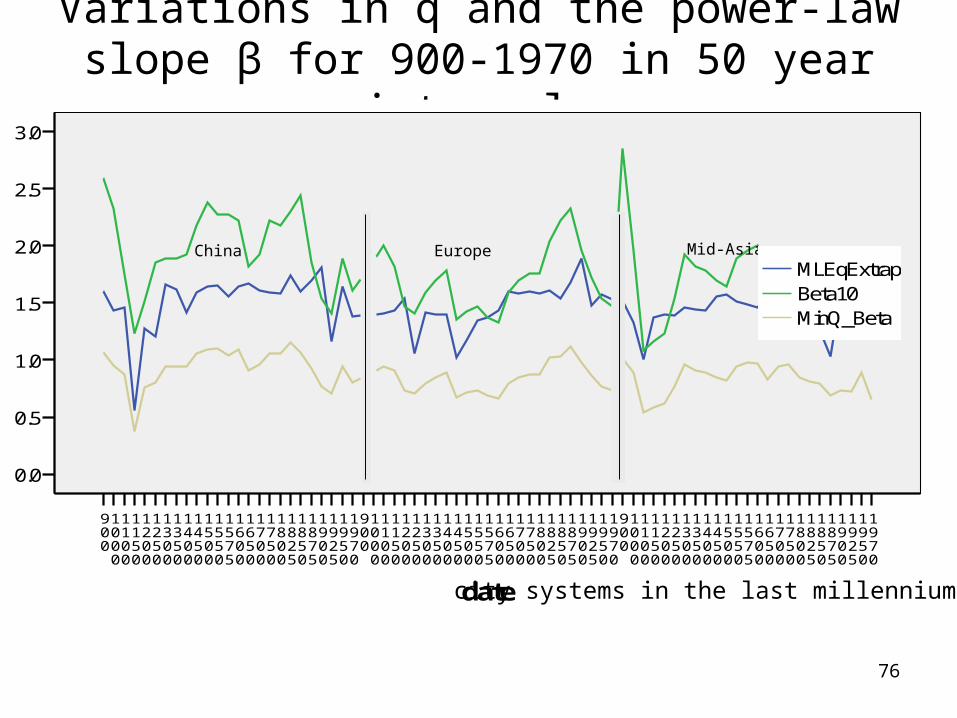
Variations in q and the power-law slope β for 900-1970 in 50 year
intervals
1970
1950
1925
1900
1875
1850
1825
1800
1750
1700
1650
1600
1575
1550
1500
1450
1400
1350
1300
1250
1200
1150
1100
1000
900
1970
1950
1925
1900
1875
1850
1825
1800
1750
1700
1650
1600
1575
1550
1500
1450
1400
1350
1300
1250
1200
1150
1100
1000
900
1970
1950
1925
1900
1875
1850
1825
1800
1750
1700
1650
1600
1575
1550
1500
1450
1400
1350
1300
1250
1200
1150
1100
1000
900
date
3.0
2.5
2.0
1.5
1.0
0.5
0.0
MinQ_BetaBeta10MLEqExtrap
China Europe Mid-Asia
1970
1950
1925
1900
1875
1850
1825
1800
1750
1700
1650
1600
1575
1550
1500
1450
1400
1350
1300
1250
1200
1150
1100
1000
900
1970
1950
1925
1900
1875
1850
1825
1800
1750
1700
1650
1600
1575
1550
1500
1450
1400
1350
1300
1250
1200
1150
1100
1000
900
1970
1950
1925
1900
1875
1850
1825
1800
1750
1700
1650
1600
1575
1550
1500
1450
1400
1350
1300
1250
1200
1150
1100
1000
900
3.0
2.5
2.0
1.5
1.0
0.5
0.0
MinQ_BetaBeta10MLEqExtrap
city systems in the last millennium
77
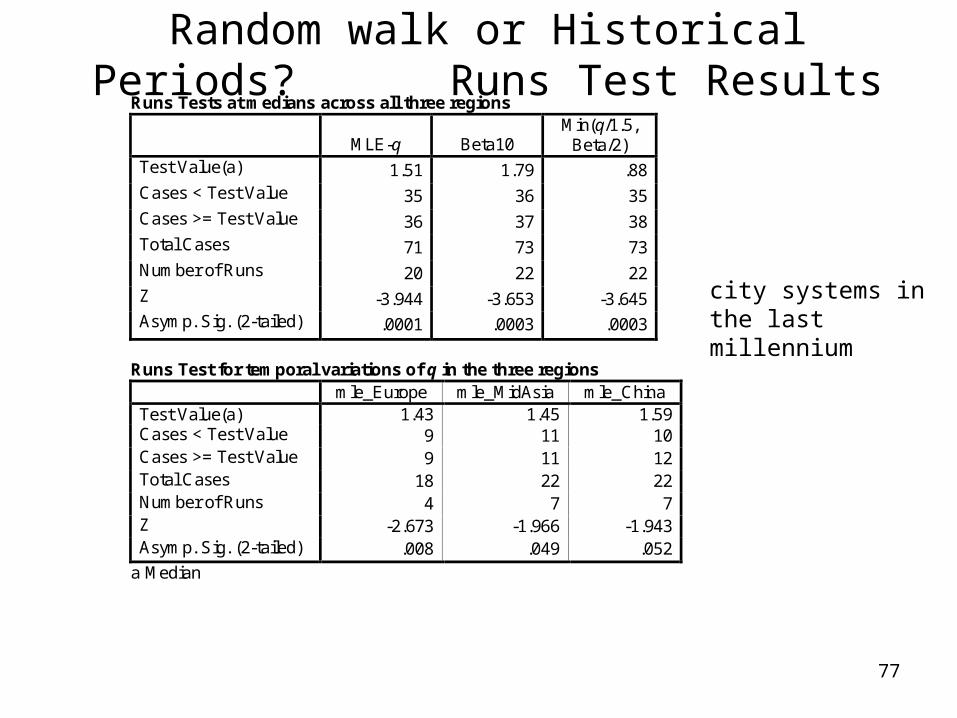
Random walk or Historical Periods? Runs Test Results
city systems in the last millennium
Runs Tests at medians across all three regions
MLE-q Beta10 Min(q/1.5,
Beta/2) Test Value(a) 1.51 1.79 .88 Cases < Test Value 35 36 35 Cases >= Test Value 36 37 38 Total Cases 71 73 73 Number of Runs 20 22 22 Z -3.944 -3.653 -3.645 Asymp. Sig. (2-tailed) .0001 .0003 .0003
Runs Test for temporal variations of q in the three regions mle_Europe mle_MidAsia mle_China Test Value(a) 1.43 1.45 1.59 Cases < Test Value 9 11 10 Cases >= Test Value 9 11 12 Total Cases 18 22 22 Number of Runs 4 7 7 Z -2.673 -1.966 -1.943 Asymp. Sig. (2-tailed) .008 .049 .052
a Median
78
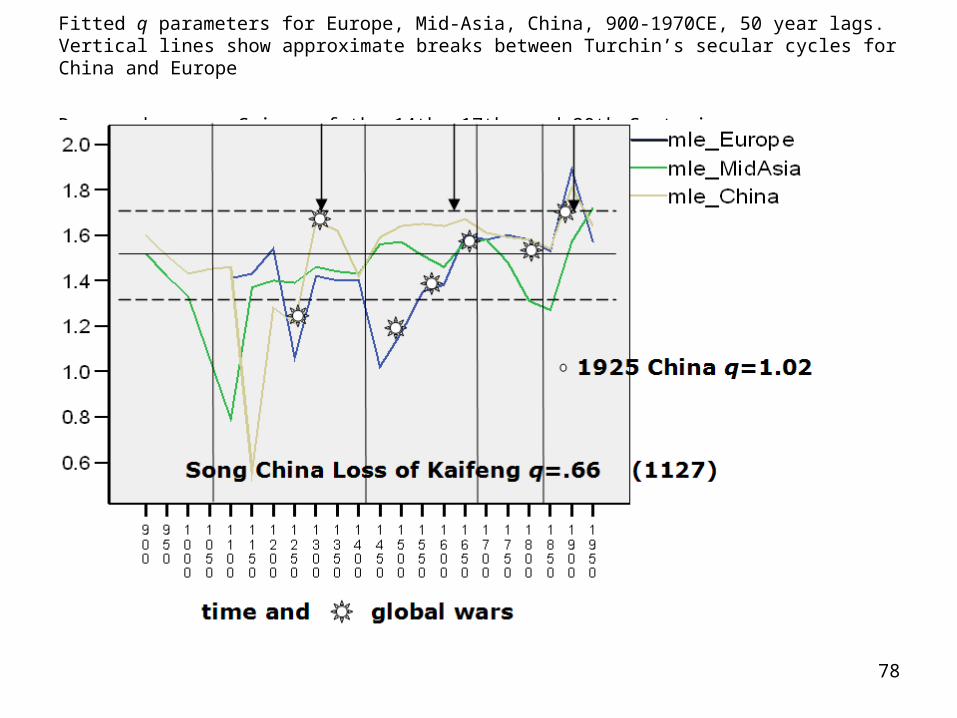
Fitted q parameters for Europe, Mid-Asia, China, 900-1970CE, 50 year lags. Vertical lines show approximate breaks between Turchin’s secular cycles for China and Europe
Downward arrow: Crises of the 14th, 17th, and 20th Centuries
79
76543210-1-2-3-4-5-6-7
Lag Number
0.9
0.6
0.3
0.0
-0.3
-0.6
-0.9
CC
F
logSilkRoad with EurBeta10
Lower Confidence Limit
Upper Confidence Limit
Coefficient
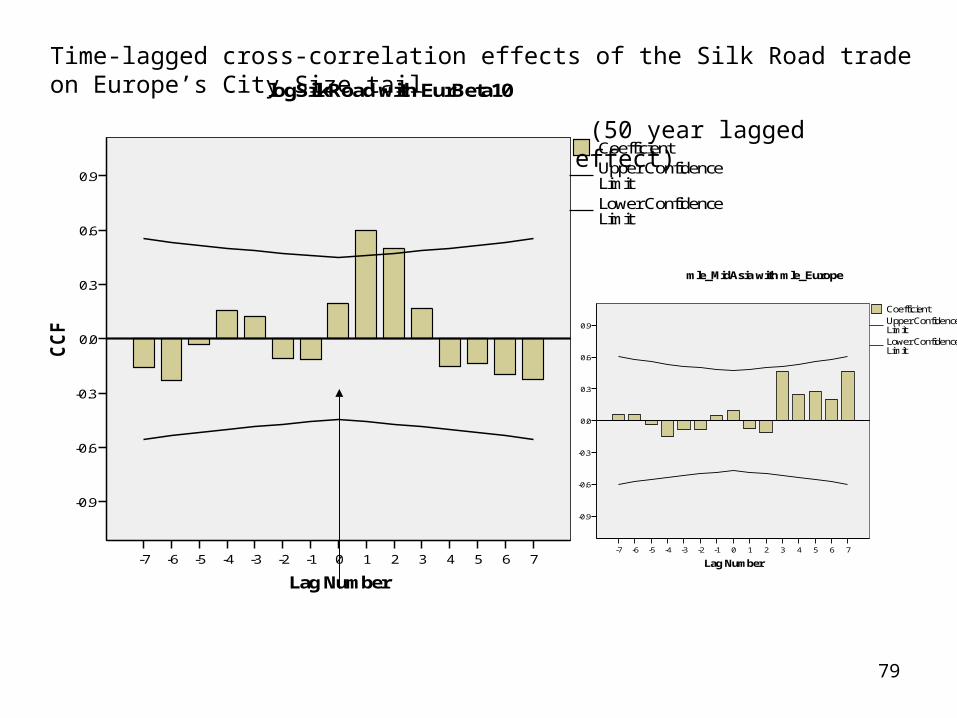
Time-lagged cross-correlation effects of the Silk Road trade on Europe’s City Size tail
(50 year lagged effect)
76543210-1-2-3-4-5-6-7
Lag Number
0.9
0.6
0.3
0.0
-0.3
-0.6
-0.9
CC
F
mle_MidAsia with mle_Europe
Lower Confidence Limit
Upper Confidence Limit
Coefficient
80
76543210-1-2-3-4-5-6-7
Lag Number
0.9
0.6
0.3
0.0
-0.3
-0.6
-0.9
CC
F
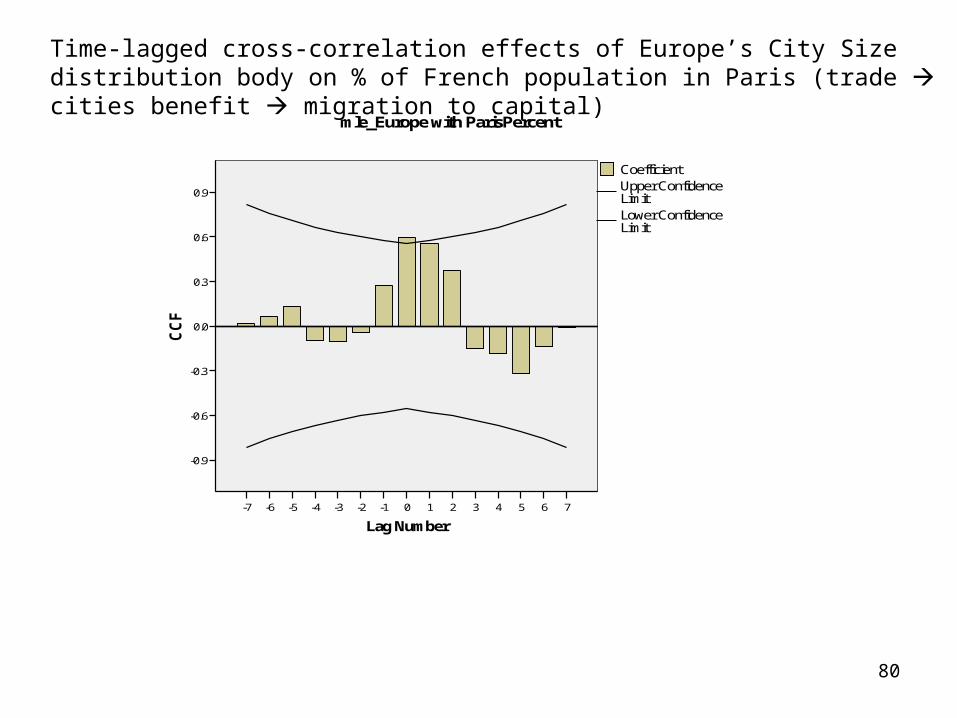
mle_Europe with ParisPercent
Lower Confidence Limit
Upper Confidence Limit
Coefficient
Time-lagged cross-correlation effects of Europe’s City Size distribution body on % of French population in Paris (trade cities benefit migration to capital)
81
76543210-1-2-3-4-5-6-7
Lag Number
0.9
0.6
0.3
0.0
-0.3
-0.6
-0.9
CC
F
SPIm with q
Lower Confidence Limit
Upper Confidence Limit
Coefficient
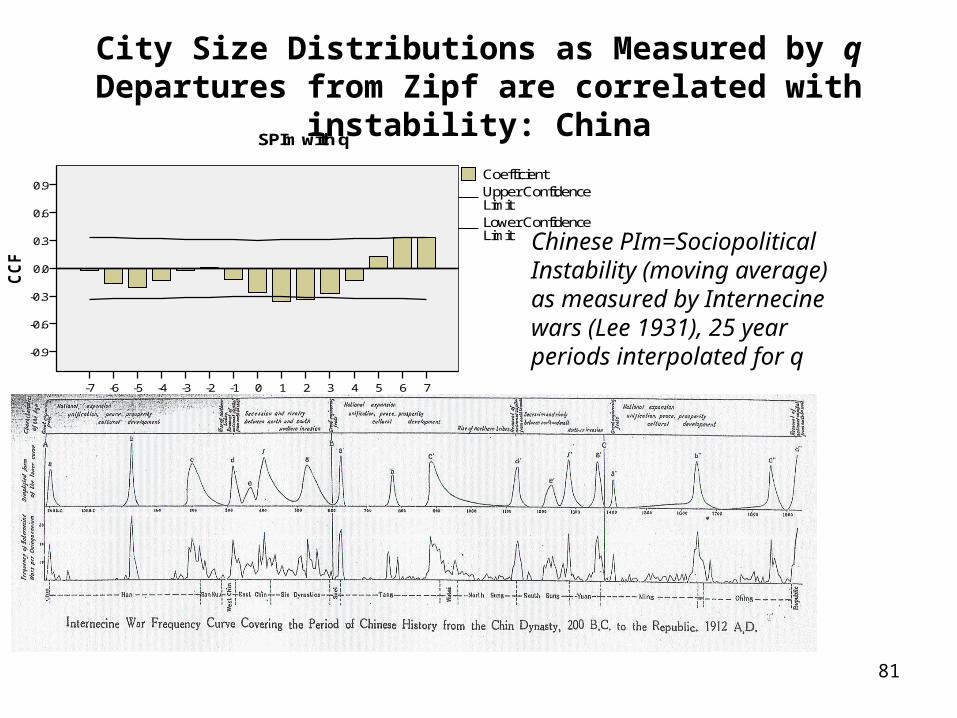
City Size Distributions as Measured by q Departures from Zipf are correlated with
instability: China
Chinese PIm=Sociopolitical Instability (moving average) as measured by Internecine wars (Lee 1931), 25 year periods interpolated for q
82
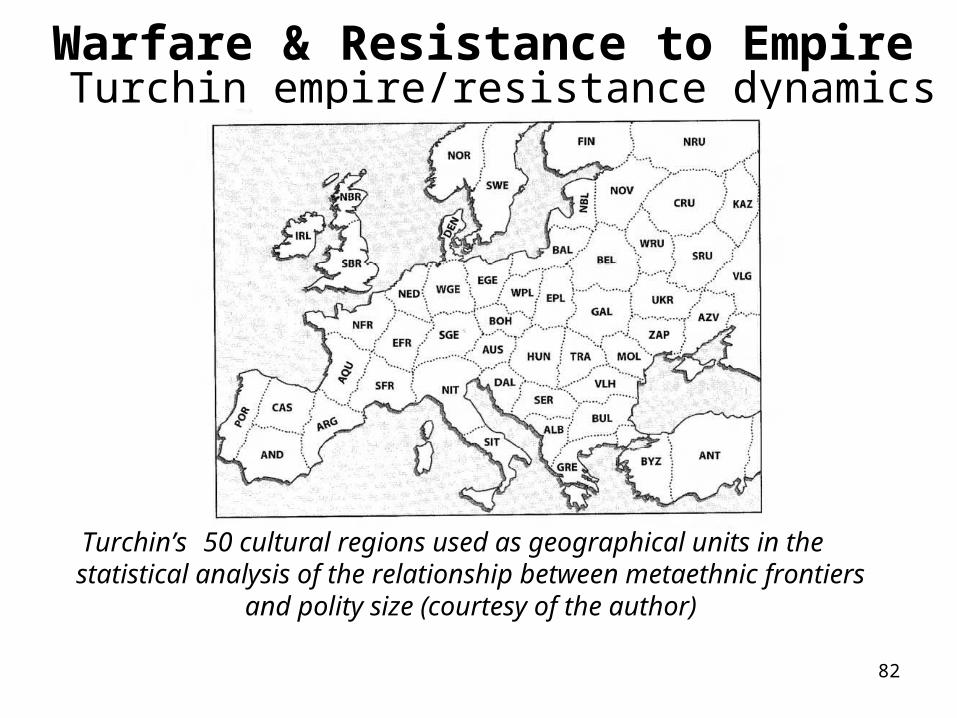
Turchin’s 50 cultural regions used as geographical units in the statistical analysis of the relationship between metaethnic
frontiers and polity size (courtesy of the author)
Turchin empire/resistance dynamicsWarfare & Resistance to Empire
83
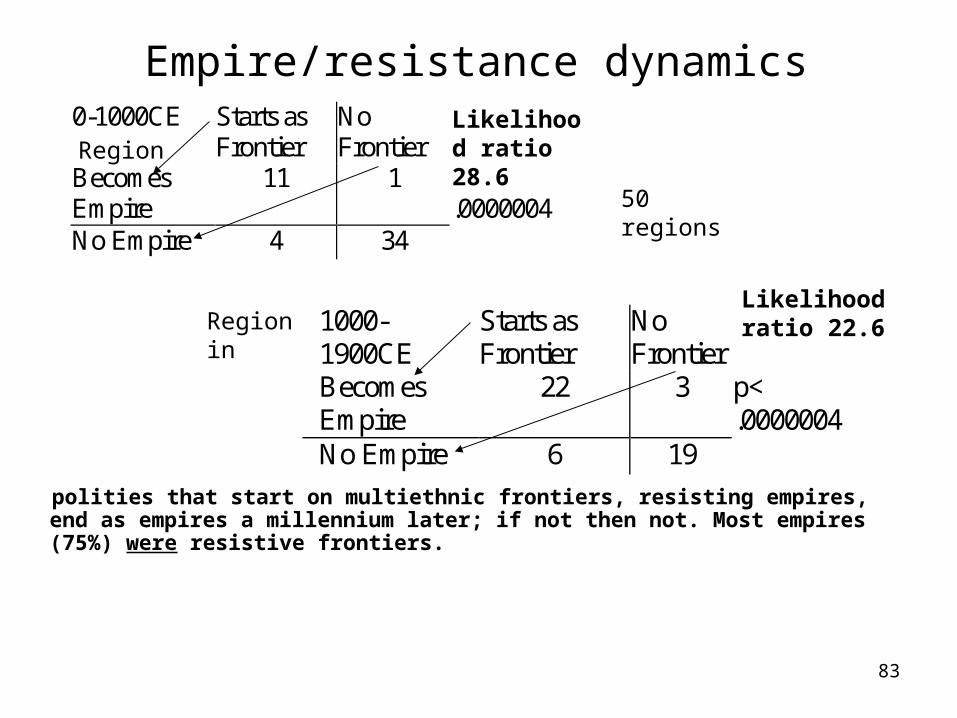
polities that start on multiethnic frontiers, resisting empires, end as empires a millennium later; if not then not. Most empires (75%) were resistive frontiers.
Empire/resistance dynamics
0-1000CE Starts as Frontier
No Frontier
50 regions
Becomes Empire
11 1 p< .0000004
No Empire 4 34
1000-1900CE
Starts as Frontier
No Frontier
Becomes Empire
22 3 p< .0000004
No Empire 6 19
Likelihood ratio 22.6
Likelihood ratio 28.6
50 regions
Region
Region in
84
Warfare & Resistance to Empire
• The scalability of decentralized cohesion can promote steady low-cost growth of counter-ethnic resistance movements over 100s of years; cohesion promotes the resistive counter-ethnicity bounded by the meta-ethnic frontier
• As a decentralized form of organization, growth of a k-cohesive group has no increase in cost with scale-up in size, simply that each new member has k links to those already in the group
• In the absence of such conflicts and boundaries, k-cohesion can spread and promote cooperation.
• A pity that Bush and Cheney chose war over diplomacy !
85
Kinship: in detail (workshop)
• This is where the structural cohesion studies began, with structural endogamy
• The implications turn out to be massive, global, and as relevant to understanding the global economy and global conflicts as in more localized anthropological studies.
• Kinship cohesion through time is decreasing locally in communities but increases at larger spatial scales and is transforming world ethnicities and cultures
86
5. Bicomponents (I), asmaximal sets of marriages, each pair
connected in two independent ways,…
... identify the boundaries of structural endogamy (& so - define a new term).
I focus on the consequences and causes of these units – part of the concrete implicate order of structural endogamy.
87
The idea of consequences is that structurally endogamous units define the local boundaries of
one or more concrete implicate order groups that gain cohesion or are the cause of cohesion,
such as: ethnicities, religious groups, community, social class, stayers versus
migrants, endo-clans, factions, regions of exchange, markets, etc. The consequences may
run from or to structural endogamy as implicated in the actions or activities of those
inside or outside the group.
88
Those Middle-Eastern Examples
showed marriages with relatives by common descent (here, same
patrilineage) and membership in a founding religious group (Judiasm).
So …
by way of contrast:

89


![Bayesian Causal Inference - uni-muenchen.de...from causal inference have been attracting much interest recently. [HHH18] propose that causal [HHH18] propose that causal inference stands](https://img.pdfslide.net/doc/110x75/5ec457b21b32702dbe2c9d4c/bayesian-causal-inference-uni-from-causal-inference-have-been-attracting.jpg)