Embed Size (px)
Citation preview

1 LITERATURE REVIEW
1.1 Introduction
Palm oil is an edible oil derived from the fruits of the oil palm Elaeis guineensis (Siew,
2002). Palm olein is one of the major palm oil products that domestically and industrially
used as cooking/frying oil. The functions of frying oils are to transfer heat to cook foods
and to produce characteristics of fried-food flavor.
The major advantage of palm olein is its high stability during frying that produced
minimum amount of breakdown products in an acceptable level. Study conducted by Azmil
and Siew (2008) shows that palm oil, single-fractionated palm olein and double-
fractionated palm olein were more stable than high oleic sunflower oil after 80 hours of
heating at 180 °C. These palm products also produced lower amount of free fatty acids,
polar and polymer compounds, as well as preserved higher smoke points and tocols content.
However, palm olein tends to crystallize at low temperature that limits its usage in
temperate countries.
In spite of various nutritional studies, palm olein is not well considered as a recommended
choice due to its higher saturation content. Against this factor, there is a need to reduce its
saturation content, so as to enhance its versatility in applications for market penetration in
cold countries as well as cater to market trends. Generally, the saturation content of palm
olein can be reduced by multistage fractionation of palm olein. However removal of
saturation in palm olein is difficult due to the difficulty in controlling the crystallization of
palm olein (Gijs et al., 2007a). Other than that, blending palm olein with other soft
vegetable oils such as canola oil, cottonseed oil, rice bran oil, sunflower oil, soybean oil etc

2
is implemented to reduce the saturation level of palm olein and for frying purposes in
temperate countries (Razali and Nor‟aini, 1994). In fact, blending of palm olein may also
enhance the stability and frying performance of the oil.
In this study, palm olein is modified by enzymatic interesterification and dry fractionation
to reduce the saturation content of the oil. Enzymatic interesterification enables interchange
of acyl groups between and within triacylglycerols (TAGs) at specific positions to form
new TAG species that have high melting TAGs, PPP and PPS. These saturated TAGs that
causes the crystallization of palm olein, can be removed as stearin during fractionation.
Two sn-1,3 specific immobilized lipases; Lipozyme® TL IM (Thermomyces Lanuginosa)
and Lipozyme® RM IM (Rhizomucor Miehei) are selected as biocatalysts for
interesterification in solvent-free system (Appendix A and B). Palm olein has been chosen
as the feedstock due to its higher unsaturation content compared to palm oil. Two types of
new palm oil products can be derived from this study; the low saturation palm liquid oils
and the respective stearin fractions.
1.2 The Objectives of the Studies
The main objective of the studies was to prepare pure palm-based products with low
saturation, via enzymatic interesterification of palm olein with iodine value (IV) of 62
follow by dry fractionation, as well as to characterize the physicochemical properties of the
products. Besides, the efficiency of the lipases; Rhizomucor Miehei (Lipozyme® RM IM)
and Thermomyces Lanuginosa (Lipozyme® TL IM) in the interesterification reaction will
also be looked into. Optimization of the interesterification reactions and dry fractionation
will also be carried out.

3
1.3 Chemical Properties of Palm Oil
Palm oil consists of mostly glyceridic materials with some non-glyceridic materials in trace
amount (Chong, 1994). TAG is the most abundant glyceridic component in palm oil which
comprises of triesters of high aliphatic acids or fatty acids, while monoacylglycerol (MAG)
and diacylglycerol (DAG) are the minor glyceridic components in palm oil. The chemical
structures of partial acylglycerols (MAG and DAG) and TAG were shown in Figure 1.1.
Figure 1.1
Partial acylglycerols and TAG molecules structures (Naudet, 1996)
H2C
CH
H2C
OH
ROCO
OH
H2C
CH
H2C
OCOR
HO
OH
H2C
CH
H2C
OH
HO
OCOR
H2C
CH
H2C
OCOR
HO
OCOR
H2C
CH
H2C
OCOR
ROCO
OH
H2C
CH
H2C
OH
ROCO
OCOR
H2C
CH
H2C
OCOR
ROCO
OCOR
TAGs are esters formed from glycerol acylation of three fatty chains, while acylation with
one or two fatty chains formed partial acylglycerols (MAG and DAG). The hydrocarbon
chains in the ester group, R could be varied in terms of carbon number and the chemical
structure (bend structures for unsaturated fatty acids) (Chong, 1994). The physicochemical
properties of the oil could be due to the types of fatty acid presence, and the manner in
which fatty acids combine to form various TAG molecules (Naudet, 1996). In general, the
hydrophobic nature of oil is due to the long fatty acid chains in the glyceridic materials.
2-monoacylglycerol (β) 1-monoacylglycerol (α) 3-monoacylglycerol (α’)
1,3-diacylglycerol 1,2-diacylglycerol 2,3-diacylglycerol Triacylglycerol

4
The Fatty Acids Composition of Palm Oil
For palm oil, the fatty acids composition falls within a very narrow range from twelve to
twenty carbon number, with a balanced fatty acids composition between saturation and
unsaturation (Berger, 2001).
Table 1.1 shows the common name, systematic name, shorthand name of fatty acids
presence in palm oil and its fatty acid composition. In most vegetable oils, the sn-2
position fatty acids of TAGs are preferentially occupied by unsaturated fatty acids such as
oleic acid and linoleic acid. Saturated fatty acid (SFA) (e.g. palmitic acid) is found in the
sn-2 position of animal fats TAGs for instance lard, tallow etc (Naudet, 1996). Although
palm oil contains high quantity of SFA, the sn-2 position fatty acids in the TAGs is
preferably occupied by unsaturated fatty acids (mainly oleic acids) (Naudet, 1996; Nor Aini
and Noor Lida, 2005).
Table 1.1
Common name, Systematic name, Shorthand name of fatty acids in palm oil and its fatty acid
compositions (Sean, 2002; Siew, 2002)
Common name Systematic name Shorthand FAC
Lauric Dodecanoic 12:0 0.1-0.4
Myristic Tetradecanoic 14:0 1.0-1.4
Palmitic Hexadecanoic 16:0 40.9-47.5
Palmitoleic Cis-9-Hexadecenoic 16:1ω7 0-0.4
Stearic Octadecanoic 18:0 3.8-4.8
Arachidic Eicosanoic 20:0 36.4-41.2
Oleic cis-9-Octadecenoic 18:1ω9 9.2-11.6
Linoleic cis-9, cis-12, Octadecadienoic 18:2ω6 0-0.6
Linolenic cis-9, cis-12, cis-15-Octadecatrienoic 18:3ω3 0-0.4
The Chemical Functions of Ester Groups in Oil Molecules
Glycerides or acylglycerols are made up of esters that attached to the glycerol backbone. In
natural oils and fats, ester groups account for 90% to 96% of the overall molar mass of

5
TAGs (Naudet, 1996). The ester groups in TAG play an important role in the chemical and
physical properties of the oil. For saturated TAG, the fatty acids have straight chains that do
not contain any special chemical functional group. Only carboxylic group in TAG
molecules can act as the functional group for chemical reactions. The carbonyl/ester group
of the TAGs can take place in many chemical reactions by inducing a special reactivity at
the α-carbon (Ucciani and Debal, 1996). Figure 1.2 shows the nucleophilic behavior of the
carbonyl carbon and the acidity behavior of hydrogen at the α-carbon (Rousseau and
Marangoni, 2002).
Figure 1.2
The chemical functional of acyl group in TAG
O
C
C
O
H
R
H
acidic hydrogen
O
C
R
O
120o
f lat plane structure ofcarbonyl carbon in TAG
The electronegative oxygen pulls away electrons pair from the carbonyl carbon that lead to
partial positive charge on the carbon. This partial positive charge carbon can easily attack
by nucleophiles. In addition, the sp2 orbital of carbonyl carbon with flat plane structure may
permit easier access of nucleophiles to the carbonyl carbon. The electronegative behavior
of oxygen that attached to the carbonyl carbon may also increase the acidity of the
hydrogens that attached to the α-carbon (Rousseau and Marangoni, 2002).These ester
groups in the TAGs are responsible for several chemical reactions during modification of
oils and fats, including alcoholysis, interesterification, reduction (hydrogenolysis),
hydrolysis and saponification (Ucciani and Debal, 1996).

6
1.4 Physical Properties of Palm Oil
The physical properties of oils and fats are mainly referred to the melting and
crystallization behavior with regards to the TAGs compositions. Melting and crystallization
behavior of TAGs are very dependent on two factors; chemical structures and polymorphic
behavior (Birker and Padley, 1987). The knowledge of palm oil physical properties is one
of the key points for the development of palm oil fractionation technology, especially the
crystallization selectivity (Kellens et al., 2007). Crystallization selectivity is referred to the
degree of compatibility of the different TAGs in the solid state. Most of the studies for
fractionation are mainly focus on the effects of cooling conditions that affecting the
crystallization selectivity (Kellens et al., 2007).
Solid fat content (SFC), slip melting point (SMP), cloud point (CP), melting and
crystallization properties by differential scanning calorimeter, crystals polymorphism
studies by X-rays diffraction etc are common methods used to determine the physical
properties of palm oil products.
1.4.1 Polymorphism of Fat Crystals
Crystallization can be studied by determined the crystal polymorphism and SFC of the fat
blend. Combination of differential scanning calorimeter (DSC), X-ray diffraction is used to
study the fat crystal polymorphism. There are total of seven crystals system in fat
crystallization, including triclinic, orthorhombic, hexagonal, cubic, tetragonal,
rhombohedral, and monoclinic; only three predominate in the crystalline TAGs (Figure 1.3).

7
Figure 1.3
Schematic representations of hexagonal, orthorhombic perpendicular and triclinic parallel
subcells (Adapted from Lawler and Dimick, 2002)
The most stable form of TAG crystals is triclinic subcell with parallel hydrocarbon-chain
planes, followed by orthorhombic perpendicular-subcell with orthorhombic structure with
perpendicular chain phases. Hexagonal is the subcell with no specific chain plane
conformation, with the lowest stability and the highest Gibbs free energy (Lawler and
Dimick, 2002).
Crystallization of palm oil is a complex process due to the existence of multiple
polymorphic components including α, β‟ and β types of polymorphic crystals (Lawler and
Dimick, 2002). The formation of different type polymorphic crystals is depended on the
cooling rate during crystallization. Rapid cooling of the melt will result in α crystals
formation (hexagonal structure) which is very fine and unstable (Lawler and Dimick, 2002).
Slow crystallization with long induction time (thermocycling process) of palm oil formed β
crystal (triclinic parallel structure) which is very stable (Lawler and Dimick, 2002). For
good separation during fractionation, β‟ crystal (orthorhombic perpendicular structure) is
preferred. The formation of stable β‟ crystal in palm oil has resulted in the addition of palm
oil into shortening and margarine formulation (Lawler and Dimick, 2002).
Hexagonal Orthorhombic perpendicular Triclinic parallel

8
1.5 Oils and Fats Modification
The natural oils and fats either from plants or animals may not necessary ideal for ultimate
human used. Hence, the natural products may have to be modified. Oils and fats are
normally modified to obtain a product with desired properties either nutritional or physical
properties (Gunstone, 2001a). Procedures used for lipid modification are blending,
distillation, fractionation, hydrogenation, and interesterification (by chemical catalyst or
enzymic catalyst), as well as development of new oils and fats sources by biological
approach (Gunstone, 2001b). Amongst these modification methods, blending, fractionation,
hydrogenation and interesterification are the most common processes used in oils and fats
industries. Blending and fractionation are physical processes that do not involve any
chemical reactions. Whereas hydrogenation and interesterification involved chemical
reactions in the fatty acids hydrocarbon chain and the carboxylic group in the TAGs,
respectively.
Blending is one of the most important processes in the oils and fats industries to improve
nutritional or physical properties. The process involved mixing of two or more oils in order
to combine desirable nutritional and physical properties (Gunstone, 2001b). The concept of
blending is applied in several commercial products such as Naturel® cooking oil from Lam
Soon Sdn. Bhd. that involved blending of sunflower oil with canola oil. This product is
available in Malaysia and Singapore markets.
Hydrogenation is used to harden liquid oils which contain high percentage of unsaturation
fatty acids. In this process, double bonds are eliminated by addition of hydrogen in the
presence of nickel or another metallic catalyst which results in a more saturated fat
formation (Faul, 1996; Mohd Suria Affandi, 1996; Gunstone, 2001b). Partial hydrogenation

9
of liquid oil is potential to obtain a very specific melting profile product. The main
disadvantage of partial hydrogenation is the formation of trans fats by isomerisation of cis
unsaturated fatty acids. Such trans acids raise the melting point without any uptake of
hydrogen or IV changed. Some nutritionists reported that trans fatty acids may bring
negative impact to human health.
1.5.1 Interesterification
Interesterification is one of the most important processes commonly used for oil
modification. Interesterification allows the modification of the physical properties (melting
behaviors), so as the chemical and nutritional properties of the oils and fats (Ucciani and
Debal, 1996; Lampert. 2000). Interesterificcation is one of the processes that involved
chemical reaction of the carboxylic group in the TAG molecules. It is a reversible reaction
which requires presence of a catalyst to reach the equilibrium condition (Ucciani and Debal,
1996). In a mixture of TAGs, the acyl group of the TAGs can be redistributed in two modes;
the intramolecular mode and the intermolecular mode (Ucciani and Debal, 1996).
The intramolecular mode:
2R1R2R3 R1R3R2 + R3R1R2
The intermolecular mode:
R1R1R1 + R2R2R2 R1R1R2 + R2R2R1
Interesterification can be defined as the rearrangement of acyl groups between esters at
specific or non-specific positions of the glycerol backbone, without any changes in the fatty
acids composition (Faur, 1996). Interesterification of food lipid can be divided into four
classes of reactions which are acidolysis, alcoholysis, glycerolysis and transesterification

10
(ester-ester exchange) (Yang and Xu, 2001; Rousseau and Marangoni, 2002). Acidolysis
involves the reaction between fatty acids and triacylgycerol; alcoholysis involves the
reaction between alcohol and triacylglycerol; glycerolisis is an alcoholysis process that
involves the reaction between glycerol and triacylglycerol in which glycerol act as an
alcohol in the reaction; transesterification is an ester-ester exchange that is a reaction
between an ester such as triacylglycerol or ethyl ester and another ester specifically or non-
specifically (Yang and Xu, 2001; Willis and Marangoni, 2002). Interesterification can be
achieved by mean of chemical catalysts or enzymes (lipases).
1.5.1.1 Chemical Interesterification
Chemical interesterification process involves a complete positional randomization of the
acyl groups in the TAG (non-specifically) (Willis and Marangoni, 2002). This process is
mainly used to alter the physical properties of the oil to produce hard base-stocks such as
margarine and shortening (Sreenivasan, 1978; Lampert, 2000; Willis and Marangoni, 2002).
Chemical interesterification has raised the interest of the nutritionists since it produce zero
trans fatty acids. Therefore it is a potential reaction to replace partial hydrogenation process
in preparation of hard-based stock (Gunstone, 2001b). Chemical interesterification is also
advantage in terms of safety because it does not require the use of explosive gas (hydrogen),
which is used in partial hydrogenation. In financial point of view, the processing cost of
chemical interesterificaiton is about the same as partial hydrogenation (Gunstone, 2001b)
that added the interest of the industries to use chemical interesterification.
A few commercial reactors that commonly used for chemical interesterification are
discontinuous tank method (batch process) and continuous interesterification, as shown in
the Figure 1.4 (Sreenivasan, 1978; Faul, 1996).

11
Figure 1.4
(A) Discontinuous tank method (batch); (B) Continuous interesterification reactor
In the industries, chemical interesterification is usually conducted by using chemical
catalyst such as sodium/potassium alloys and the alkali methoxides/ethoxides (Naudet,
1996, Petrauskaité et al., 1998; Lampert, 2000). The amount of alkali metal usually used for
the reaction is at level of 0.1 to 0.2 %, and 0.2 to 0.3% for sodium alcoholate (sodium
methoxide) catalyst (Gunstone, 2001b; Ucciani and Debal, 1996). Heating at temperature of
80 to 130 °C is required for the reaction (Ucciani and Debal, 1996). The reaction rate of
chemical interesterification is extremely fast, which requiring only a few minutes
(Petrauskaité et al., 1998). Some literatures reported that 15 to 60 minutes is required to
achieve equilibrium distribution in chemical interesterification (Ucciani and Debal, 1996;
Petrauskaité et al., 1998). Therefore, the degree of interesterification cannot be controlled in
A
B

12
chemical interesterification (Petrauskaité et al., 1998). In other words, the reaction must to
be completed to produce fully randomized products (Petrauskaité et al., 1998). For
chemical interesterification, the distribution of fatty acids of TAGs products can be
calculated statistically (Ucciani and Debal, 1996). About 2-4% of monoalcohol esters (e.g.
fatty acids methyl ester) were formed in the reaction; depending on the quantity of catalyst
used (Ucciani and Debal, 1996).
The effects of chemical interesterification on the physicochemical properties of oils and fats
have been studied in many literatures (Sreenivasan, 1978; Zeitoun et al., 1993; David, 1998,
Norrizah et al., 2003). These literatures reported that chemical interesterification can
randomize the fatty acids distribution in the TAGs, increase the SFC, as well as change the
crystal morphology and polymorphism behaviors of the oil.
1.5.1.1.1 Mechanism of Chemical Interesterification
There are two mechanisms of chemical interesterification; carbonyl addition and Claisen
condensation, both of them have been discussed in the literature (Sreenivasan, 1978;
Lampert, 2000; Rousseau and Marangoni, 2002). The chemical behavior of the carbonyl
group of TAG is important in explaining the reaction mechanism as discuss in the section
1.3.
Carbonyl Addition
The principle behind carbonyl addition mechanism is based on the partial positive charge
behavior of the carbonyl carbon that allowed the attack of methoxide anion. Carbonyl
addition mechanism can be divided into a few stages. The first stage involved the formation
of glycerate ion that also known as glycerylate anion (Rousseau and Marangoni, 2002).

13
According to Ucciani and Debal (1996), Rousseau and Marangoni (2002), glycerate ion or
metal derivative of a DAG is the real catalyst in chemical interesterification rather than the
alcoholate ion. This is because the alcoholate ion is continuously consumed during the
reaction.
Initially alcoholate ion acts as a nucleophile to attack the partial positive charge carbonyl
carbon and thus added into the carbonyl group in the TAGs (Ucciani and Debal, 1996;
Lampert, 2000; Rousseau and Marangoni, 2002). A fatty acid methyl ester is released with
every formation of glycerate ion. Intramolecular esterification (also known as
intraesterification may take place in the glycerate ion molecule by formation of a cyclic
intermediate compound (Ucciani and Debal, 1996). The new glycerate ion that has been
formed will then participate in another ester-ester exchange reaction either by
intramolecular or intermolecular way that contribute to the positional randomization of acyl
groups in the TAGs. Figure 1.5 shows the relocation of the 2-position acyl group to the 3-
position of the TAGs.
The intramolecular process involved formation of a tetrahedral dimer as the intermediate
compound (Ucciani and Debal, 1996; Rousseau and Marangoni, 2002). This transition
complex will decompose, either by regenerating the original species or to form a new TAG
species together with a new glycerate ion (Rousseau and Marangoni, 2002). In other words,
a new TAG species may not necessary to be formed. This process continues until all
available fatty acids have exchanged positions to obtain an equilibrium composition
(Rousseau and Marangoni, 2002).

14
Figure 1.5
Mechanism of chemical interesterication via carbonyl addition; (A) Intramoleculer
esterification and (B) Interemoleculer esterification (Ucciani and Debal, 1996)
R3
O
O
O
O
O
R2
R1
OMe
O
R3OCO
OCOR2
O OMe
O R1
R1COOMe
R3OCO
O
O
O
R2
R3OCO
O
O
O
R2
R3COO
O
O
O
R2
(- FAME)
Glycerate ion
Intramolecular esterif ication
Glycerate ion
O
OCOR3
OCOR2 +
O
OCOR3
OCOR2
O
R2OCO
R1OCO
O
R3 O
R2OCO
R1OCO
OR3
Intermediate tetrahedraldimer formation
OCOR3
OCOR3
OCOR2 +
O
R2OCO
R1OCO
Claisen Condensation
Another mechanism of chemical interesterification is Claisen condensation (through
enolate formation) (Rousseau and Marangoni, 2002) that shown in Figure 1.6. This reaction
mechanism on oils and fats has been reviewed comprehensively in the literatures (Rousseau
and Marangoni, 2002). Fundamental organic chemistry of Claisen condensation
mechanismin of the carbonyl group has been found in some organic chemistry literatures
such as (McMurry, 2004; Solomons, 2004a). The principle of Claisen condensation
mechanism is based on the acidic behavior of the hydrogen that attached to α-carbon
(section 1.3) (Lampert, 2000).
(A)
(B)

15
Figure 1.6
Mechanism of Claisen condensation: (A)Enolate formation, (B) Carbanion formation
R1OCO
OCOR2
O C
O
C R
H
H
OMe
R1OCO
OCOR2
O C
O
C R
H
+ MeOH
carbanion
R1OCO
OCOR2
O C
O
C R
H
enolate
O C
O
CH2R1
OCCR2
H
O
O C
O
CH2R1
OCCR2
H
O
OC
O
CH2R1
OCCR2
H
O+
carbaniontetrahedral intermediate
-keto ester intermediate
Glycerate ion
The acidic hydrogen from the α-carbon has taken out by the methoxide anion and released
as methanol. The carbanion formed can be transformed into a stable resonance structure
known as enolate anion (Solomons, 2004a) to attack other carbonyl group. A β-keto ester
intermediate and a glycerate ion are formed from a tetrahedral intermediate that combined
two TAGs (Rousseau and Marangoni, 2002; Solomons, 2004a). Once the glycerate ion is
formed, it is then free to attack other carbonyl carbon for ester-ester exchange either
intermolecularly or intramolecularly (Rousseau and Marangoni, 2002).
(A)
(B)

16
Termination of Chemical Interesterification
Interesterification is stopped by additional of water or a dilute acid. Termination of the
chemical interesterification reaction usually leads to the formation of MAG and DAG. This
can explain the detection of higher amount of these partial glycerides in the product as
compared to the feed oil (Ucciani and Debal, 1996).
R1OCO
OCOR2
O+ H OH
R1OCO
OCOR2
OH2+ OH
The catalyst can be washed out by water to separate salt, or soap-rich aqueous phase.
Phosphoric acid has also been used to form solid phosphoric salt that can be filtered out
then. Both of these methods may lead to loss of fat products. Alternatively, carbon dioxide
gas is added together with water to minimize the fat loss (Rousseau and Marangoni, 2002).
1.5.1.2 Enzymatic Interesterification
Interesterification can also be performed using lipase as catalyst that commonly known as
enzymatic interesterification. Enzymatic interesterification has been known for many years
as an efficient way of controlling the melting characteristics of oils and fats. The
technology was not widely used until recently and this is due to the high cost of enzymes.
In spite of this, enzymes are mainly used to obtain positional specificity of the
interesterified products (Lampert, 2000). In general, enzymatic interesterification process
can rearrange the fatty acids group at either non-specific distribution (randomization) or sn-
1,3 specific distribution (Cheah and Augustine, 1987; Ghazali et al., 1995; Yang and Xu,
2001;).
Figure 1.7 illustrated both the non-specific and sn-1,3 specific enzymatic interesterification.
Nonspecific enzymatic interesterification gives complete randomization of all fatty acids in

17
all positions and produces the same products as chemical interesterification. Therefore,
these enzymes are not commonly used in interesterification due to the higher production
cost compared to chemical intesterification. Examples of nonspecific lipases are lipases
derived from Candida cylindraceae, Corynebacterium acnes, and Stapylococcus aureus
(Willis and Marangoni, 2002).
Figure 1.7
Interesterification reaction schemes by (A)non-specific lipases and (B)sn-1,3 specific lipases
(Yang and Xu, 2001)
X
X
X
+
Y
Y
Y
Non-specif ic lipases
Randomization
X
X
X
Y
Y
Y
X
Y
Y
Y
X
Y
Y
Y
X
+ + +
Y
X
X
X
Y
X
X
X
Y
+ + + +
X
X
X
+
Y
Y
Y
Sn-1,3 specif ic
lipases
X
X
X
Y
Y
Y
X
Y
Y
Y
Y
X
X
Y
X
+ + +
Y
X
X
X
X
Y
Y
X
Y
+ + + +
1.5.1.2.1 The Catalytic Behavior of Lipase in Interesterification
Enzyme/lipases can be derived from sources such as animal, bacterial and fungal. Almost
all lipases have similar three-dimensional structures; yet lipases are different in the
sequences of amino acids. Lipase can be defined as a polypeptide chain that folded into two
domains; the C-terminal domain and the N-terminal domain (Willis and Marangoni, 2002).
The polypeptide chain in the lipases is folded in similar ways to have similar active sites.
The N-terminal domain in the lipase is responsible for the catalytic behavior of enzymes
that contain active site with a hydrophobic tunnel. The hydrophobic active sites allowed the
(A)
(B)

18
attachment of long fatty acid chain onto it and that promised specificity during
interesterification (Willis and Marangoni, 2002).
In the presence of lipids or organic solvents, the lid of lipase structure is opened, exposing
the hydrophobic core that allowed reactions to take place. The lid differs for lipases in the
number and position of the surface loops. The main component of active site is the α- or β-
hydrolase fold that contains a core of mostly parallel β-sheets surrounded by α-helices
(Willis and Marangoni, 2002). The α-helix structure in the lid is important for the lipase to
bind to lipid at the interface. Enzyme activity will reduced when the amphiphilic properties
of the loop are reduced.
Catalytic triad of the lipase are composed of serine (SER), histidine (HIS) and either
glutamic (GLY) or aspartic (ASP) acid together with some oxyanion-stabilizing residues
that generate the hydrophobic pocket of the lipase (Willis and Marangoni, 2002; Solomon,
2004b). The position of catalytic triad is determined by folding of the polypeptide chain of
the lipase. Figure 1.8 shows the example of hydrophobic pocket of lipase derived from
Candida rugosa.
Figure 1.8
Crystal structure and location of catalytic residues of the active site of Candida rugosa lipase
(Willis and Marangoni, 2002)

19
The specificity behavior of lipases in catalyzing interesterification can be categorized into
three main classes that are positional specificity (regiospecificity), fatty acids selectivity,
and stereospecificity (Cheah and Augustine, 1987; Willis and Marangoni, 2002). Only a
few enzymes in the nature that posses stereospecificity behavior, these lipases can
differentiate sn-1 and sn-3 positions in which the reaction rate towards fatty acids at the
position-1 and -3 are different (Cheah and Augustine, 1987; Willis and Marangoni, 2002).
Lipases can only behave as a high specificity biocatalyst under specific reaction conditions.
There are several factors that can affect the performance of enzyme such as the reaction
system, reaction temperature, water level, enzyme dosage etc.
Table 1.2 shows the selectivity of some typical lipases in nature. Positional specificity in
lipase-catalysed interesterification is due to steric hindrance of the sn-2 position fatty acids
in TAGs (Willis and Marangoni, 2002). This steric hindrance effect prevents the fatty acid
in the sn-2 position from entering the lipase active site. Examples of 1,3-specific lipases are
those from Aspergillus niger, Mucor miehei, Rhizopus arrhizus, Rhizopus delemar,
Pseudomonas sp., Rhizopus oryzae etc (Yang and Xu, 2001). Initially, 1,3-specific lipases
will produce mixture of TAGs, 1,2-DAGs, and 1,3-DAGs without interfere the sn-2
position fatty acids. However after prolong reaction with the formation of 1,3-DAG, acyl
migration will occur that permit some randomization of the 2-position fatty acids in the
TAG backbone (Willis and Marangoni, 2002).

20
Enzymes/lipases Specificity
Table 1.2
Selectivity of typical lipase derived from various sources
Lipase sources Substrate specificity
Position (sn-) Fatty acids
Aspergillus niger 1,3 » 2 M › S › L
Aspergillus sp. 1, 2, 3 M, S, L
Candida rugosa 1, 2, 3 M, S, L
Candida antarctica 1, 2, 3 M, S, L
Candida lypolytica 1, 2 › 3 M, S › L
Candida parapsilosis 1, 2 › 3 M, S, L
Chromobaterium viscoum 1, 2 › 3 M, S, L
Geotrichum candidum 1, 2 › 3 M, S, L
Mucor javanicus 1, 3 › 2 M, S, L
Pancreatic (porcine) 1, 3 S › M, L
Papaya latex 1, 3 › 2 M, S, L
Pre-gastric esterase 1, 3 M, S » L
Penicillium sp. 1, 3 › 2 M, S, L
Penicillium camembertii 1, 3 MAG › DAG › TAG
Penicillium roquefortii 1, 3 S, M » L
Phycomyces nites 1, 3 › 2 S, M, L
Pseudomonas sp. 1, 3 › 2 S, M, L
Pseudomonas fluorescens 1, 3 › 2 M, L › S
Rhizomucor miehei * 1, 3 › 2 M, S, L
Rhizopus delemar 1,3 » 2 M, S » L
Rhizopus javanicus 1, 3 › 2 M, S › L
Rhizopus japonicus 1, 3 › 2 S, M, L
Rhizopus niveus 1, 3 › 2 M, L › S
Rhizopus oryzae 1,3 » 2 M, L › S
Rhizopus arrhizus 1, 3 S, M › L
Thermomyces lanuginose * 1,3 » 2 S, M, L
[Abbreviation: M = medium chain fatty acids, L=Long chain fatty acids, S=short chain fatty acids;
* referred to the enzymes that have been selected for this project]
(Adapted from Yang and Xu, 2001)

21
The specificity performance of lipase is very dependent on the reaction conditions and
system. Under specific reaction conditions, lipase can perform in an excellent specificity
with minimize randomization (Quilan and Moore, 1993; Yang and Xu, 2001; Natália et al.,
2006; Criado et al., 2007). Besides, there are some lipases that permit sn-2 specific reaction
rather than sn-1,3 specific in catalyzing enzymatic processes. For example, lipase from
Candida parapsilosis, candida lypolytica, and Chromobaterium viscoun can hydrolyzes sn-
2 position fatty acids more rapidly than those at the 1- and 3- positions (Yang and Xu, 2001;
Willis and Marangoni, 2002).
Fatty acids selectivity is also important in studying the lipases catalytic activity. In fact,
some of the lipases are specific toward particular fatty acids substrates. The criterions for
fatty acid selectivity can be the carbon chain length (short, medium or long chain), the
unsaturation fatty acids (bend structure for unsaturation fatty acids) etc. For example, lipase
derived from Penicillium cyclopium is specific toward long chain fatty acids, while porcine
pancreatic lipase is specific toward shorter chain fatty acids (Willis and Marangoni, 2002).
Lipase from Mucor miehei has strong affinity towards fatty acids that contained the first
double bond form carboxyl end at an even-numbered carbon such as cis-4, cis-6, and cis-8.
Therefore, the reaction rate towards other fatty acids will be slower (Willis and Marangoni,
2002). Hereby, we can see that fatty acids specificity is also an important criterion to be
considered when selecting lipase for oils and fats modification process, instead of just the
positional specificity, especially for production of specialty products with desired fatty acid
chain length.
22
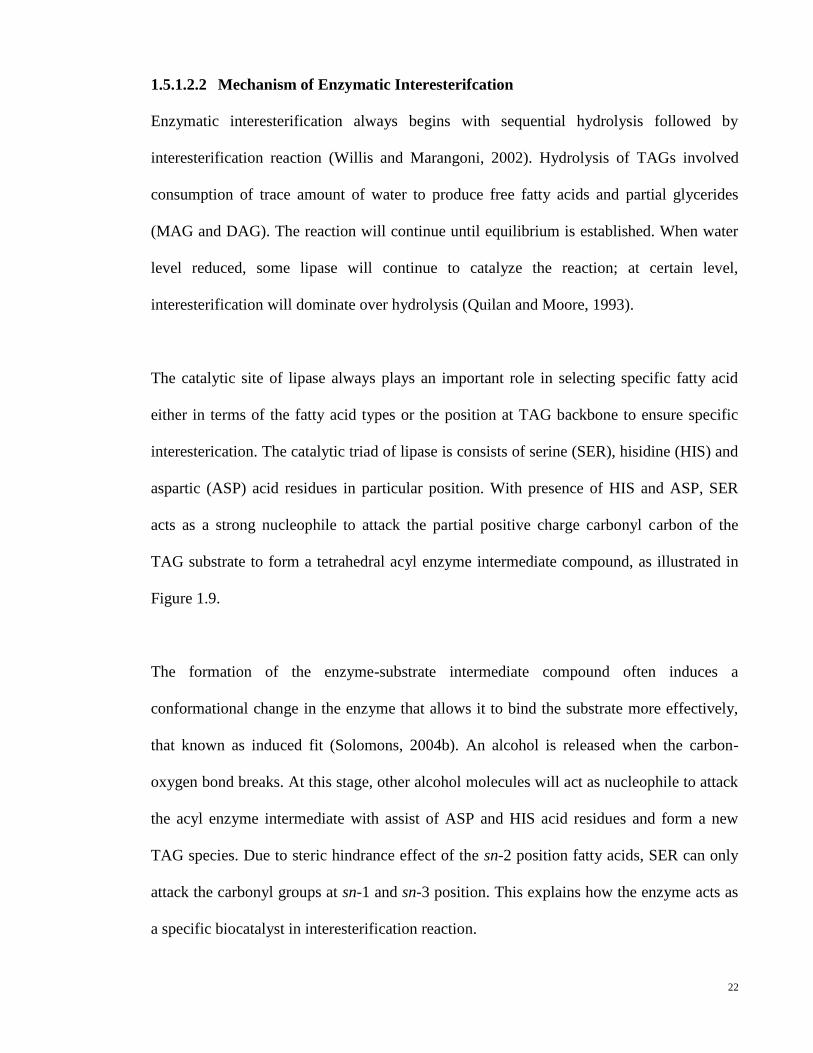
1.5.1.2.2 Mechanism of Enzymatic Interesterifcation
Enzymatic interesterification always begins with sequential hydrolysis followed by
interesterification reaction (Willis and Marangoni, 2002). Hydrolysis of TAGs involved
consumption of trace amount of water to produce free fatty acids and partial glycerides
(MAG and DAG). The reaction will continue until equilibrium is established. When water
level reduced, some lipase will continue to catalyze the reaction; at certain level,
interesterification will dominate over hydrolysis (Quilan and Moore, 1993).
The catalytic site of lipase always plays an important role in selecting specific fatty acid
either in terms of the fatty acid types or the position at TAG backbone to ensure specific
interesterication. The catalytic triad of lipase is consists of serine (SER), hisidine (HIS) and
aspartic (ASP) acid residues in particular position. With presence of HIS and ASP, SER
acts as a strong nucleophile to attack the partial positive charge carbonyl carbon of the
TAG substrate to form a tetrahedral acyl enzyme intermediate compound, as illustrated in
Figure 1.9.
The formation of the enzyme-substrate intermediate compound often induces a
conformational change in the enzyme that allows it to bind the substrate more effectively,
that known as induced fit (Solomons, 2004b). An alcohol is released when the carbon-
oxygen bond breaks. At this stage, other alcohol molecules will act as nucleophile to attack
the acyl enzyme intermediate with assist of ASP and HIS acid residues and form a new
TAG species. Due to steric hindrance effect of the sn-2 position fatty acids, SER can only
attack the carbonyl groups at sn-1 and sn-3 position. This explains how the enzyme acts as
a specific biocatalyst in interesterification reaction.

23
Figure 1.9
The reaction mechanism for enzymatic interesterification, with catalytic site containing Asp,
His and Ser residues. (Adapted from Willis and Marangoni, 2002)
C
O-
O
Asp
H
N N
His
H O
Ser
C
O
ROR'
C
O
Asp
O H
N N
His
H
C
O-
ROR'
O
Ser
C
O-
O
Asp
H
N N
His
C
O
ROH
O
Ser
R'
R'OH
R''OH
C
O-
O
Asp
H
N N
His
C
O
RO
O
Ser
R''
H
C
O
Asp
O H
N N
His
H
C
O-
ROR''
O
Ser
C
O-
O
Asp
H
N N
His
H O
Ser
C
O
ROR''
As compared to chemical interesterification, enzymatic interesterification is relatively slow
and can be stopped at any point to obtain desired product. However, the reaction is
normally allowed to achieve equilibrium compositions. Meanwhile, enzymatic
interesterification is advantages in terms of specificities, mild reaction conditions, and less
acyl enzyme intermediate
A
B
C
D
E
F

24
by-product (Yang and Xu, 2001, Willis and Marangoni, 2002). Chemical interesterification
required some purification processes such as washing, bleaching, deodorization which does
not required for enzymatic interesterification (Yang and Xu, 2001). The use of chemical
catalyst which is highly toxic and explosive also raised concerns from society regarding
health and environmental issues.
1.5.1.2.3 The Studies and Applications of Enzymatic Interesterification
The enzymatic interesterification has been widely reviewed in Willis and Marangoni (2002),
Yang and Xu (2001) and Xu et al. (2002) from various aspects including the
immobilization process, the physicochemical properties of the interesteried products,
enzyme specificity, and numbers of modification processes for production of specialty
products and structured lipid etc. Besides, the comparison between chemical and enzymatic
approaches in interesterification has been studied by Kowalski et al., 2004 etc.
Immobilized Enzymes/lipases
Lipases are commonly used as immobilized enzyme rather than the free enzymes. The
advantages of using immobilized enzyme systems are included reusability, rapid reaction
termination, lower cost, controlled product formation, and ease of separation of the
enzymes from the oils (Cheah and Augustine, 1987; Willis and Marangoni, 2002). Enzyme
immobilization is also known to improve the stability of enzyme (Cheah and Augustine,
1987). Beside, immobilized enzyme can also be easily and quickly loaded onto any packed-
bed reactor that do not required filtration after interesterification (Cheah and Augustine,
1987; Vasudevan et al., 2004).

25
There are numbers of immobilized enzymes available commercially, such as Lipozyme®
TL IM (Thermomyces lanuginosa), Lipozyme® RM IM (Rhizomucor miehei), and
Novozyme® 435 (Candida antartica) from Novozyme Co.; PLC and PLG (Alcaligenes sp.)
with different supporting materials from Meito Sangyo Co. ; PS-C „Amano‟ II
(Pseudomonas cepacia) from Amano Pharmaceutical Co. etc. The availability of
immobilized enzymes from Meito Sanyo Co. and Amano Pharmaceutical Co. is very
limited. Most of the products are free enzymes that required immobilization step before
applied for modification process. Immobilization material is also known as filter aid that
used for ease of separation (Ghazali et al., 1995). For example, Lipase D-200 (Rhizopus
delemar: Amano Pharmaceutical Co.) was immobilized on Celite 535 before used in
interesterification of canola and palm oils (Kurashige et al., 1993), while free lipases from
Candida rugosa, Pseudomonas sp, Rhizopus javanicus, Mucor javanicus, Aspergillus niger,
and Rh. niveus that also can be obtained from Amano Pharmaceutical Co. were
immobilized onto celite material for the study of transesterification of palm olein (Ghazali
et al., 1995).
Lipozyme® TL IM is one of the most popular enzymes used for modification of oils and
fats due to lower enzymes cost as compared to the others. Rønne et al., (2005) had
indicated that Lipozyme® TL IM is nonselective toward neither different chain length fatty
acids nor unsaturated fatty acids. There are several literatures reported on the operational
stability of Lipozyme® TL IM during interesterification either in batch or continuous
packed-bed processes. For batch process, Xu et al., (2002) reported that the enzyme was
stable for at least 11 and 9 batches with 3 hours duration for each reaction, in the small and
larger scale reactor, respectively. The authors also reported that the activity of the enzyme

26
can retain for two weeks for continuous packed-bed process without disturbing the water
content of the system.
A study on operational stability of Lipozyme® TL IM of two blends; first involved 55: 25:
20 ratio of palm stearin: palm kernel oil: sunflower oil, and second involved 55: 35: 10
ratio of palm stearin: palm kernel oil: TAGs rich in n-3 polyunsaturated fatty acids (PUFA)
was conducted in a continuous packed-bed reactor (Yamaguchi et al., 2004). This study
indicated that the lipase activity decreased progressively along the operation period which
is 580 hours and 390 hours, respectively. The authors also reported that higher PUFA level
may lead to higher rate of oxidation and thus reduced the enzyme stability.
Lipozyme® RM IM is much more expensive in terms of enzyme cost as compared to
Lipozyme® TL IM. There are also many enzymatic studies conducted using Lipozyme®
RM IM. A study conducted by Criado et al. (2007) reported that in comparison to
Novozyme® 435 (Candida antarctica) and Lipozyme® TL IM in a batch reaction system
for interesterification of virgin olive oil with fully hydrogenated fat using orbital agitation,
Lipozyme® RM IM required a longer time (> 8 hours) to achieve equilibrium stage,
whereas Novozyme® 435 and Lipozyme® TL IM only took respectively 4 and 8 hours to
achieve equilibrium stage. These studies also indicated that the differences in the sn-2
position fatty acids of these three products are negligible, besides oxidative stability of all
interesterified products was lower as compared to the corresponding physical blends.
Studies of Enzymatic Interesterification for Commercial Applications
Enzymes have been used in many application either food or non-food area. Enzymatic
reaction plays an important role especially in food applications. For example, production of

27
cocoa butter equivalent (CBE) in chocolate and related confectionery industries that usually
involved the use of 1,3-specific lipases. In cocoa butter TAGs, oleic acid (O) is locate at the
sn-2 position while palmitic acid (P) and stearic acid (S) at the sn-1,3 positions (Yang and
Xu, 2001). The purpose of using enzymatic interesterification in the production of CBE is
to retain O at the sn-2 position with P and S at the sn-1,3 positions. These symmetry
structure TAGs with unique fatty acid composition and distribution in TAG backbone are
responsible to the characteristic of chocolate (Yang and Xu, 2001). The production of
cocoa butter equivalent by enzymatic approach has been reviewed by Quinlan and Moore
(1993), and Yang and Xu (2001).
High POP vegetables oils such as palm mid fraction and material with stearic source such
as SOS, SSS, and stearic acid, are the starting material that usually used for production of
CBE that consists of a mixture of POS, SOS, and POP (Yang and Xu, 2001). For examples,
production of cocoa butter-like fats was studied by Chang et al. (1990) via enzymatic
interesterification of hydrogenated cottonseed oil and olive oil using immobilized Mucor
miehei; enzymatic interesterification of palm oil and tristearin in supercritical fluid carbon
dioxide (SC-CO2) medium by Liu et al. (1997); and Bloomer et al. (1990) studied the
production of CBE by immobilized enzyme interesterification of palm mid fraction and
ethyl stearate. However, enzymatic process may produce small amount of DAG that will
affect the formation of β crystals during chocolate tempering. Solvent is usually used for
the removal of these DAG.
In addition, lipase-catalyzed interesterification reaction is also an important process for
production of zero-trans hard-based stock to replace partial hydrogenation. For example, a
study conducted by Zhang et al. (2000) involved producing of margarine fats by enzymatic

28
interesterification of palm stearin and coconut oil blend (75:25, w/w) with Lipozyme® IM
(Rhizomucor miehei immobilized in an ion exchange resin) in 1 kg scale batch reactor. Due
to the good characteristics of the margarine products, interesterification of the same oil
blend was conducted by using Lipozyme® TL IM in a 300 kg pilot-scale batch reactor
(Zhang et al. 2001). Both studies indicated that Lipozyme® TL IM and Lipozyme® IM had
similar enzyme activity in for interesterification of the oil blend.
Besides, the production of zero-trans Iranian vanaspati was studied by Jamshid et al. (2006,
2007) using two oil blends. The first blend involved the use of palm olein, low-erucic acid
rapeseed oil and sunflower oil via directed interesterification (Jamshid et al, 2006), while
the second blend consists of fully hydrogenated soybean oil, rapeseed oil, and sunflower oil
(Jamshid et al., 2007).
There are many specialty products of enzymatic interesterification that have commercially
available. Table 1.3 shows some of the functional products, the trade name, and the
invented company of the commercial products developed from enzymatic interesterification.
Econa oil was officially withdrawn from the market on 16th
September 2009 due to high
levels of glycidol fatty acid esters in DAG oils (Tan, 2009).
Enzymatic interesterification also widely used as an effective approach to produce specific
structured lipids that have been reviewed comprehensively by Xu (2000). In addition,
enzymes also have been used to produce prodrugs, e.g. synthesis of 6-azauridine prodrugs
by using Lipozyme® TL IM (Wang et al., 2009).

29
Table 1.3
The list of functional products, trade name and the invented company from enzymatic
interesterification technology
Trade name Functional products Invented company
Betapol Human milk fat substitute
Loders Croklaan
Econa Diacylglycerols oil
- anti-obesity
Kao Corporation, Japan
Enova Diacylglycerols oil
- anti-obesity
ADM Kao, USA
Resetta Medium chain triacylglycerol oil
- fast energy source
- anti-obesity
Nisshin Oillio Group Ltd
In non-food area, applications of enzymes in production of biodiesel also have been widely
studied in which enzymatic approach is said to be a greener way of produce biodiesel
(Robles-Medina et al., 2009). Besides, enzymatic method also can overcome some
problems encountered in chemical interesterification process, such as difficulty in the
removal of alkaline catalyst from the product, recovering glycerol, treatment of alkaline
waste water, and the interference of reaction by free acids and waters (Watanabe et al.,
2000). Enzymes such as Mucor miehei, Rhizopus oryzae, Candida antarctica,
Thermomyces lanuginosa and Pseudomonas cepacia have been used for biodiesel
production that reported by Robles-Medina et al. (2009). Alcoholysis with methanol is the
main reaction for the production of methyl esters from oils and fats. The strong inhibition
behavior of methanol towards lipases activities is the problem identified in this process
(Yang and Xu, 2001). Therefore, studies and development are still needed in order to
commercialize this process so as to contribute to the biodiesel industry.

30
1.5.1.2.4 Reactors for Enzymatic Interesterification
Enzymatic modification has been radically developed from simple laboratory ideas at the
beginning to industrial practices (Xu, 2003). According Willis and Marangoni (2002),
there are five available reactors that have been used for enzymatic interesterification,
including fixed bed reactor, stirred batch reactor, continuous stirred tank reactor, membrane
reactor, and fluidized bed reactor.
Fixed bed reactor is one of the most common reactors used that basically based on
continuous flow system, in which the substrate and the product are pumped in and out of
the column packed with immobilized enzymes, at the same rate (Willis and Marangoni,
2002). The main reason of favorably application of fixed-bed reactor in the industries is due
to the easy application to large-scale operation, with high efficiency, low cost and ease of
separation. In addition, fixed bed reactor also provides more enzyme surface area that may
ensure better contact of the substrates with the enzymes (Willis and Marangoni, 2002).
Stirred batch reactor is a simple process with an agitation tool attached to the tank. No
addition and removal of substrates and products is performed during the reaction. The level
of substrates in the reactor is reduced over time of reaction, in which conversion to products
take place throughout the reaction. Free enzyme can be used in this reactor; however
immobilized enzyme is still preferred due to the ease of separation and enzyme reusability
(Willis and Marangoni, 2002).
The principle of continuous stirred tank reactor is based on the combination of both fixed-
bed reactor and batch reactor. It is an agitation tank like stirred batch reactor, with same
way of substrates loading and products removal like fixed bed reactor. In other words,

31
substrates and products are pumped in and out of the tank at the same rate (Willis and
Marangoni, 2002). This design of reactor is disadvantaged due to the higher power
consumption associated with continuous stirrer, and the possibility of breaking up of
supporting material during agitation (Willis and Marangoni, 2002).
Membrane reactor involved immobilization of enzymes onto the surface of membrane (Xu,
2003) that involved two phase systems where interface of two phases is at a membrane
(Willis and Marangoni, 2002). Materials used in membrane systems are polypropylene,
nylon, acrylic resin, and polyvinyl chloride (Willis and Marangoni, 2002). The advantages
of using membrane systems are lower pressure drops and fluid channeling with high
diffusivity, chemical stability as well as higher membrane surface area to volume ratio
(Willis and Marangoni, 2002). Membrane reactor is also suitable to be used in enzymatic
hydrolysis, in which the reaction can take place on the membrane surface and the glycerol
formed can be transported through the membrane to the water phase (Xu, 2003).
The other reactor that has been used for enzymatic interesterification is fluidized-bed
reactor. In fluidized-bed reactor, the immobilized enzyme and support are kept suspended
in the column by the upward flow of substrate at high flow rates (Willis and Marangoni,
2002). The fluidized bed reactor is advantages due to no channeling problems, less pressure
changes at high flow rates and no separation of oils and particulates needed after the
reaction. The major disadvantages of fluidized bed reactor is that only small amount of
enzymes can be used since large void volume is needed to keep the substrates and
immobilized enzyme suspended (Willis and Marangoni, 2002).
32
Amongst these reactors, the most common reactors are fixed bed reactor (packed-bed
reactor) and stirred batch reactor (batch reactor). Both of these two reactors are selected in
this study due to the simplicity of reactor design.
1.5.2 Fractionation
Fractionation can be defined as separation of a mixture into different fractions. Generally,
the concept of physical separation process can be based on a few principles; the differences
in solidification, solubility, and volatility of the different compounds. The techniques that
usually used for fractionation are fractional crystallization, fractional distillation, short-path
distillation, supercritical fluid extraction, liquid-liquid extraction, adsorption, complexation,
membrane separation etc (Kellens et al., 2007).
In oils and fats industries, fractional crystallization is the process used for separating oils
and fats into two or more components, which involved two steps; selective crystallization
and filtration. The concept of fractionation is based on the difference in melting points of
TAGs (difference in solidification) and the solubility of the solid TAGs in the liquid phase
(Gunstone, 2001b). The difference in solubility is depending on the TAG molecular weight
and degree of unsaturation that affects the ability of fats to produce crystals (Kellens et al.,
2007). Fractional crystallization is a fully reversible process, which is basically a thermo-
mechanical separation process (Kellens et al., 2007).
1.5.2.1 Fractionation of Palm Oil
Fractionation is an essential process for palm oil industries due to its fatty acid composition
with 50% of saturated and 50% of unsaturated. The appearance of palm oil as semi-solid fat
in tropical climate allows it to be separated into a low melting fraction-olein and a high

33
melting fraction-stearin (Deffense, 1985). In general, there are three fractionation processes
used to fractionate palm oil; dry fractionation, detergent fractionation, and solvent
fractionation.
Dry Fractionation
Dry fractionation is the simplest and cheapest process, which is available in most palm oil
refinery factories. It is a dry process uses direct filtration of the TAG crystals after a
controlled cooling program. This process is simple because it does not require the use of
any chemicals with no effluent produced along the process. Hence, this process is also
advantage in terms of minimum losses of the products (Kellens et al., 2007).
In dry fractionation, the oil is partially crystallized by controlled cooling of the melt to the
desired fractionation temperature, leaving the substrate for crystals formation, followed by
filtration by means of membrane filter press (Gunstone, 2001b). Figure 1.10 shows various
palm oil products obtained from single, double and triple stage dry fractionation.
Figure 1.10
Dry fractionation of palm oil and its products by single, double and triple dry fractionation
(Kellens, 2007)
Palm oil
Hard stearin
Olein
Soft stearin
Soft PMF
Super olein
“Oleins”
Hard PMF
Top olein
Super stearin
Recycling
Palm oil
Hard stearin
0
10
20
30
40
50
60
70
80
90
1st Qtr 2nd Qtr 3rd Qtr 4th Qtr
East
West
North
Olein
Soft stearin
Soft PMF
Super olein
“Oleins”
Hard PMF
Top olein
Super stearin
Recycling

34
Single stage dry fractionation of palm oil produces palm olein with IV of 56 and 62. The
saturation content of palm olein can be further reduced by multiple stage fractionation in
which double and triple fractionation produce oleins with IV of IV 65 (super olein) and IV
70 (top olein), respectively (Gijs et al., 2007; Kellens et al., 2007).
Detergent Fractionation
Detergent fractionation is first developed by Lanza that involved the addition of detergent
as a wetting agent to improve the separation process of the crystals from the liquid phase
(Deffense, 1985). Sodium lauryl sulfate is usually used as the wetting agents, in
combination with magnesium sulfate as the electrolyte (Kellens and Hendrix, 2000). When
the partially crystallized slurry is mixed with the detergent solution, the crystals are wetted
by the detergent and easily suspended in the aqueous phase; the mixture is then separated
by centrifugation (Kellens et al., 2007). The aqueous phase is then heated and the melted
stearin is recovered through second centrifugation step. The olein and stearin fractions are
washed with water and dried to remove the trace amount of detergent (Deffense, 1985).
Detergent fractionation has lost its interest due to the contamination of the end products and
the subsequently high production cost (Kellens et al., 2007).
Solvent Fractionation
Solvent fractionation is the most efficient fractionation process compared to other methods
(Kellens and Hendrix, 2000). It is initially developed to overcome some bulk crystallization
problems such as slow heat transfer, and limited nuclei movement. In solvent fractionation,
the oil is diluted in organic solvent such as acetone and hexane in certain amount to reduce

35
its viscosity, which is different from bulk crystallization in dry and detergent fractionations
(Kellens et al., 2007).
In dry fractionation, it is not possible to remove all liquid from the solid phase, in which
part of the liquid will remain entrapped in the solid fraction. The addition of solvent will
reduce the surface tension between the liquid and solid phases hence promises better
separation. Solvent fractionation is more efficient in reducing the liquid oil entrapment,
thus enhanced the liquid oil yield as well as increased the solid fraction purity. Similar to
detergent fractionation, solvent fractionation has lost its interest due to the high production
cost. Besides, higher risk to fire and human health hazards also lead to lesser implication of
solvent fractionation in palm oil fractionation (Kellens et al., 2007).
1.5.2.1.1 Palm Fractionation Products
Palm olein can remains as clear liquid oil at temperatures above 18 °C, 20% of the
compounds starts to form cloudy deposits below this temperature. Therefore, the usage of
pure palm olein as liquid cooking oil is only limited in hot climates countries (Siew and Ng,
1996). In temperate countries, palm olein is used as blended oil in order to introduce more
unsaturated components to the oil for better physical stability (Berger, 1981). The main
applications of palm oil products are illustrated in Table 1.4.
Table 1.4 The main food applications of palm oil fractionation products (Berger, 1981)
Palm oil products Food applications
Palm oil vegetable ghee/vanaspati
Palm olein, superolein, top olein cooking/frying oil
Palm stearin bakery shortening, vegetable ghee, margarines,
Palm mid fraction confectionery fats – cocoa butter equivalent
36
Palm stearin is one of the most popular materials used for productions of blended fat
products such as margarines, shortenings, and vanaspati due to its lower cost and better
health effects compared to partial hydrogenation soft oils (Berger, 1981). Other than that,
palm oil and palm kernel oil are also the main ingredients for various types of margarines
such as table margarines, pastry margarines, and bakery margarines (Berger, 1981). Palm
mid fraction (PMF) is a valuable product from palm oil fractionation that widely used as
confectionary fats. PMF is well compatible with cocoa butter due to its high POP content.
PMF behaves like cocoa butter in any proportion without altering the physical properties
such as melting, rheological and processing properties.
1.5.2.1.2 Principal of Fractionation: Crystallization
In general, crystallization of fats consists of a few stages; supercooling of the melt,
nucleation, and crystal growth (Kellens et al., 2007).
Supercooling/supersaturated
Nucleation can be occurred when the melt becomes supercooled in which the temperature
of the melt is much lower than the thermodynamic equilibrium temperature (∆T) (Kellens
et al., 2007). In this perspective of crystallization in a solution system, the TAGs that have
to be crystallized are required to concentrate in the saturated-solution concentration, until
achieved supersaturated condition. In other words, crystallization can only occur when
solute concentration is greater than that in the saturated solution (Lawler and Dimick, 2002;
Timms, 2005). The solvent for solution crystallization is not only referring to the organic
solvents such as those added in the solvent fractionation. In bulk crystallization, the liquid

37
components in the TAG mixture can also performed as the solvent for the crystallization
system.
Nucleation
At temperature much lower than the supercooling temperature (∆T), nuclei can be formed
in the system (Lawler and Dimick, 2002). Nuclei are defined as the smallest crystal that can
exist in a solution at particular concentration and temperature (Timms, 2005). Generally,
there are three types of nucleation phenomena that can be occur; the primary nucleation
including homogeneous nucleation, heterogeneous nucleation and the secondary nucleation
(Kellens et al., 2007). Homogeneous nucleation is nucleation that occurs in the bulk mother
phase; heterogeneous refers to nucleation onto foreign substances in the crystallizer such as
dirt, walls of crystallizers etc; secondary nucleation happens when tiny crystallites are
removed from the surface of existing crystals which will then act as new nuclei in the
crystallization system (Kellens et al., 2007), therefore secondary nucleation is undesirable
in any fractionation process (Timms, 2005).
Crystal Growth
Once nuclei are formed, they will start to grow by incorporate with the TAG molecules
from the adjacent liquid layer. Crystal growth can be affected by two factors; the internal
and the external factors. External factors are including degree of supercooling, presence of
inhibitors etc, whereas internal factors are polymorphic form, crystal morphology, crystal
defects etc (Foubert et al., 2007).
According to Timms (2005) and Kellens et al. (2007), the growing rate is proportional to
supercooling and inversely proportional to the viscosity of the system. When molecules
38
comes together to form crystal, two opposing forces will takes place simultaneously – the
energy that release due to crystallization (heat of crystallization) and the surface tension
between the crystals that leads to increase of viscosity. The increases of surface tension and
viscosity are not only due to the increase of solid particles present in the liquid but also
influenced by the crystals size distribution and the interactions between different crystals
(Foubert et al. and Kellens, 2007).
To ensure a uniform crystals growth, the crystallization must be in a continuous system that
allows homogeneous contacts of the nuclei and the surrounding supersaturated liquid
(Timms, 2005). Therefore, a sufficient agitation rate with non-destructive feature is
important to ensure a continuous and uniform crystallization (Kellens et al., 2007). A
stable crystal will only form when the energy due to the heat of crystallization exceeds the
energy that required to overcome the surface energy between the crystals (Timms, 2005).
1.5.2.1.3 Principal of Fractionation: Separation Step
To complete fractionation process, the solid phase needs to be separated from the liquid
phase at the fractionation temperature. Efficient separation is essential to ensure production
of purer stearin fraction with minimum entrainment of olein. There are a few separation
methods used in fractionation plants, including centrifugation, vacuum filtration, and
membrane filter press (Timms, 2005).
The principal of centrifugation is by density difference between solid and liquid phase of
the slurry. It is only useful to separate slurry system with density difference of 10%
between solid and liquid. Therefore this separation step is only applicable in detergent
fractionation (Timms, 2005).

39
For dry fractionation, vacuum filtration and membrane filter press are used. The design of
vacuum filtration is similar to laboratory vacuum filtration in which a vacuum is applied to
suck the liquid oil through (Timms, 2005). There are two types of vacuum filtration
methods used industrially, belt filter (Tirtiaux) and drum filter (Desmet) (Kellens and
Hendrix, 2000). Belt filter performed better separation in terms of producing stearin with
lower level of entrainment than the drum filter (Timms, 2005).
The most common filtration method used is membrane filter press. Initially, less than one
bar pressure is applied to fill the filter press with the slurry. Higher pressure is applied to
squeeze the entrained liquid oil. A standard filter press is normally applied at a pressure of
5-6 bar. When necessary, high-pressure membrane filter press that can operate up to 30 bar
can be used (Kellens and Hendrix, 2000). In comparison, membrane press filtration is the
most efficient separation method with the lowest liquid oil entrainment in stearin fraction,
as well as it gives highest olein yield.
1.6 Dietary Fats and Coronary Heart Disease
1.6.1 Triacylglycerols Metabolism
There are a few enzyme lipases involved in the digestion of dietary fats in human body,
such as lingual, gastric, pancreatic and co-pancreatic lipases that found in the mouth,
stomach and small intestine, respectively (Voon and Kalanithi, 2008). In the stomach, about
10-30% of fats are pre-digested with presence of lingual and gastric lipases; bile salts will
produce from the liver (Voon and Kalanithi, 2008).

40
In the intestine, dietary TAGs are dissolved with the help of bile salts, and some small
quantities of fatty acids and MAGs (Ronald and Jogchum, 2002). About 70-90% of fats are
digested with the presence of pancreatic lipase and co-pancreatic lipase particularly in the
duodenum. Pancreatic lipase and co-pancreatic lipase hydrolyze sn-1 and sn-3 fatty acids of
TAGs respectively, which resulted of the formation of 2-MAG, and sn-1(3) free fatty acids
(Voon and Kalanithi, 2008).
Reesterification of the 2-MAG and free fatty acids in the intestine formed new TAGs that
will incorporated into chylomicrons (C). The chylomicrons enter the lymphatic system for
blood circulation in the subclavian vein. In the blood, the TAGs from the chylomicron core
are hydrolyzed by lipoprotein lipase (LPL) and produced chylomicron remnants (CR), 2-
MAG, and free fatty acids (Ronald and Jogchum, 2002; Voon and Kalanithi, 2008).
Chlylomicrons remnants that carry the cholesterol ester and TAGs will transport back to the
liver, while 2-MAG and free fatty acids will be used in TAGs synthesis in liver, or energy
storage and supply (Voon and Kalanithi, 2008).
The sn-1(3) short and medium chain free fatty acids will be absorbed directly in the
intestines after the hydrolysis, whereas long chain SFA will either be absorbed or mostly
react with 2-MAG for resynthesis of new TAGs and chylomicron (Voon and Kalanithi,
2008). Predominantly, the long chain free fatty acids that hydrolyzed from sn-1 and sn-3
positions may not be absorbed or taken longer time for absorption due to their higher
melting points as compared to human body temperature. In the intestine, long chain free
fatty acids will tend to react with calcium ion, and thus excreted from the body as calcium
soaps (Voon and Kalanithi, 2008).
41
The low activity of pancreatic lipase towards long chain polyunsaturated fatty acids (PUFA)
has lead to low hydrolysis rate of PUFA at the sn-3 position in TAGs. Therefore long chain
PUFA are mostly present in the form of 2,3-DAG instead of 3-MAG. These 2,3-DAG have
to be hydrolyzed by hepatic lipase in the liver for production of 2-MAG and long chain
PUFA. In other words, long chain PUFA from sn-3 position could not be directly absorbed
by the body, and only those from sn-2 position can be directly absorbed in the form of 2-
MAG (Voon and Kalanithi, 2008).
1.6.2 Impact of Dietary Fats towards Coronary Heart Disease
Coronary heart disease, also termed as cardiovascular disease is one of the major causes of
morbidity and mortality in many countries especially prosperous western countries (Ronald
and Jogchum, 2002). The major risk factors of coronary heart disease are cigarette smoking,
elevated cholesterol level, elevated blood pressure, obesity and maleness (David, 2008).
There are three preventable factors of coronary heart disease; the distribution of plasma
cholesterol over low density lipoprotein (LDL) and high density lipoprotein (HDL), the
oxidizability of LDL and hemostasis (Ronald and Jogchum, 2002). Therefore, the risk of
coronary heart disease can be reduced by having a healthy lifestyle as well as maintaining a
healthy diet as dietary fat is known to affect serum concentrations of total and lipoprotein
cholesterol.
Generally, total cholesterol and low density LDL cholesterol are strongly related to
coronary heart diseases. Reduction of LDL cholesterol levels is believed to be lower the
risk of coronary heart diseases, whereas high HDL cholesterol levels are inversely related
to the risk of coronary diseases (Krauss et al., 2000).

42
Saturated Fatty Acids (SFA)
There are three classes of SFA that show different effects towards coronary heart diseases
i.e. medium chain fatty acids (MCFA), SFA with carbon chain length of C12:0-C16:0 and
stearic acid (C18:0). MCFA slightly decreases LDL cholesterol concentrations as compared
to palmitic acid (C16:0), while increases LDL cholesterol compared to oleic acid (C18:1)
(Ronald and Jogchum, 2002). Lauric and myristic acis also raised total and LDL cholesterol
relative to oleic acid, but it has lesser extent compared to palmitic acid. So, it can be
concluded that SFA with carbon chain length of C12:0-C16:0 has raised the total and LDL
cholesterol levels, which may increase the risk of coronary heart disease. On the other hand,
C18:0 is neutral towards the total and LDL cholesterol levels (Penny et. al., 2001).
Monounsaturated Fatty Acids (MUFA)
Oleic acid is the major unsaturation fatty acids component in palm oil. Monounsaturated
fatty acid (MUFA) is always known as neutral effects towards plasma total cholesterol
levels, meaning that it has the same effect on plasma total cholesterol as compared with an
isocaloric amount of carbohydrates. However, oleic acid has different effects on the
distribution of cholesterol of the lipoproteins. Consumption of high amount of oleic acid
may increase the good cholesterol lipoprotein, HDL relative to carbohydrates (Ronald and
Jogchum, 2002).
Polyunsaturated Fatty Acids (PUFA)
PUFA intake is known to reduce the total and LDL cholesterol in the greatest effectiveness
as compared to MUFA. PUFA can be divided into two classes, n-6 and n-3 PUFA (Ronald
and Jogchum, 2002). In February 2009, American Heart Association (AHA) has published
a scientific advisory to reduce the level of n-6 PUFA intake, as it specifically pertains to the
43
issue of CHD. Although consumption of n-6 PUFA can reduce the total and LDL
cholesterol, but high dietary intakes of n-6 PUFA relative to n-3 PUFAs, would promote an
overall pro-inflammatory and pro-thrombotic state due to over-production of arachidonic
acid. This may lead to many diseases including CHD, cancer, arthritis and other
autoimmune diseases (Lefevre, 2009). On the other hand, the downstream metabolites of n-3
PUFAs tend to be anti-inflammatory and anti-thrombotic that would reduce risk of
coronary diseases. Besides, Long chain n-3 fatty acids from fish oil, eicosapentaenoic acid
(EPA) and docosahexaenoic acid (DHA) may decrease triglyceride levels, favorably affect
platelet function, as well as decrease blood pressure in hypertensive individuals (Kris-
Etherton, 2001).
Trans-fatty Acids
Trans-fatty acids generally found in partial hydrogenated fats, and some animal fats.
Consumption of trans-fatty acids is known to be increased the level of bad-cholesterol
(LDL), while reduced the good-cholesterol (HDL) (Krauss, 2000). Therefore, the effect of
trans-fat on CVD is much serious as compared to SFA.
1.6.3 Global Dietary Recommendation
Table 1.5 below shows the summary of dietary fats recommendation for general adult
population from World Health Organization (WHO) and AHA with objective of reducing
the risk of coronary heart diseases. The recommendations are generally coupled with
guidance on physical activity and weight maintenance and are distinct for individuals with
specific metabolic profiles.

44
Table 1.5 Dietary fats recommendation of WHO and AHA for general adult population (WHO, 2003;
Lichtenstein et al., 2006)
Dietary fats recommendation
Goal (% of total energy)
WHO AHA
Total fat intake 15-30% ≤ 30%
Saturated fatty acids (SFA) < 10% < 7%
Total Polyunsaturated fatty acids (PUFA) 6-10% ≤ 10%
n-6 polyunsaturated fatty acids (PUFA) 5-8% -
n-3 polyunsaturated fatty acids (PUFA) 1-2% -
Trans fatty acids < 1% < 1%
Monounsaturated fatty acids (MUFA) X% X%
Cholesterol intake < 300 mg per day < 300 mg per day
[Abbreviation: MUFA intake, X (%) = total fat (%) – (SFA + PUFA + trans FA) (%)]
To reduce the risk of coronary heart disease (CHD) as well as other coronary diseases,
AHA generally recommended three steps, 1) limiting intake of foods with high content of
cholesterol-raising fatty acids such as SFA and trans-fatty acid, 2) limiting the intake of
foods high in cholesterol, 3) to substitute grains and unsaturated fatty acids from fish,
vegetables, legumes, and nuts (Krauss et al., 2000).
Although intake of high dietary cholesterol from foods may also contributed to higher LDL
cholesterol level, but the effects is lesser as compared to the intake of SFA. Step 3 is
necessary to maintain the total energy intake after reducing intake of SFA and trans fats,
which is similar to the substitution of carbohydrate or unsaturated fat for SFA and trans fats
(Krauss et al., 2000).
According to the scientific statement announced by AHA in February 2009, intake of 0.5-
2.0% energy of n-6 PUFA (mainly linoleic acid) is sufficient for dairy dietary fats intake of
an adult to maintain a healthy level of LDL cholesterol (Lefevre, 2009). Consumption of

45
higher amount of n-3 PUFA (EPA and DHA) is rather important to prevent CHD, AHA generally
recommended consumption of a fish meal or intake of approximately 850 mg of n-3 fatty
acids supplement per day (Krauss, 2000).
1.7 Positional Fatty Acid Distribution of Triacylglycerols
Understanding of human body metabolism of dietary TAGs has raised the concern the oils
scientists and nutritionists to determine the sn-2 position fatty acids in the TAGs of oils and
fats. Basically, two methods: hydrolysis by pancreatic lipase and Grignard deacylation were
commonly used to determine the regiospecificity of TAGs. Consequently, two approaches
can be used: one involved analyzing of 2-MAGs that usually isolated by using thin layer
chromatography followed by analyzing for their fatty acid composition (Becker et al., 1993;
AOCS Official Method Ch 3-91, corrected 1996; Angers et al., 1998). The second approach
involved analyzing of the DAGs and TAGs fatty acid composition to determine the sn-1(3)
and sn-2 position fatty acids by calculation (Brockerhoff, 1971).
1.7.1 Pancreatic Lipase 1,3-specific Partial Hydrolysis
This method involved partial hydrolysis of fatty acids specifically at sn-1 and sn-2 position
of TAGs by using pancreatic lipase to prepare a mixture of partial glycerides. The chemical
equation below shows the possible products that can be derived from the reaction
(Brockerhoff, 1960; 1971).
1
2
3
+
(from sn-1(3))
Fatty acids
OH
2
OH
+
1
2
OH
OH
2
3
+
pancreatic lipase
H2O

46
Theoretically, 2-MAG is the only monoacylglycerols produced in the reaction. However,
Mattson and Volpenhein (1960) reported that the monoacylglycerols isolated from the
digestion products are actually a mixture of 1- and 2-MAG. Longer digestion period will
increase the proportions of 1-MAG in the mixture. The presence of 1-MAG is believed to
be contributed by acyl migration of 2-MAG, indicating that the fatty acids attached to the 1-
MAG is derived from 2-MAG. Therefore the fatty acids of 1-MAG may be considered
representative of those in the sn-2 position of the original TAGs (Luddy et al., 1963). In
other words, all fatty acids of MAGs are from the sn-2 position of TAGs. The assumption
made for validity of this method is that the hydrolysis reaction is fully 1,3-specific, in
which none of the non-preferential hydrolysis takes place in the reaction.
The catalytic behaviors of pancreatic lipase in terms of positional specificity and
stereospecificity have been reviewed comprehensively by Desnuelle and Savary (1963).
The paper reported that hydrolysis reaction does not occur in solution system indicating
that the reaction probably take place at water-oil substrates. The rate and degree of
hydrolysis is very dependent on some factors such as the surface area of oils substrate in the
heterogeneous system that also depended on the agitation rate, the pH and temperature of
the reaction system, and the presence of electrolytes, bile salts and calcium ions. The most
favor temperature for the reaction is 40 °C.
The method is applicable for most of the oils and fats except for those containing
substantial amounts of fatty acids with carbon number lower than twelve, fatty acid with
highly unsaturated (more than four double bonds), very long chain fatty acids (fish and
marine animal oils), fatty acids containing oxygenated groups, as well as those with other
chemical functional group other than the acid group (AOCS Official Method Ch3-91, 1996).

47
In such cases, Grignard deacylation is a better way to analyze the positional distribution of
fatty acids in the TAGs.
1.7.2 Grignard Deacylation
Unlike the pancreatic lipase hydrolysis, Grignard deacylation method involved a truly
random degradation of TAGs that produced a mixture of partial glycerides together with
the unreacted TAGs as illustrated in the equation below.
1
2
3
OH
2
OH
+Grignard
1
HO
OH
+
OH
HO
3
+
OH
2
3
+
1
2
OH
+
1
HO
3reagent
Turon et al., (2002) has conducted a study to compare the accuracy of both pancreatic
lipase hydrolysis and Grignard deacylation methods in analyzing sn-2 position fatty acid of
a high purity standard material, sn-1,3-dipalmitoleyl-sn-2-oleoyl-glycerol (POP) with
99%+ of O at the sn-2 position. The sn-2 position fatty acids were determined by analyzing
the fatty acid composition of partial glycerides; 2-MAG, and 1,2-DAG. Instead of just 2-
MAG and 1,2-DAG, 1-MAG was also analyzed for Grignard method. The sn-2 fatty acid
composition is calculated according to the equations as follow.
sn-2 = (4 × 1,2-DAG) – (3 × TAG) ------ (1)
sn-2 = (3 × TAG) – (2 × 1-MAG) ------ (2)
In comparison to the direct analyzing of 2-MAG, Turon et al. (2002) found that calculated
sn-2 position fatty acids from 1-MAG (equation 2) is closer to the actual sn-2 position fatty
acid content of POP, with lower standard deviation as well. They also reported that
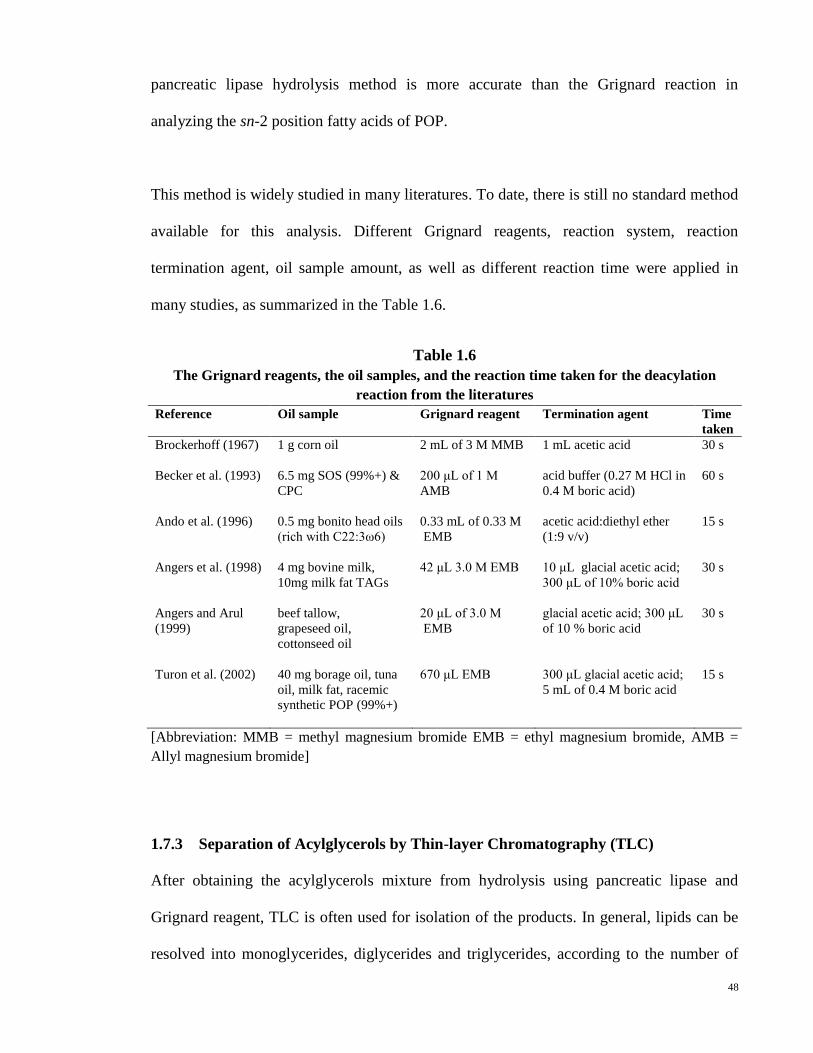
48
pancreatic lipase hydrolysis method is more accurate than the Grignard reaction in
analyzing the sn-2 position fatty acids of POP.
This method is widely studied in many literatures. To date, there is still no standard method
available for this analysis. Different Grignard reagents, reaction system, reaction
termination agent, oil sample amount, as well as different reaction time were applied in
many studies, as summarized in the Table 1.6.
Table 1.6
The Grignard reagents, the oil samples, and the reaction time taken for the deacylation
reaction from the literatures
Reference Oil sample Grignard reagent Termination agent Time
taken
Brockerhoff (1967)
1 g corn oil 2 mL of 3 M MMB 1 mL acetic acid 30 s
Becker et al. (1993) 6.5 mg SOS (99%+) &
CPC
200 μL of 1 M
AMB
acid buffer (0.27 M HCl in
0.4 M boric acid)
60 s
Ando et al. (1996) 0.5 mg bonito head oils
(rich with C22:3ω6)
0.33 mL of 0.33 M
EMB
acetic acid:diethyl ether
(1:9 v/v)
15 s
Angers et al. (1998) 4 mg bovine milk,
10mg milk fat TAGs
42 μL 3.0 M EMB 10 μL glacial acetic acid;
300 μL of 10% boric acid
30 s
Angers and Arul
(1999)
beef tallow,
grapeseed oil,
cottonseed oil
20 μL of 3.0 M
EMB
glacial acetic acid; 300 μL
of 10 % boric acid
30 s
Turon et al. (2002) 40 mg borage oil, tuna
oil, milk fat, racemic
synthetic POP (99%+)
670 μL EMB 300 μL glacial acetic acid;
5 mL of 0.4 M boric acid
15 s
[Abbreviation: MMB = methyl magnesium bromide EMB = ethyl magnesium bromide, AMB =
Allyl magnesium bromide]
1.7.3 Separation of Acylglycerols by Thin-layer Chromatography (TLC)
After obtaining the acylglycerols mixture from hydrolysis using pancreatic lipase and
Grignard reagent, TLC is often used for isolation of the products. In general, lipids can be
resolved into monoglycerides, diglycerides and triglycerides, according to the number of
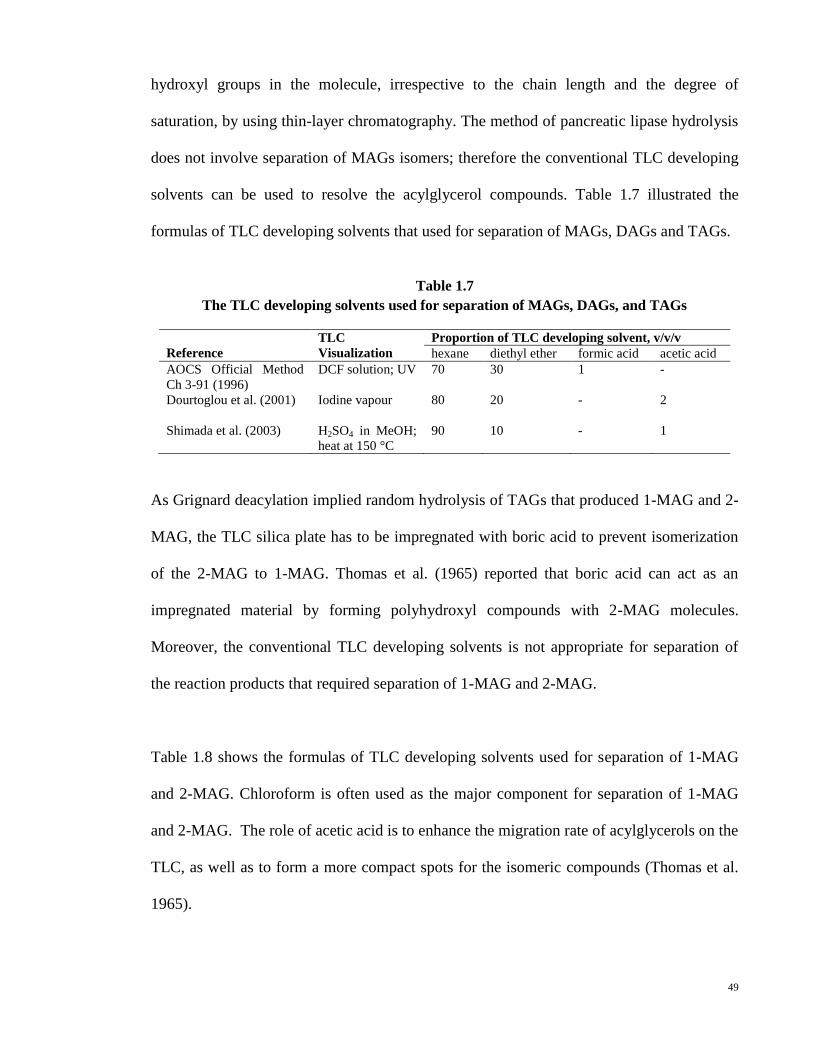
49
hydroxyl groups in the molecule, irrespective to the chain length and the degree of
saturation, by using thin-layer chromatography. The method of pancreatic lipase hydrolysis
does not involve separation of MAGs isomers; therefore the conventional TLC developing
solvents can be used to resolve the acylglycerol compounds. Table 1.7 illustrated the
formulas of TLC developing solvents that used for separation of MAGs, DAGs and TAGs.
Table 1.7
The TLC developing solvents used for separation of MAGs, DAGs, and TAGs
Reference
TLC
Visualization
Proportion of TLC developing solvent, v/v/v
hexane diethyl ether formic acid acetic acid
AOCS Official Method
Ch 3-91 (1996)
DCF solution; UV 70 30 1 -
Dourtoglou et al. (2001) Iodine vapour 80 20
- 2
Shimada et al. (2003) H2SO4 in MeOH;
heat at 150 °C
90 10 - 1
As Grignard deacylation implied random hydrolysis of TAGs that produced 1-MAG and 2-
MAG, the TLC silica plate has to be impregnated with boric acid to prevent isomerization
of the 2-MAG to 1-MAG. Thomas et al. (1965) reported that boric acid can act as an
impregnated material by forming polyhydroxyl compounds with 2-MAG molecules.
Moreover, the conventional TLC developing solvents is not appropriate for separation of
the reaction products that required separation of 1-MAG and 2-MAG.
Table 1.8 shows the formulas of TLC developing solvents used for separation of 1-MAG
and 2-MAG. Chloroform is often used as the major component for separation of 1-MAG
and 2-MAG. The role of acetic acid is to enhance the migration rate of acylglycerols on the
TLC, as well as to form a more compact spots for the isomeric compounds (Thomas et al.
1965).

50
Table 1.8
The TLC developing solvents used for separation of 1-MAG and 2-MAG
Reference
TLC Visualization Proportion of TLC developing solvent, v/v/v
chloroform acetone methanol acetic acid
Serdarevich and Carroll
(1966)
50% H2SO4, charring
98 - 2 -
Becker et al. (1993),
Ando et al. (1996)
DCF solution; UV 96 4 - -
Angers et al. (1998)
DCF solution; UV 98 - 2 -
Turon et al. (2002)
DCF solution; UV 85 15 - 1
Shimada et al. (2003) H2SO4 in MeOH;
heat at 150 °C
96 4 - 1
The methods discussed above only enable us to determine the sn-1(3) and sn-2 positions
fatty acids in the TAG molecules, without differentiation between the sn-1 and sn-3 fatty
acid composition. Stereospecific analysis is conducted to differentiate sn-1 and sn-2
position, by using either pancreatic lipase hydrolysis or Grignard deacylation method to
produce 1,2-DAG. The 1,2-DAGs are then converted synthetically to phospholipids and
hydrolyzed by stereospecific phospholipase (Brockerhoff, 1971). By using this method, the
exact fatty acid composition for sn-1, sn-2 and sn-3 positions can be established (Table 1.8).
Fatty acid composition of oils and fats is usually determined by preparation of methyl
esters of fatty acids. These fatty acid methyl esters (FAME) that derived from fatty acids of
acyglycerols are suitable for gas chromatography analysis. FAME can be prepared by a few
methods, such as boron trifluoride-methanol method, alkaline methanolysis method, acidic
methanolysis method, and rapid method.

51
2 EXPERIMENTAL
2.1 Materials
Refined, bleached and deodorized palm olein of IV 62 was purchased from Golden
Jomalina Food Industries Sdn. Bhd (Sime Darby Plantation). The 1,3-specific immobilized
lipases; Lipozyme® TL IM and Lipozyme® RM IM were obtained from Novozymes A/S.
Chromatography grade solvents (n-hexane, heptane, acetone, chloroform and acetonitrile)
and analytical grade 2-propanol were purchased from Fischer Scientific. The sn-2 analysis
reagent, pancreatic lipase (from porcine source) and Allyl magnesium bromide solution
(AMB) were obtained from Sigma-Aldrich. The laboratory reagents used were bile salt
(Uni-chem), tris-hydroxymethylaminomethane (Fischer Scientific), phenolphathalein (APS
Finechem, Australia), Alumina grade Super I (Sigma, Germany), silica gel 60G (Merck,
Germany), Calcium Choride solutions (BDH Limited Poole England), sodium chloride;
saturated aqueous solution (Prolabo France), sodium sulphate anhydrous (systerm),
borontrifluoride; methanolic solution (Merck, Germany), hydrochloric acid, 36 % and
acetic acid, 98 % (Systerm). In conducting the IV tests, the reagent used were Wijs reagent,
potassium iodide, and starch powder from Merck, Germany, and sodium thiosulphate from
J.T. Baker, USA. Standard material used for the TAG analysis by high-performance liquid
chromatography (HPLC) was a secondary standard R.B.D palm oil purchased from Golden
Jomalina Sdn. Bhd. while standard used in fatty acid composition and sn-2 positions
determination by gas-chromatography was FAME mix RM6 obtained from Supelco.
2.2 Enzymatic Interesterification
2.2.1 Laboratory-scale (lab-scale) Batch Interesterification
The objective of this experiment is to study the efficiency of two commercial immobilized
enzymes; Lipozyme® TL IM and Lipozyme® RM IM in catalyzing the interesterification

52
of palm olein IV 62. The optimum conditions were determined by the TAG composition of
the reaction products. Two parameters; the enzyme to oil ratio and the reaction time were
studied for optimization of the reaction conditions. In addition, the specificity of both
enzymes in retaining the fatty acids at the 2-position was investigated.
The laboratory-scale (lab-scale) batch interesterification was conducted by using 65 °C
water bath shaker. 2 %w/w (0.60 ± 0.01 g) of Lipozyme® TL IM was weighed separately
into six 100 mL conical flask with stopper. 30.0 ± 0.02 g of palm olein with iodine value
(IV) of 62 was added into each conical flask. The conical flasks were closed tightly with
the stopper and wrapped with a few layers of parafilm followed by aluminum foil. The
water bath shaker was filled with clean distilled water and set at 65 °C. As temperature
achieved 65 °C, the six cornical flasks were fitted simultaneously into the water bath and
shaken at 200 rpm. A conical flask was taken out for filtration at 1, 2, 3, 4, 8 and 24 hours
of reaction. The experiment was conducted in duplicate. The same procedures were carried
out for 5 %w/w (1.50 ± 0.01 g) and 10 %w/w (3.00 ± 0.01 g) enzyme ratio, for reactions
catalyzed by Lipozyme® RM IM.
The entire products of the lab-scale interesterification were analyzed for their TAG
compositions. Only the selected oil samples were analyzed for the sn-2 fatty acids by using
Grignard degradation method.
2.2.2 Pilot-scale Interesterification
The batch interesterifications were conducted according to the optimum condition of the
lab-scale interesterifications. On the other hand, the continuous interesterification was
conducted by using 100 kg packed-bed reactor from Novozyme Sdn. Bhd. The reaction was

53
carried out by referring to the standard method provided by Novozyme Company. The large
pore size of the reactor screen allows only the Lipozyme® TL IM to be used.
The pilot-scale interesterification products were analyzed for their TAG profiles, slip
melting point (SMP), sn-2 fatty acids (by pancreatic lipase hydrolysis), thermal properties
(by differential scanning calorimeter (DSC)), solid fat content (SFC), and cloud point (CP).
2.2.2.1 Batch Interesterification by Lipozyme® RM IM (Batch RMIM)
The pilot-scale batch interesterification by Lipozyme® RM IM was conducted according to
the optimum condition obtained from the lab-scale interesterification. Two factors; the
TAG composition and the enzyme cost were taken into consideration. Due to high cost of
Lipozyme® RM IM, the reaction was conducted by using 2 %w/w enzyme rather than 5 %
w/w or 10 % w/w. The reaction was carried out at High Oleic Pilot Plant in the Malaysian
Palm Oil Board. This batch reactor with capacity of 100 kg is modified from the chemical
interesterification reactor used in the pilot-plant.
Initially, the pre-heated 100 kg palm olein IV 62 was loaded into the batch reactor followed
by addition of 2.0 kg Lipozyme® RM IM. The temperature of the reactor was adjusted to
65 ± 3 ºC by controlling of steam and cooling water. The reactor was blanketed with
nitrogen gas to avoid the presence of moisture during the reaction. The reactor was
equipped with an agitation tool. The reaction was conducted for 24 hours to obtain a
product with desired high percentages of triunsaturated and trisaturated TAGs. The
interesterified product was collected into two containers and stored in the cold room before
used for dry fractionation.

54
2.2.2.2 Batch Interesterification by Lipozyme® TL IM (Batch TLIM)
The pilot-scale batch interesterification by Lipozyme® TL IM was designed according to
the results of the lab-scale interesterification. The lab-scale results showed that 5 % w/w is
the most suitable dosage used for the reaction due to shorter time needed in achieving
equilibrium stage as compared to 2 %w/w. Moreover, the cost of Lipozyme® TL IM is
three times cheaper than Lipozyme® RM IM. Therefore, 5 % w/w ratio to oil was chosen
to implement in the reaction. The reaction was conducted by using the same reactor as the
batch interesterification by Lipozyme® RM IM. In this experiment, the pre-heated 90 kg of
palm olein IV 62 was loaded into the reactor and 4.5 kg of Lipozyme ® TL IM was added
afterward. The temperature used in the reaction was 65 ± 3 ºC. The reaction was only
conducted for eight hours which is the optimum time indicated in the lab-scale experiment.
The interesterified products were collected into two containers and stored in the cold room.
2.2.2.3 Continuous Interesterification by Lipozyme® TL IM (packed-bed TLIM)
Interesterification reaction of palm olein by Lipozyme® TL IM was carried out by using 10
kg pilot-scale continuous enzyme bed reactor (Novozyme). Initially, 5 kg of Lipozyme
TL IM was fed into the clean column of the reactor. The condition of the reactor was
monitored at 65 C. Feed palm olein of IV 62 was loaded onto the column for the purpose
of lipase conditioning. The flow rate of the feed was adjusted to 2 kg/hour for every kg of
lipase by controlling the frequency of the pump. Oil samples were collected at every 15
minutes to determine the stage of conditioning. The interesterified product was collected
once the FFA content was reduced to a constant value. The product was collected and
stored in two containers.
55
2.3 Dry Fractionation
2.3.1 Lab-scale Fractionation
The pilot-scale interesterified products from batch interesterification by Lipozyme® TL IM
and Lipozyme® RM IM, and the continuous interesterification by Lipozyme® TL IM were
fractionated in lab-scale dry fractionation. The fractionation temperatures used for each
interesterified products were slightly different due to the differences in the TAG
composition and the physical properties.
The lab-scale olein fractions were analyzed for their IV, fatty acid composition, and TAG
profiles.
2.3.1.1 Lab-scale Fractionation of Batch RMIM Products
100.0 g of oil sample was weighed into a stainless steel container. The container was fitted
on a water bath that was connected to a temperature programmer. An agitation tool was
attached to the device and set at 25-27 rpm. Temperature programmer was set through the
water bath computer software. The temperature program included melting of the oil at
65 C to eliminate any crystal present in the oil, followed by cooling in a controlled manner.
The oils were cooled slowly to the fractionation temperatures and held at that particular
temperature for 140 minutes. During the cooling process, supercooling of the oil occurred,
resulting in nucleation and crystal growth (Zaliha et al., 2004; Kellens et al., 2007). Five
different products at fractionation temperatures of 8 C, 10 C, 12 C, 15 C, and 18 C
were investigated. Each trial was carried out in duplicate. The oil and crystal phases
appeared as semi-solid slurry after the crystal growth becomes stable. The slurry was then
separated into olein and stearin fractions by vacuum filtration.

56
2.3.1.2 Lab-scale Fractionation of Batch TLIM Products
The batch interesterified product by Lipozyme® TL IM is harder in physical appearance as
compared to the batch interesterified product by Lipozyme® RM IM. Therefore, the
fractionation temperatures used in the lab-scale fractionation trials were 9 C, 12 C, 15 C,
18 C, and 21 C which were slightly higher than the fractionation temperatures used for
the product derived from Lipozyme® RM IM. In this experiment, the same procedures and
instrument were applied as described in section 2.3.1.1.
2.3.1.3 Lab-scale Fractionation of Packed-bed TLIM Products
The fractionation temperatures used for fractionation of packed-bed TLIM product were the
same as temperatures used in the fractionation of batch TLIM products, which were 9 C,
12 C, 15 C, 18 C, and 21 C.
2.3.1.4 Cooling Programs for Lab-scale Dry Fractionation
The Cooling programs for lab-scale dry fractionation were illustrated in Table 2.1-2.7. The
same cooling programs were used in fractionating all of the interesterified palm olein
(Batch RMIM, Batch TLIM, and Packed-bed TLIM) for dry fractionation at 12 °C, 15 °C,
and 18 °C as shown in Table 2.4, Table 2.5, and Table 2.6, respectively.
Table 2.1
The cooling programs for lab-sccale dry fractionation at 8 °C
Step Temperature, °C Duration (min)
1 65 50
2 35 30
3 20 40
4 12 40
5 8 140

57
Table 2.2
The cooling programs for lab-scale dry fractionation at 9 °C
Step Temperature, °C Duration (min)
1 65 50
2 35 20
3 23 30
4 16 40
5 13 40
6 9 140
Table 2.3
The cooling programs for lab-scale dry fractionation at 10 °C
Step Temperature, °C Duration (min)
1 65 50
2 35 30
3 25 30
4 14 40
5 10 140
Table 2.4
The cooling programs for lab-scale dry fractionation at 12 °C
Step Temperature, °C Duration (min)
1 65 50
2 35 25
3 23 25
4 16 70
5 12 140
Table 2.5
The cooling programs for lab-scale dry fractionation at 15 °C
Step Temperature, °C Duration (min)
1 65 60
2 35 30
3 25 30
4 18 60
5 15 140
Table 2.6
The cooling programs for lab-scale dry fractionation at 18 °C
Step Temperature, °C Duration (min)
1 65 60
2 35 30
3 25 30
4 21 60
5 18 140

58
Table 2.7
The cooling programs for lab-scale dry fractionation at 21 °C
Step Temperature, °C Duration (min)
1 65 50
2 35 30
3 28 30
4 23 50
5 21 140
2.3.2 Pilot-scale Fractionations
10.0 kg of oil sample was fed into a 10 kg double-jacketed De Smet crystallizer attached
with an agitation tool with rate of 12 rpm (Figure 2.1). The oil was first heated at 65 C for
one hour to destroy all crystal structures, followed by cooling in a controlled manner. The
crystallization temperature was set at the TOP for 160 minutes. TOP is the optimum
temperature determined from the lab-scale fractionation for each interesterified product.
Crystal development of the oil during the crystallization period was studied by pulsed
nuclear magnetic resonance (PNMR).
The solid and liquid phases of the slurry were separated by a filter press (Yabuta, Japan)
(Figure 2.2). The filter press consists of filter membrane plates and filter chamber plates.
To avoid the melting and deforming of the crystal during filtration, the filter press was
chilled to similar temperature of the slurry before the filtration. The slurry was fed into the
filter press with pressure rate of 0.5 bar min-1
and gradually increasing to a maximum
pressure of 2.0 bars in 10 min.

59
Figure 2.1
10 kg pilot-scale Desmet Ballestra crystallizer for pilot-scale fractionation
Figure 2.2
10 kg pilot-scale membrane filter press (Yabuta) used for pilot-scale fractionation

60
Squeezing of the stearin cake inside the chamber was carried out by pumping chilled water
into the filter membrane plates. Initially, the stearin cake was squeezed at 0.5 bar and
slowly increased the pressure at rate of 0.5 bar min -1
in the first 10 min. The pressure rate
was then increased to 1.0 bar min-1
to a maximum pressure of 15 bars. The filter press was
opened and the stearin cake was collected in a hopper under the filter. The fractionation
was conducted in duplicate. The oleins and stearins were weighed and analyzed.
The pilot-scale fractionated oleins and stearins were analyzed for their fatty acid
composition, TAG profiles, SFC, SMP, thermal properties (by DSC) and IV. The CPs of
oleins were determined.
2.3.2.1 Cooling Programs for Pilot-scale Dry Fractionation
The cooling programs used in pilot-scale dry fractionation of packed-bed TLIM product
was shown in Table 2.8, whereas dry fractionation of batch TLIM and batch RMIM
products were conducted using cooling program as illustrated in Table 2.9.
Table 2.8
The cooling program of pilot-scale dry fractionation of packed-bed TLIM product at 12 °C
Step Temperature, °C Duration (min)
1 65 60
2 35 30
3 23 30
4 16 100
5 12 180
Table 2.9
The cooling program of pilot-scale dry fractionation of batch RMIM and batch TLIM products at 8 °C
Step Temperature, °C Duration (min)
1 65 40
2 35 40
3 25 40
4 15 60
5 10 60
6 8 160

61
2.3.3 Dry Fractionation of Palm Olein IV 62
Lab-scale and pilot-scale fractionation of palm olein IV 62 was conducted at temperature of
5 °C and 2 °C, respectively. Cooling programs were illustrated in Table 2.10 and Table
2.11. Each trial was conducted in duplicate.
Table 2.10
The cooling program of lab-scale dry fractionation palm olein IV 62 at 5 °C
Step Temperature, °C Duration (min)
1 65 50
2 35 30
3 18 40
4 12 40
5 8 40
6 5 120
Table 2.11
The cooling program of pilot-scale dry fractionation palm olein IV 62 at 2 °C
Step Temperature, °C Duration (min)
1 65 50
2 45 30
3 35 30
4 18 30
5 12 40
6 8 40
7 5 80
8 2 120
2.4 Analysis Methods
2.4.1 HPLC Separation of Triacylglycerols (TAGs)
TAG composition of the samples was determined by using reversed-phase high
performance liquid chromatography (HPLC) from Gilson (France). The instrument was
equipped with a refractive index detector from Waters 2410, USA, and Lichrospher®100
RP-18 column (250 cm) with 5 µm particle size. About 0.045 g of oil samples were
weighed and diluted in acetone for injection into the HPLC column. The mobile phase used
in the analysis was a mixture of equal volumes of acetone and acetonitrile at a flow rate of
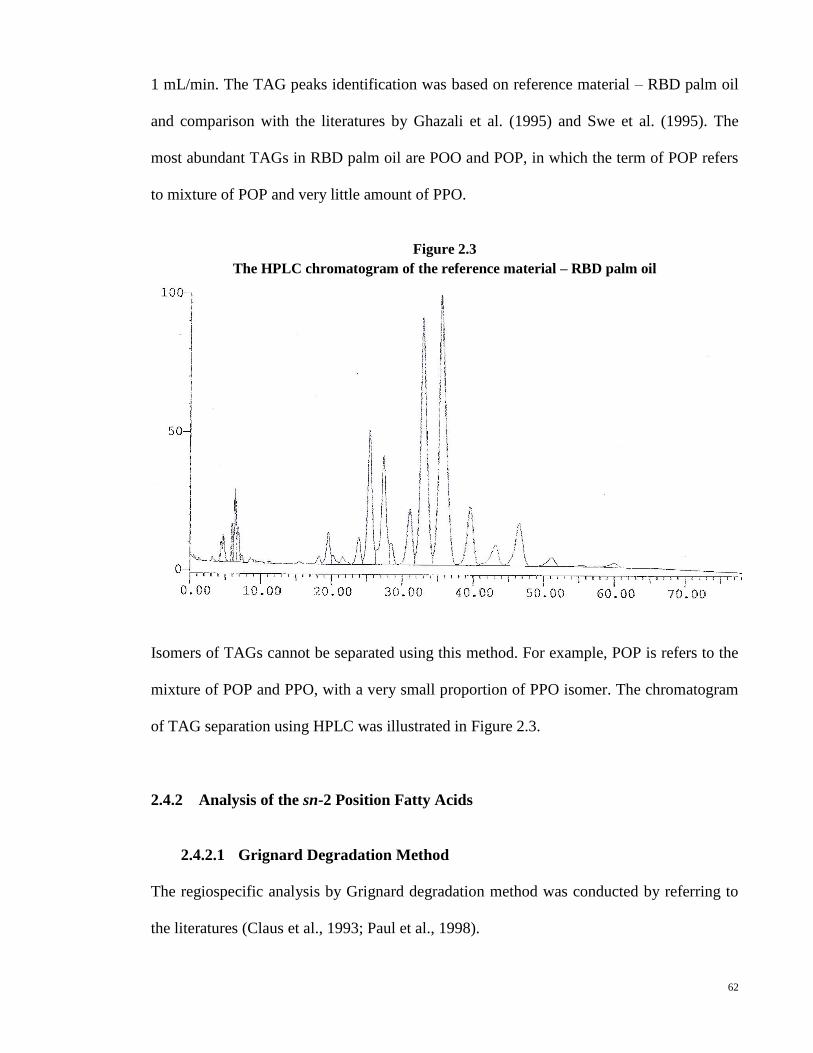
62
1 mL/min. The TAG peaks identification was based on reference material – RBD palm oil
and comparison with the literatures by Ghazali et al. (1995) and Swe et al. (1995). The
most abundant TAGs in RBD palm oil are POO and POP, in which the term of POP refers
to mixture of POP and very little amount of PPO.
Figure 2.3
The HPLC chromatogram of the reference material – RBD palm oil
Isomers of TAGs cannot be separated using this method. For example, POP is refers to the
mixture of POP and PPO, with a very small proportion of PPO isomer. The chromatogram
of TAG separation using HPLC was illustrated in Figure 2.3.
2.4.2 Analysis of the sn-2 Position Fatty Acids
2.4.2.1 Grignard Degradation Method
The regiospecific analysis by Grignard degradation method was conducted by referring to
the literatures (Claus et al., 1993; Paul et al., 1998).

63
2.4.2.1.1 Preparation of Thin Layer Chromatography (TLC)
Five and a half clean glass plates (with same thickness) were placed onto the TLC spreader
with the half plate on the left end. The plates were clean by wiping with acetone for a few
times. 45 g of silica gel G (Fluka or Fischer) was weighed into a 500 mL conical flask.
Distilled water (90 mL) was added into the flask and shook vigorously for exactly one
minute. The silica gel mixture was spread smoothly from left to right onto the plates with a
layer thickness of 0.5mm. The TLC plates were taken apart from each another immediately
after spreading. After leaving in the room temperature for two hours, the plates were placed
in the TLC plate holder and dried overnight at room temperature. The TLC plates were
activated by heating at 110°C for one hour. After cooling to room temperature, the plates
were sprayed with 0.4 M boric acid solution until fully saturated. The plates were dried
overnight in the fume hood and then stored in the desiccators before used.
2.4.2.1.2 Purification of Oil Samples
The oil samples need to be purified to get rid of FFA, and the partial glycerides
(monoacylglycerols and diacylglycerols) that may influence the degradation reaction. The
oil is purified by conventional liquid chromatography. 200 g of silica gel 60G was weighed
and transferred into a tray. The silica gel was heated for 5.5 hours and kept in desiccators
for further usage.
60 g of the dry silica gel was weighed into a 500 mL conical flask and 5% water was added.
The conical flask was shaken vigorously to homogenize the mixture and left for overnight.
The “water treated” silica gel (20 g) was covered with petroleum spirit (petroleum ether)
and stirred to remove air bubbles. About 10 mL of petroleum spirit was transferred into the
column followed by the silica gel. Some anhydrous sodium sulphate was added onto the top

64
of the column. 5 g of oil samples was dissolved in 100 mL of a solvent mixture of
petroleum ether and diethyl ether with ratio of 95: 5. The solution was transferred into the
silica packed-column. The flow was adjusted to about 3-5 mL/min, and the effluent was
collected in a 500 mL conical flask. Another 150 mL of the solvent mixture was added to
flush the column.
2.4.2.1.3 Degradation Reaction
Four drops of oil sample (approximately 50-60 mg) was weighed into a clean 50 mL round
bottom flask. Diethyl ether (10 mL) was added to dissolve the oil sample. The solution was
stirred by using magnetic stirrer. 0.3 mL of AMB solution was withdrawn with a 1 mL
glass syringe and added into the solution. The syringe has been flushed with nitrogen gas
before used to eliminate the presence of air. The diethyl ether solution became opaque,
indicating a spontaneous reaction. After exactly one minute, 8 mL of acidic buffer (1 mL of
37 % hydrochloric acid in 36 mL of 0.4 M boric acid) was added to neutralize the
magnesium hydroxide which formed in the reaction mixture upon addition of water. The
mixture was transferred into a test tube. The aqueous phase was removed by using a
dropper. While the organic phase (diethyl ether phase) was washed twice with 8 mL of 0.4
M boric acid solution to remove the excess hydrochloric acid. The ether phase was dried
briefly with some sodium sulphate anhydrous before transfer to a small vial. The ether
phase was dried out by blowing with nitrogen gas. The acyglycerols mixture was re-
dissolved in about 300 µL of diethyl ether.
2.4.2.1.4 TLC Separation of Acylglycerols
The sample was applied onto a boric acid impregnated TLC plate by using 0.1 mL syringe.
The spot must be as small as possible to prevent tailing effect of the TLC bands. The TLC
65
plate was developed in a saturated chamber with the developing solvent
(chloroform/acetone; 90:10). The saturation of the TLC chamber is indicated by the use of
chromatography paper. The plate was taken out after 50 minutes and dried in the fume hood
for about five minutes. The plate was placed into the saturated chamber once again for
another 50 minutes. Then the plate was dried in fume hood, and sprayed with 2,7-
dichlorofluoresceine. Visualization of the acylglycerols bands was done by using UV-lamp.
The 2-monoacylglycerols (2-MAG) band (second band from the baseline) was scrapped
into a vial. The 2-MAG was extracted into a 25 mL round bottom flask by adding about 3
mL of diethyl ether for three times. The filter paper was flushed for a few times to ensure
complete extraction.
2.4.2.1.5 Preparation of FAME: Boron Trifluoride Methods
The solvent of the extract was evaporated by rotator evaporator. The methylation of the
product (2-MAG) was conducted by using boron trifluoride method according to MPOB
Test Methods P3.4-part 1 (2005). Initially, 4 mL of methanolic NaOH solution (0.4 M
NaOH in methanol) and boiling aid were added into the flask with the test portion. The
flask was fitted with the condenser. The test portion was boiled under reflux until fully
dissolved (this usually takes 5 minutes). 5 mL of boron trifluoride solution was added from
the graduated pipette through the top of the condenser to the boiling liquid. About 2 mL of
heptane (chromatography grade) was added into the boiling mixture through the top of the
condenser (the precise amount does not affect the reaction) and continue boiling for 1 min.
Stop heating, the flask was cooled and removed from the condenser. A small portion of
saturated sodium chloride solution was added to the flask and swirled gently for several
times. Then, additional of more saturated sodium chloride solution to the flask in order to

66
bring up the level of liquid to the neck of the flask. The upper layer was transferred into a
vial and sodium sulphate was added to remove any traces of water.
2.4.2.1.6 Gas-chromatography (GC) Injection
The fatty acid methyl esters was filtered into a 1.5 mL vial by syringe filter (pore size =
0.45 μm; diameter = 17 mm). Then, the test portion was concentrated and transferred into a
GC-vial for analysis.
2.4.3 Thermal Analysis by Differential Scanning Calorimeter (DSC)
The thermal properties of the samples were measured using a Perkin Elmer differential
scanning calorimeter. The instrument was calibrated using indium by a temperature
programme of 120 C to 180 C at a rate of 5 C/min. Volatile sample pans made of
aluminium were used. The sample weights used were from 5-10 mg with an empty sample
pan as the reference. The sample was heated from 55 C to 80 C and held at this
temperature for 10 minutes to destroy the entire crystal structure. The sample was then
cooled to -55 C at a cooling rate of 5 C/min for the recording of the cooling thermogram.
The sample was held at this temperature for another 10 minutes. The melting properties of
the samples were then investigated by heating the sample from -55 C to 80 C at a heating
rate of 5 C /min. The melting thermogram was recorded.
2.4.4 Determination of Solid Fat Content (SFC)
SFC of the interesterified oils and olein fractions were determined by pulsed nuclear
magnetic resonance (PNMR) according to MPOB Test Methods P4.9-Section 1 (2005)
(indirect method).

67
2.4.5 Determination of Cloud Point (CP)
CP of palm olein of IV 62, and the interesterified products were determined according to
MPOB Test Methods P4.3 (2005).
2.4.6 Determination of Fatty Acids Composition
Preparations of fatty acid methyl ester (FAME) for the fatty acid composition analyses
were conducted according to MPOB Test Methods P3.4-Part 4 (2005). FAME was
investigated by using Agilent 5890N series II GC. 1 µL of the sample was injected into
SGE BPX70 column with dimension of 60 m × 0.25 µm × 0.25 µm. The instrument was
fitted with a Flame ionization detector (FID). The carrier gases used were hydrogen with
ratio of 1: 100 with air and a flow rate of 0.8 mL/min. Detector and injector temperature
were both set at 240 ºC. The separation of FAME was performed under isothermal
condition with temperature of 185 ºC. Standard material used for the fatty acid
identification was FAME mix RM6 purchased from Supelco.
2.4.7 Determination of Slip Melting Point (SMP)
SMP of the interesterified oils and feeds were determined by the MPOB Test Methods P4.2
(2005).
2.4.8 Determination of Iodine Value (IV)
IV of the olein fractions were determined by the MPOB p3.2 test method (MPOB Test
Methods P4.2, 2005).

68
3 RESULTS AND DISCUSSION
The main objective of this project was to produce low saturation palm oil products due to
the concern of consumers on the negative impact of saturated fatty acid (SFA) on human
health. To date, World Health Organization (WHO) recommended intake of 15 to 30%
energy of total fat intake, with maximum intake of 10% energy of SFA (WHO, 2003),
while American Heart Association (AHA) recommended fat intake of less than 7% energy
SFA out of total 30% energy fat intake per day in order to reduce the risk of coronary heart
disease (Lichtenstein et al., 2006). In other words, the saturation content for ideal oil for
good health should not exceed one third or 33.3% of the total fat intake.
Palm olein is somehow not considered as a recommended choice because of its relatively
higher SFA concentration compared to other vegetable oils. The SFA content in palm oil is
about 50%, 41.9-50.1% in palm olein with IV less than 60, and 34.4-43.3% in superolein
with IV greater than 60 (Siew, 2002). For high temperature cooking purposes, presence of
some saturation is necessary for better oil stability.
Although dry fractionation can significantly reduce the saturation content in palm oil, the
saturation level achieved is still considered high according to the dietary guidelines
recommended by AHA and WHO (WHO, 2003; Lichtenstein et al., 2006). Further
reduction of SFA in palm olein by dry fractionation requires some very specific conditions
in both crystallization and filtration steps. Low concentration of trisaturated TAGs causes
difficultly in controlling the crystallization of palm olein (Calliauw et al., 2007a). Therefore,
an alternative approach is proposed in this study to reduce the saturation content in palm
olein, which is via combination of enzymatic interesterification and dry fractionation.

69
Focus of the Study
The study was mainly focus on enzymatic interesterification using two enzymes;
Lipozyme® TL IM and Lipozyme® RM IM. The behaviors of the enzymes in catalyzing
interesterification had been looked into; including the effects of enzyme dosage in batch
interesterification, the sn-1 and sn-3 selectivity of the enzymes in catalyzing the
interesterification reactions, and the changes in physicochemical properties of palm olein
after the enzymatic interesterification reactions.
Lab-scale batch interesterification was conducted to study the equilibrium stage of batch
interesterification reactions based on TAGs conversion and the changes in solid fat content
(SFC). The main objective of conducting pilot-scale interesterifications was to obtained
sufficient amount of interesterified products for dry fractionation. The physicochemical
changes of palm olein were studied to evaluate the performance of the enzymes in each
pilot-scale reaction, as well as to select the suitable temperature range for dry fractionation.
Dry fractionations were conducted to remove the saturation content in the interesterified
products. Lab-scale fractionation of each interesterified product involved crystallization at
five fractionation temperatures that selected according to their physicochemical properties.
The purpose of conducting lab-scale fractionation was to optimize the dry fractionation
process, in order to obtain olein fractions with high quality and yield. Evaluation of the
olein fractions were based on some major analyses such as fatty acid composition, TAG
profiles, IV, SFC and thermal properties. Due to the inefficiency of lab-scale filtration step
– vacuum filtration, in separating the olein and stearin fractions, pilot-scale fractionations
were carried out to obtain the exact olein and stearin yields.

70
The final products derived from pilot-scale fractionations were fully evaluated. Single-step
dry fractionation of the feed olein – palm olein of IV 62 was conducted in both lab-scale
and pilot-scale. The process of single-step dry fractionation and enzymatic route process
were evaluated based on the final products quality and yield, as well as the ease of dry
fractionation process.
3.1 Enzymatic Interesterification
Generally, sn-1,3 specific enzymatic interesterification reaction allowed the rearrangements
of the fatty acids between and within the TAG molecules at the sn-1 and sn-3 positions of
the TAG backbone (Willis and Marangoni, 2002). This rearrangement of fatty acids will
lead to production of trisaturation TAGs that could be easily removed as solid fraction
during dry fractionation. Lipozyme® TL IM (Thermomyces lanuginose) and Lipozyme®
RM IM (Rhizomucor miehei) were used as 1,3-specific lipase to catalyze the reaction by
release of fatty acids specifically from the outer 1- and 3- positions of TAGs.
3.1.1 Equilibrium Stage for Batch Reactions
Lab-scale interesterification was conducted in batch reaction to study the effects of enzyme
dosage to the reaction rate, as well as to determine the equilibrium stage for each reaction.
Two parameters, including the changes of TAG composition and SFC over 24 hours of
reaction were studied to determine the equilibrium stage for each reaction. For both lab-
scale batch interesterification reactions, enzyme dosage of 2, 5, and 10 %w/w were used.
All reactions were conducted at 65 °C.
71
3.1.1.1 Equilibrium Stage for Batch TLIM
The enzymatic interesterification reaction allowed rearrangement of fatty acids that will
lead to formation of new TAGs, which would alter the chemical properties of the oil and
therefore the physical properties. In comparison, the reaction rate for enzymatic
interesterification was relatively slower than chemical interesterification (Novozyme, 2004).
The reaction can be terminated at any time by separating the enzymes from the oil. Hence,
determination of the physicochemical properties of the samples at particular reaction time
can be used to determine the time needed to achieve equilibrium stage for each reaction.
Figure 3.1 showed the changes of some TAG species in palm olein IV 62 over 24 hours of
reaction. In overall, trisaturated TAGs (PPP and PPS) and triunsaturated TAGs (OLL, OLO
and OOO) increased, while diunsaturated TAGs (PLL, PLO, POO and SOO) and
disaturated TAGs (PLP) decreased for all the lab-scale batch TLIM interesterification
reactions. The raw data for TAG composition of lab-scale batch TLIM products were
illustrated in Appendix C-E.

72
Figure 3.1
Batch TLIM: changes of TAG composition of palm olein IV 62 during 24 hours reaction; (A)
PPP content, (B) OOO content, (C) POO content and (D) PLP content

73
Figure 3.1, continued
PPP increased from 0.4% to about 4% for 2, 5 and 10 %w/w enzyme dosage after 24 hours
of reaction, which means all reactions have achieved equilibrium at 24 hours reaction.

74
Figure 3.1 (A) and (B) showed that the rate of increasing of PPP and OOO for 5 %w/w and
10 %w/w were about the same. At the beginning of the reaction, the rate of TAGs
conversion for 5 %w/w enzyme ratio was slightly higher than 10 %w/w reaction. At 8
hours reaction, the amount of PPP for 10 %w/w reaction had overtaken 5 %w/w reaction
and achieved optimum PPP which was 4.4%.
The formation of trisaturated TAGs during 1,3-specific enzymatic interesterification was
because of the presence of a small amount of TAGs with palmitic acid at the sn-2 position,
for example, PPO, OPO, PPL, OPL, and so on (Tan, 1979; Gee, 2007). These TAGs were
thus used as backbone for production of trisaturated TAGs such as PPP and PPS.
Figure 3.2 showed the SFC of the lab-scale batch TLIM interesterified products at ambient
temperature (25 °C). This analysis could be a quick indicator to study the reaction as it
could reflect the amount of trisaturated TAGs such as PPP and PPS produced in the
reaction. This had been proven as the SFC was increased with increased of trisaturated
TAGs, such as PPP (Figure 3.1 (A)). The higher formation of OOO TAG appears not
sufficient to suppress the effect of the higher melting PPP. The highest SFC achieved was
12% with 10 %w/w enzyme dosage, and slightly lower SFC was observed for 5 %w/w and
2 %w/w reactions. The formation of new TAGs such as PPP and PPS which has lower
solubility in the liquid phase, would improve its ability to produce crystals and thus the
higher SFC observed (Gunstone, 2001b).

75
Figure 3.2
SFC (%) of the interesterified products of 2, 5, and 10%w/w Lipozyme® TL IM at 25 °C
Figure 3.1 (B) showed important information on investigating the reaction rate and the
equilibrium stage of the batch TLIM reaction. OOO content was increased to 10.2%
concentration for both 5 and 10%w/w reactions. Both reactions reached equilibrium OOO
content at 8 hours of reaction. The same phenomenon was observed in Figure 3.1 (C) and
(D), in which POO and PLP reduced at the almost same rate and achieved equilibrium
composition at 8 hours of reaction. In comparison, the rate of TAGs conversion for 2 %w/w
was relatively much slower compared to both of the higher dosage reactions.
For industrial processes, cost of production, yield and quality of the products are the
important parameters for profit optimization (Xu, 2003). In this lab-scale batch TLIM study,

76
it was clear that 5 %w/w was the optimum enzyme dosage, as it promised adequately high
conversion rate which was comparable to 10 %w/w enzyme dosage. The reaction time
required for this reaction was 8 hours. Although 2 %w/w is cheaper in term of the enzyme
cost, much longer time (3 fold) was required for it to achieve equilibrium. This would
increase the production cost as long reaction time will lead to higher energy consumption
plus more manpower needed for conducting the reaction.
3.1.1.2 Equilibrium Stage for Batch RMIM
Figure 3.3 showed the changes of some TAG species in palm olein IV 62 over 24 hours of
reaction with Lipozyme® RM IM in lab-scale batch reactor. Similar to lab-scale batch
TLIM reactions, the lab-scale batch RMIM reaction also resulted in an increase of
trisaturated TAGs (PPP and PPS) and triunsaturated TAGs (OLL, OLO and OOO), and a
reduction of diunsaturated TAGs (PLL, PLO, POO and SOO) and disaturated TAGs (PLP).
Some TAG species remain unchanged, including MLP, POP, POS and SOS. The data for
TAG composition were illustrated in Appendix F-H.
The rate of TAGs conversion was higher for higher enzyme dosage reactions (Figure 3.3).
Unlike the lab-scale batch TLIM reactions, different dosage of enzymes for the lab-scale
batch RMIM reactions gave significantly different TAG composition at the equilibrium
stage. The changes in TAG composition were increased sequentially with high enzyme
dosage. The highest changes achieved in 10 %w/w, followed by 5 %w/w and 2 %w/w
reactions. Figure 3.3 showed that PPP, OOO, POO, and PLP for 2 and 5 %w/w Lipozyme®
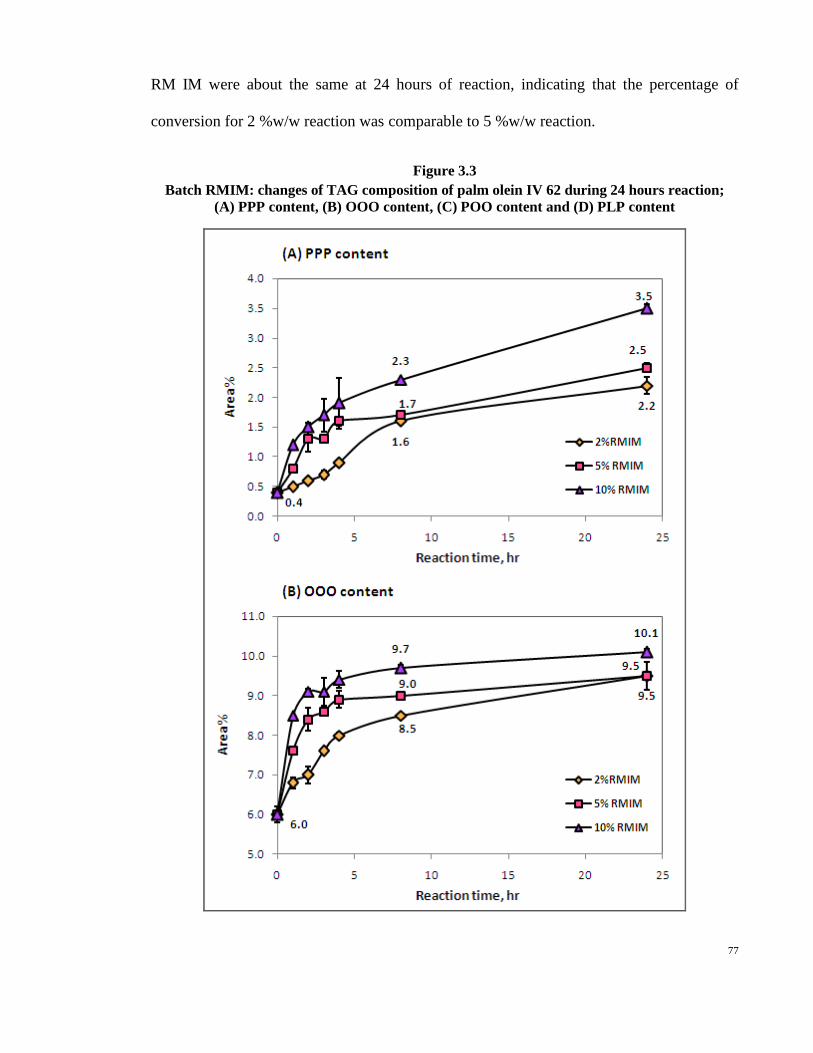
77
RM IM were about the same at 24 hours of reaction, indicating that the percentage of
conversion for 2 %w/w reaction was comparable to 5 %w/w reaction.
Figure 3.3
Batch RMIM: changes of TAG composition of palm olein IV 62 during 24 hours reaction;
(A) PPP content, (B) OOO content, (C) POO content and (D) PLP content

78
Figure 3.3, continued
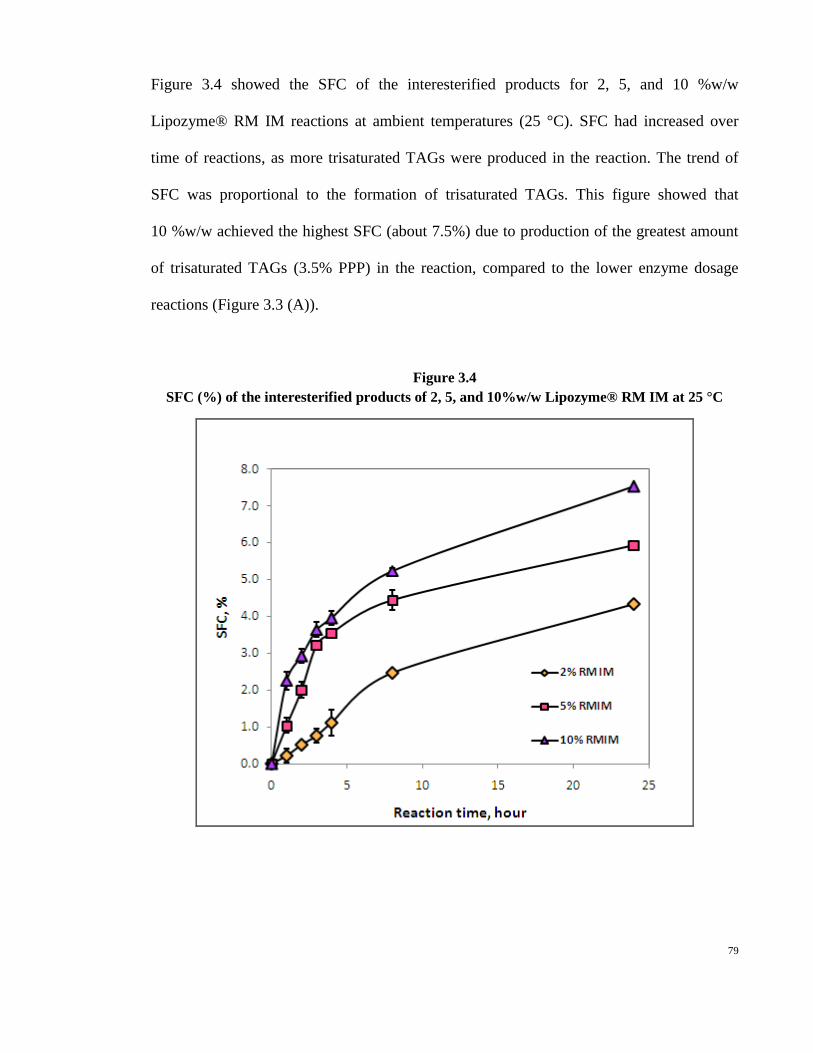
79
Figure 3.4 showed the SFC of the interesterified products for 2, 5, and 10 %w/w
Lipozyme® RM IM reactions at ambient temperatures (25 °C). SFC had increased over
time of reactions, as more trisaturated TAGs were produced in the reaction. The trend of
SFC was proportional to the formation of trisaturated TAGs. This figure showed that
10 %w/w achieved the highest SFC (about 7.5%) due to production of the greatest amount
of trisaturated TAGs (3.5% PPP) in the reaction, compared to the lower enzyme dosage
reactions (Figure 3.3 (A)).
Figure 3.4
SFC (%) of the interesterified products of 2, 5, and 10%w/w Lipozyme® RM IM at 25 °C

80
As mentioned before, cost of production is also a very important criterion for profit
optimization. The cost of Lipozyme® RM IM was at least 4 times more expensive than
Lipozyme® TL IM. Although 10 %w/w enzyme dosage gave the highest TAGs conversion
and adequately high reaction rate, lower enzyme dosage was preferred for this reaction. In
terms of the TAGs conversion, there was no significant difference in TAG composition for
interesterified products of 2 and 5 %w/w Lipozyme® RM IM. Hence, 2 %w/w was chosen
as the enzyme dosage to be used in the 100 kg scale-up enzymatic interesterification
process. The reaction had to be carried out for 24 hours in order to maximize the TAGs
conversion.
3.1.2 Characterization of the Pilot-scale Interesterification Products
The main objective of conducting pilot-scale interesterifications was to produce sufficient
amount of products for dry fractionation. Three pilot-scale (100 kg) enzymatic
interesterification processes were carried out. For pilot-scale batch interesterification, the
reactions were conducted according to the optimum enzyme dosage and reaction time
obtained in the lab-scale experiments, which was 5 %w/w for Lipozyme® TL IM and
2 %w/w for Lipozyme® RM IM. An additional packed-bed reaction was conducted by
using the 10 kg packed-bed reactor provided by Novozyme Co. The packed-bed reactor
was designed specifically for Lipozyme® TL IM with specific pore size. Thus, this reactor
cannot be used for Lipozyme® RM IM due to its smaller particle size. The flow rate used
in the packed-bed reaction was based on recommendation of Novozyme Co., in which the
flow rate used can ensure a complete interesterification reaction (Novozyme, 2004).

81
The physicochemical characteristics of the pilot-scale interesterified products were used to
verify the suitable temperature range to be used in dry fractionation in order to separate the
saturation components.
3.1.2.1 Chemical Properties of the Pilot-scale Interesterified Products
Triacylglycerols Composition
TAG composition of the pilot-scale interesterified products was shown in Table 3.1. Pilot-
scale interesterification increased the content of FFA & MAG, DAG and some TAG
species. In overall, the total triunsaturated and trisaturated TAGs were increased, while
total diunsaturated and disaturated TAGs were reduced after the enzymatic
interesterification reaction.

82
Table 3.1 Chemical properties: acylglycerols composition of the feed olein (POo IV62), and the pilot-
scale enzymatic interesterified products
Triacylglycerols POo IV 62 Packed-bed TL IM Batch TL IM Batch RM IM
FFA & MAG 0.2±0.0 2.6±0.1 3.0±0.1 1.0±0.2
DAG 6.2±0.0 5.9±0.0 11.2±0.1 8.0±0.0
Total triunsaturated 8.9±0.2 18.4±0.0 18.2±0.0 14.9±0.0
OLL 0.6±0.0 2.3±0.1 2.3±0.0 1.6±0.0
OLO 2.6±0.0 7.5±0.1 7.1±0.1 5.6±0.0
OOO 5.7±0.1 8.6±0.0 8.8±0.1 7.7±0.0
Total diunsaturated 53.7±0.2 40.0±0.1 38.2±0.1 43.9±0.0
PLL 3.3±0.1 2.7±0.0 2.8±0.1 3.0±0.1
PLO 15.0±0.0 13.3±0.0 12.8±0.0 14.1±0.0
POO 31.9±0.2 21.8±0.1 20.5±0.0 24.3±0.1
SOO 3.5±0.1 2.2±0.0 2.1±0.0 2.6±0.0
Total disaturated 30.9±0.0 27.8±0.1 25.1±0.1 30.4±0.1
MLP 0.4±0.1 0.7±0.1 0.8±0.1 0.8±0.1
PLP 9.5±0.0 6.1±0.1 5.6±0.1 7.7±0.0
POP 17.4±0.0 17.7±0.1 15.3±0.0 17.9±0.0
POS 3.2±0.1 3.1±0.1 3.0±0.0 3.6±0.1
SOS 0.4±0.0 0.4±0.0 0.4±0.0 0.5±0.0
Total trisaturated 0.1±0.0 5.5±0.0 4.5±0.0 1.9±0.0
PPP 0.1±0.0 4.3±0.0 3.5±0.0 1.5±0.0
PPS 0.0±0.0 1.2±0.0 1.0±0.0 0.4±0.0
Total TAG 93.6±0.0 91.7±0.1 86.0±0.2 91.1±0.2
Initially, palm olein contained 8.9% of triunsaturated TAGs with 5.7% of OOO content.
After the reaction, the amount of OOO increased from 5.7% to 8.6% and 8.8% for reaction
using Lipozyme® TL IM in packed-bed and batch reactor, respectively. In comparison, the
total triunsaturated TAGs conversion for batch RMIM was much lower, which was at least
3% lower than those reactions using Lipozyme® TL IM.
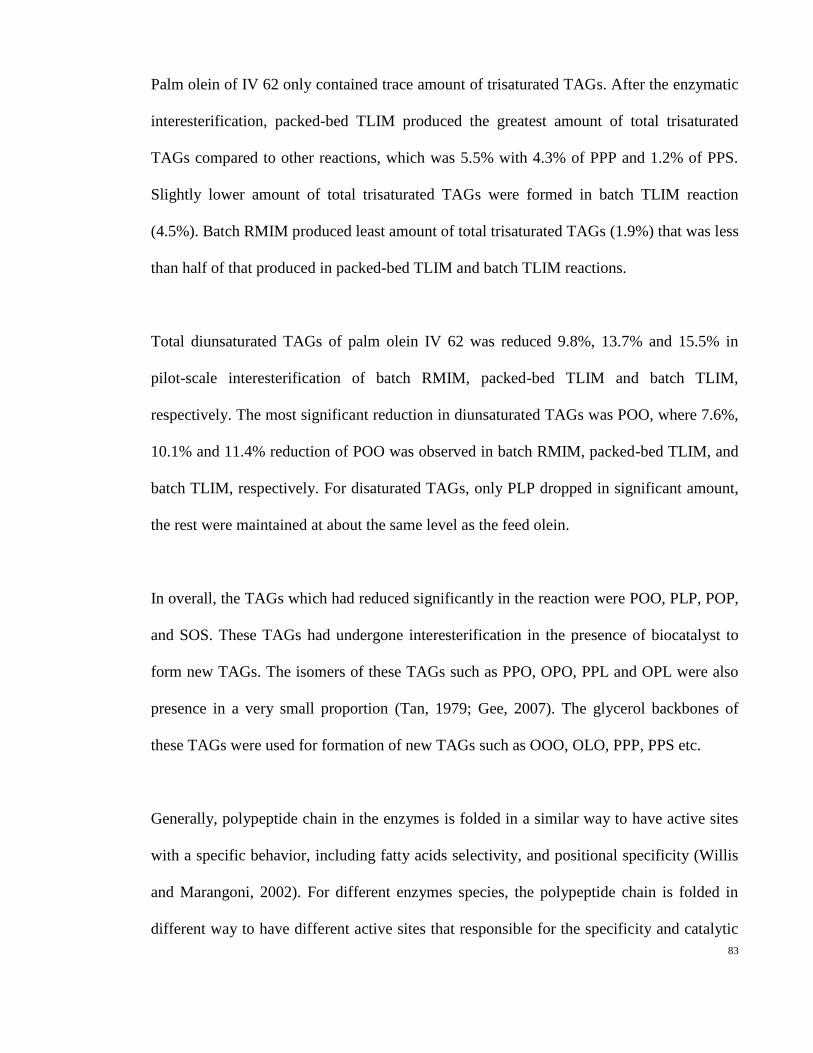
83
Palm olein of IV 62 only contained trace amount of trisaturated TAGs. After the enzymatic
interesterification, packed-bed TLIM produced the greatest amount of total trisaturated
TAGs compared to other reactions, which was 5.5% with 4.3% of PPP and 1.2% of PPS.
Slightly lower amount of total trisaturated TAGs were formed in batch TLIM reaction
(4.5%). Batch RMIM produced least amount of total trisaturated TAGs (1.9%) that was less
than half of that produced in packed-bed TLIM and batch TLIM reactions.
Total diunsaturated TAGs of palm olein IV 62 was reduced 9.8%, 13.7% and 15.5% in
pilot-scale interesterification of batch RMIM, packed-bed TLIM and batch TLIM,
respectively. The most significant reduction in diunsaturated TAGs was POO, where 7.6%,
10.1% and 11.4% reduction of POO was observed in batch RMIM, packed-bed TLIM, and
batch TLIM, respectively. For disaturated TAGs, only PLP dropped in significant amount,
the rest were maintained at about the same level as the feed olein.
In overall, the TAGs which had reduced significantly in the reaction were POO, PLP, POP,
and SOS. These TAGs had undergone interesterification in the presence of biocatalyst to
form new TAGs. The isomers of these TAGs such as PPO, OPO, PPL and OPL were also
presence in a very small proportion (Tan, 1979; Gee, 2007). The glycerol backbones of
these TAGs were used for formation of new TAGs such as OOO, OLO, PPP, PPS etc.
Generally, polypeptide chain in the enzymes is folded in a similar way to have active sites
with a specific behavior, including fatty acids selectivity, and positional specificity (Willis
and Marangoni, 2002). For different enzymes species, the polypeptide chain is folded in
different way to have different active sites that responsible for the specificity and catalytic

84
activity in the reaction (Willis and Marangoni, 2002). Therefore, the interesterified products
from interesterification using Lipozyme® TL IM in packed-bed and batch reactor had
similar TAG composition, which was very different from the interesterified product using
Lipozyme® RMIM. The slight different of TAG composition between packed-bed and
batch TLIM may be due to the difference in the reactor type, reaction condition and
reaction system (Quilan and Moore, 1993).
Positional Analysis
Both Lipozyme® TL IM (Thermomyces lanuginose) and Lipozyme® RM IM (Rhizomucor
miehei) are known as 1,3-specific lipases in which these lipases may retain the sn-2
position fatty acids in the glycerol backbone (Yang and Xu, 2001). The specificity
performance of enzyme is very dependent on the reaction system and conditions. In other
words, they can only perform their specificity under particular conditions (Natália et al.,
2006; Criado et al., 2007). Therefore, positional analysis was conducted to study the
specificity of the enzymes in catalyzing the interesterification reactions.
Figure 3.5 showed the sn-2 position fatty acids of the feed oil and the interesterified
products. Theoretically, the sn-2 position fatty acids should remain unchanged after 1,3-
specific interesterification. However, some positional randomization of fatty acid residues
in TAGs had occurred during these three enzymatic interesterifications as indicated in
Figure 3.5. In other words, the reaction had changed the fatty acid at the sn-2 position of the
TAGs.
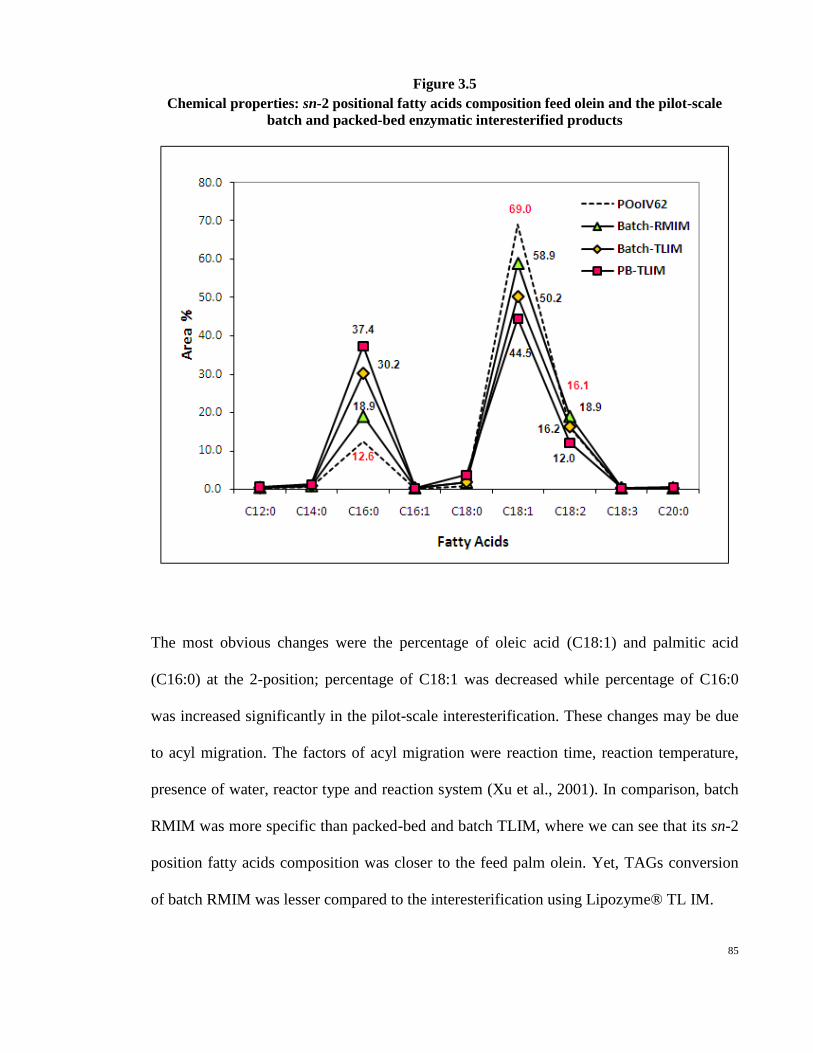
85
Figure 3.5
Chemical properties: sn-2 positional fatty acids composition feed olein and the pilot-scale
batch and packed-bed enzymatic interesterified products
The most obvious changes were the percentage of oleic acid (C18:1) and palmitic acid
(C16:0) at the 2-position; percentage of C18:1 was decreased while percentage of C16:0
was increased significantly in the pilot-scale interesterification. These changes may be due
to acyl migration. The factors of acyl migration were reaction time, reaction temperature,
presence of water, reactor type and reaction system (Xu et al., 2001). In comparison, batch
RMIM was more specific than packed-bed and batch TLIM, where we can see that its sn-2
position fatty acids composition was closer to the feed palm olein. Yet, TAGs conversion
of batch RMIM was lesser compared to the interesterification using Lipozyme® TL IM.

86
It can be concluded that under these reaction conditions, Lipozyme TL IM in packed-bed
and batch reaction did not permit a perfectly 1,3-specific interesterification which will
retain the sn-2 position fatty acids. Besides, the sn-1,3 specificity performance of
Lipozyme TL IM were different in two different reactor; packed-bed and batch reactor,
although the reactions were conducted at same temperature (65 °C). Batch TLIM was more
specific than packed-bed TLIM. In this case, the difference in the specificity might be due
to different in the reactor type or different in moisture content in the reaction system.
Although the enzymatic interesterifications did not perform perfect specificity in retaining
the fatty acids at the sn-2 position, the reactions were much better than chemical
interesterification that involves fully randomization of fatty acids. Moreover, enzymatic
interesterification is a greener technology without involving the use of any chemicals. To
date, the cost of enzymatic interesterification using packed-bed Lipozyme® TL IM is
apparently comparable with chemical interesterification (Novozyme, 2004).
3.1.2.2 Physical Properties of the Pilot-scale Interesterified Products
Solid Fat Content (SFC)
The SFC of the palm olein of IV 62 and the pilot-scale interesterified products were
measured as a function of temperature as illustrated in Figure 3.6. From the results, it was
found that the interesterified products had much higher SFC than the feed palm olein. At
0 °C, the interesterified product from packed-bed TLIM contained about 53% of solid fat
which was doubled of that in the feed olein (about 26%). The interesterified products from
batch TLIM and batch RMIM contained similar solid fat which was about 46% and 42%,

87
respectively at 0 °C. At 5 °C, SFC of batch RMIM dropped drastically to about 30%, while
batch TLIM still retained at about 41% of SFC.
Figure 3.6
Physical properties: SFC of the feed palm olein and the pilot-scale interesterified products
Apparently, SFC is very dependent on the TAG composition of the oil. The SFC of the feed
olein was the lowest as it did not contain any trisaturated TAGs. The solid fats/crystals
appeared in the feed olein was mainly contributed by disaturated TAGs which consists of
mainly POP.
The interesterified products from packed-bed and batch TLIM contained higher percentage
of trisaturated TAGs than batch RMIM as both of the products of Lipozyme® TL IM
contained higher trisaturated TAGs (5.5% and 4.5%, respectively) as compared to batch

88
RMIM (1.9%). The presence of trisaturated TAGs which was high in melting points will
promote crystallization, thus increased the SFC (Gunstone, 2001b).
Thermal Properties by Differential Scanning Calorimeter
DSC curves reveal the transition temperatures and heat of fusion or crystallization (Zaliha
et al., 2004). Figure 3.7 showed the thermal properties of the pilot-scale interesterified
products as compared to the feed palm olein. From the melting thermograms (Figure 3.7 B),
palm olein showed a sharp endothermic peak at about 3 °C, while the interesterified
products displayed broad peaks and shoulders at high temperature ranging from -20 °C to
40 °C. Both interesterified products from batch TLIM and packed-bed TLIM displayed a
broad shoulder at high temperature that ended at about 40 °C, whereas the broader shoulder
in melting curve of batch RMIM ended at about 30 °C.
In general, the melting and crystallization properties of the oil are dependent on the
chemical structure and polymorphic behavior of TAG mixture (Kellens et al., 2007). From
the crystallization thermograms (Figure 3.7 A), it was observed that the reaction products
started to crystallize at higher temperature as compared to the feed olein. A sharp peak was
observed in the crystallization thermogram of palm olein at 0 °C, meaning that the TAGs in
the feed olein was crystallized mostly at 0 °C. For the interesterified product from batch
RMIM, two broad exothermic peaks were observed at about 0 °C and 8 °C, indicating some
conversion of the low melting TAGs into new TAGs with higher melting properties.
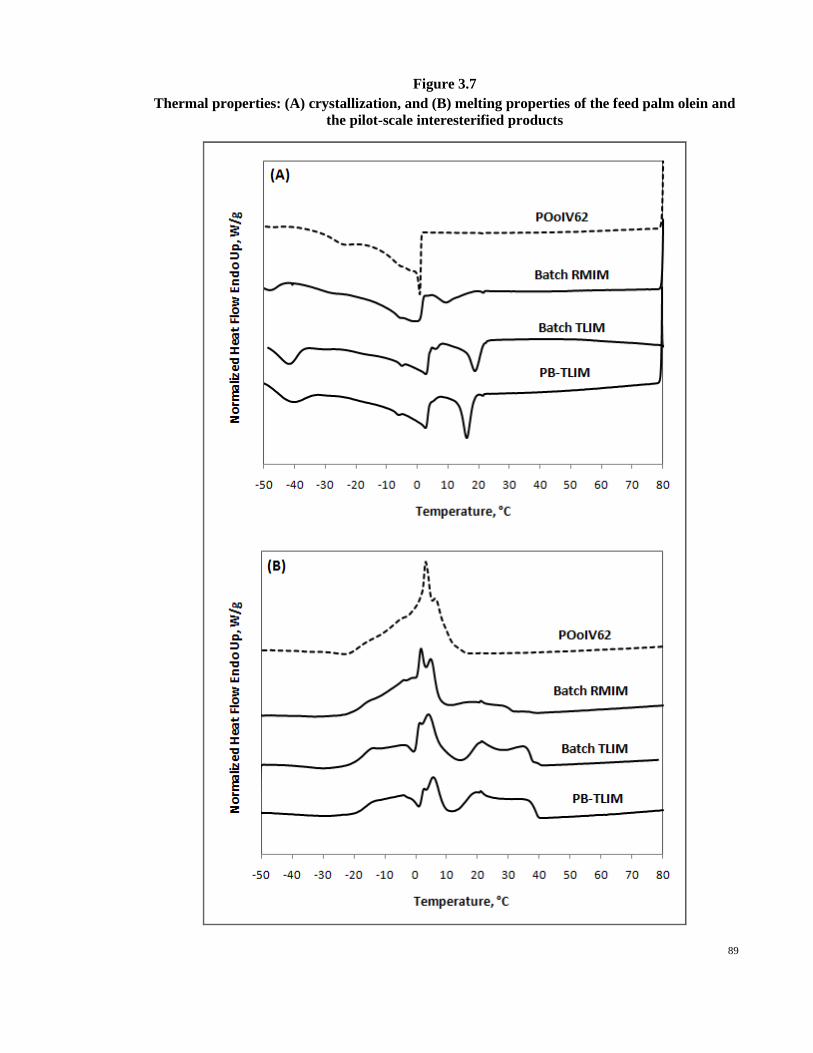
89
Figure 3.7
Thermal properties: (A) crystallization, and (B) melting properties of the feed palm olein and
the pilot-scale interesterified products
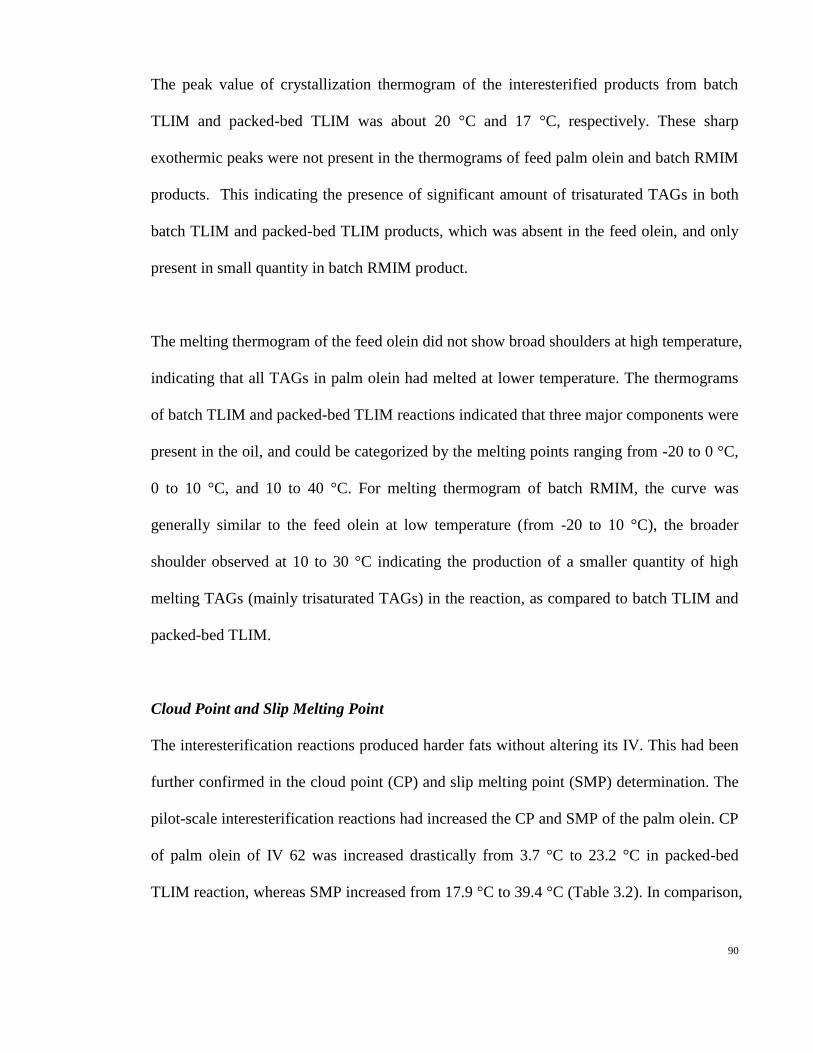
90
The peak value of crystallization thermogram of the interesterified products from batch
TLIM and packed-bed TLIM was about 20 °C and 17 °C, respectively. These sharp
exothermic peaks were not present in the thermograms of feed palm olein and batch RMIM
products. This indicating the presence of significant amount of trisaturated TAGs in both
batch TLIM and packed-bed TLIM products, which was absent in the feed olein, and only
present in small quantity in batch RMIM product.
The melting thermogram of the feed olein did not show broad shoulders at high temperature,
indicating that all TAGs in palm olein had melted at lower temperature. The thermograms
of batch TLIM and packed-bed TLIM reactions indicated that three major components were
present in the oil, and could be categorized by the melting points ranging from -20 to 0 °C,
0 to 10 °C, and 10 to 40 °C. For melting thermogram of batch RMIM, the curve was
generally similar to the feed olein at low temperature (from -20 to 10 °C), the broader
shoulder observed at 10 to 30 °C indicating the production of a smaller quantity of high
melting TAGs (mainly trisaturated TAGs) in the reaction, as compared to batch TLIM and
packed-bed TLIM.
Cloud Point and Slip Melting Point
The interesterification reactions produced harder fats without altering its IV. This had been
further confirmed in the cloud point (CP) and slip melting point (SMP) determination. The
pilot-scale interesterification reactions had increased the CP and SMP of the palm olein. CP
of palm olein of IV 62 was increased drastically from 3.7 °C to 23.2 °C in packed-bed
TLIM reaction, whereas SMP increased from 17.9 °C to 39.4 °C (Table 3.2). In comparison,

91
the product of batch TLIM had slightly lower SMP (35.7 °C), followed by batch RMIM
product (29.9).
Table 3.2
Cloud point and slip melting point of the pilot-scale intesterified products and the feed olein
Sample Cloud point, °C Slip melting point, °C
Feed POo IV 62 3.7 ± 0.3 17.9 ± 0.2
Batch RMIM 18.7 ± 0.4 29.9 ± 0.1
Batch TL IM 17.5 ±0.2 35.7 ± 0.2
Packed-bed TLIM 23.2 ± 0.2 39.4 ± 0.2
The physical properties of the modified oils were important for determination of suitable
temperatures for fractionation. In the crystallization diagrams (Figure 3.7 A), it was
observed that the high melting components in the batch TLIM and packed-bed TLIM
products were quiet significant, and could be easily separated at temperature in between
10 °C to 20 °C. Hence, 9, 12, 15, 18, and 21 °C were selected for lab-scale dry fractionation
of both batch TLIM and packed-bed TLIM.
The crystallization peak in batch RMIM thermogram at about 5 °C indicated that lower
temperature might be required for the removal of the high melting components. As
crystallization at too low temperature is not sensible due to the high processing cost, the
lowest temperature used was 8 °C. Therefore, 8, 10, 12, 15 and 18 °C were selected for
fractionation of batch RMIM product.
3.2 Fractionation
The objective of conducting fractionation of the interesterified products was to remove
some of the saturated TAGs that were formed during the interesterification reaction, in

92
order to lower the saturation content in the oil. In the lab-scale study, the temperatures used
to fractionate batch TLIM and packed-bed TLIM products were 9, 12, 15, 18, and 21 °C,
while 8, 10, 12, 15 and 18 °C were used for batch RMIM product.
Lab-scale fractionations were conducted to study the effectiveness of fractionation in
removing saturated TAGs, under various cooling programs. The filtration step in the lab-
scale fractionation involved the use of vacuum filter, without pressing of the stearin cake.
Therefore, pilot-scale fractionations were conducted based on the optimum temperature
obtained in the lab-scale fractionation, with the objective of determining the exact olein
yield which could not be obtained in the lab-scale fractionation.
3.2.1 Fractionation of Batch RMIM
Table 3.3 showed the yield and acyglycerols composition of the lab-scale and pilot-scale
olein fractions. The olein yields achieved in all the fractionation reactions were very high,
ranging from 71.2 to 84.2% due to the low concentration of saturated components in the
interesterified product. The TAGs and fatty acid composition of the corresponding stearin
fractions were showed in Appendix I and J, respectively. The results showed that the trends
of the stearin composition were not as expected due to the inaccuracy in vacuum filtration.
In comparison to the feed olein, the olein fractions contained higher amount of total
triunsaturated TAGs, in which OLL and OLO involved increment of more than one fold.
OOO content increased about 3% to the range of 8.2-8.7% after the modification processes.
Similar to the feed olein, the olein from fractionation at 8 °C still retained some trace

93
amount of trisaturated TAGs. Initially, the interesterified palm olein from batch RMIM
contained 1.9% of trisaturated TAGs (Table 3.1). The lab-scale fractionation had removed
majority of the trisaturated TAGs. Fractionation at higher temperatures; 18 °C retained the
trisaturated TAGs at 0.4%, indicating that 18 °C was not sufficiently low enough to remove
all trisaturated components.
Table 3.3
Yield and acylglycerols composition of the olein fractions from lab-scale and pilot-scale
fractionation of batch RMIM [PL8=pilot-scale olein at 8°C; PS8=pilot-scale stearin at 8°C]
Yield/
Acylglycerols POoIV62 Oln8C Oln10C Oln12C Oln15C Oln18C PL 8 PS 8
Yield (%) - 71.20.1 71.30.1 76.81.0 78.72.1 84.20.7 74.8±0.3 25.2±0.3
Total DAG 6.2±0.0 7.40.8 8.00.4 8.00.2 7.80.2 7.90.4 7.60.0 10.30.2
OLL 0.6±0.0 1.50.1 1.40.0 1.40.0 1.40.0 1.40.1 1.50.0 0.80.0
OLO 2.6±0.0 5.90.0 6.00.1 5.80.1 5.80.1 5.60.0 6.00.0 3.60.0
OOO 5.7±0.1 8.60.1 8.70.0 8.50.1 8.30.0 8.20.0 8.50.1 5.70.0
Total
triunsaturated 8.9±0.2 15.90.1 16.10.1 15.70.3 15.50.1 15.20.1 16.00.2 10.10.1
PLL 3.3±0.1 3.40.1 3.30.1 3.20.0 3.30.1 3.20.2 3.50.0 2.00.0
PLO 15.0±0.0 15.80.2 15.80.1 15.60.4 15.20.1 14.80.1 15.70.1 9.10.0
POO 31.9±0.2 27.00.1 27.00.4 26.60.6 25.80.1 25.20.1 26.30.1 17.50.0
SOO 3.5±0.1 2.90.1 3.00.0 2.90.0 2.80.0 2.80.1 2.80.0 1.70.0
Total
diunsaturated 53.7±0.2 48.90.3 49.10.4 48.30.9 47.00.1 46.00.4 48.20.3 30.30.0
MLP 0.4±0.1 0.60.1 0.60.1 0.60.1 0.80.1 0.80.1 0.80.1 0.50.0
PLP 9.5±0.0 7.30.3 7.30.2 7.40.2 7.70.0 7.70.1 7.60.1 7.80.0
POP 17.4±0.0 15.70.1 15.00.4 15.50.4 16.60.1 17.10.0 15.40.3 26.00.1
POS 3.2±0.1 2.90.1 2.80.0 3.00.1 3.20.0 3.30.1 2.90.1 5.20.0
SOS 0.4±0.0 0.40.0 0.30.0 0.40.0 0.50.1 0.50.1 0.40.1 0.70.0
Total
disaturated 30.9±0.0 26.80.4 25.90.2 26.90.9 28.70.1 29.40.1 27.10.4 40.30.1
PPP 0.1±0.0 0.10.0 0.20.2 0.20.1 0.20.1 0.40.1 0.00.0 6.00.1
PPS 0.0±0.0 0.00.0 0.00.0 0.00.0 0.00.0 010.0 0.00.0 1.50.1
Total
trisaturated 0.1±0.0 0.10.0 0.20.2 0.20.1 0.20.1 0.40.1 0.00.0 7.50.2
94
For diunsaturated TAGs, PLL and PLO content of the olein fractions were similar to that in
the feed olein. The content of POO was consequently reduced with increasing fractionation
temperature, POO content was slightly reduced from 31.9% to 27.0% in both olein 8 °C
and olein 10 °C. Whereas for disaturated TAGs, PLP and POP content were reduced, while
the other disaturated TAGs such as MLP, POS and SOS remained unchanged.
The fatty acids composition and IV of the olein fractions and the feed oil were shown in
Table 3.4. The unsaturation content of the olein fractions had been improved as compared
to the starting material (palm olein of IV 62). As fractionation temperature reduced, greater
amount of high melting TAGs were removed, which resulted in reduction of the SFA
content and increment of the monounsaturated fatty acids (MUFA) and polyunsaturated
fatty acids (PUFA).
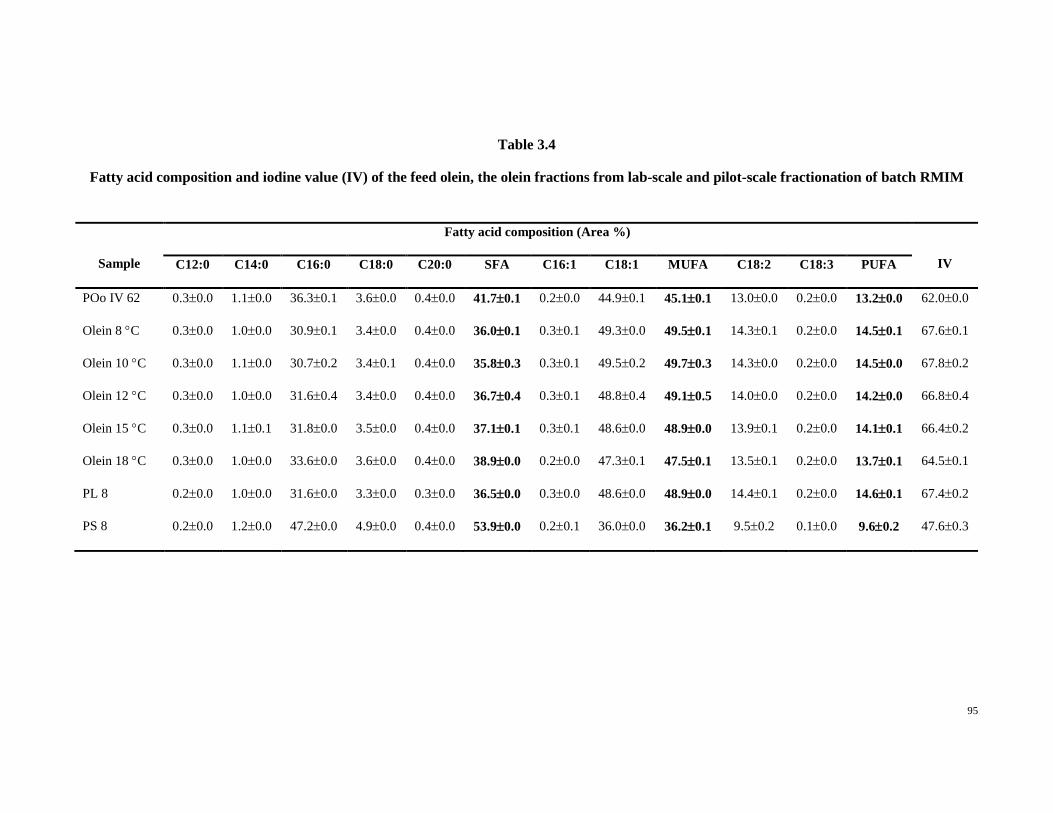
95
Table 3.4
Fatty acid composition and iodine value (IV) of the feed olein, the olein fractions from lab-scale and pilot-scale fractionation of batch RMIM
Sample
Fatty acid composition (Area %)
IV C12:0 C14:0 C16:0 C18:0 C20:0 SFA C16:1 C18:1 MUFA C18:2 C18:3 PUFA
POo IV 62 0.30.0 1.10.0 36.30.1 3.60.0 0.40.0 41.70.1 0.20.0 44.90.1 45.10.1 13.00.0 0.20.0 13.20.0 62.00.0
Olein 8 C 0.30.0 1.00.0 30.90.1 3.40.0 0.40.0 36.00.1 0.30.1 49.30.0 49.50.1 14.30.1 0.20.0 14.50.1 67.60.1
Olein 10 C 0.30.0 1.10.0 30.70.2 3.40.1 0.40.0 35.80.3 0.30.1 49.50.2 49.70.3 14.30.0 0.20.0 14.50.0 67.80.2
Olein 12 C 0.30.0 1.00.0 31.60.4 3.40.0 0.40.0 36.70.4 0.30.1 48.80.4 49.10.5 14.00.0 0.20.0 14.20.0 66.80.4
Olein 15 C 0.30.0 1.10.1 31.80.0 3.50.0 0.40.0 37.10.1 0.30.1 48.60.0 48.90.0 13.90.1 0.20.0 14.10.1 66.40.2
Olein 18 C 0.30.0 1.00.0 33.60.0 3.60.0 0.40.0 38.90.0 0.20.0 47.30.1 47.50.1 13.50.1 0.20.0 13.70.1 64.50.1
PL 8 0.20.0 1.00.0 31.60.0 3.30.0 0.30.0 36.50.0 0.30.0 48.60.0 48.90.0 14.40.1 0.20.0 14.60.1 67.40.2
PS 8 0.20.0 1.20.0 47.20.0 4.90.0 0.40.0 53.90.0 0.20.1 36.00.0 36.20.1 9.50.2 0.10.0 9.60.2 47.60.3

96
However, the modification processes did not significantly reduce the SFA content in the
feed oil. SFA only reduced about 6% with increasing of IV from 62.0 to about 68 at
fractionation temperature of 8 and 10 °C. This was basically due to the formation of too low
amount of trisaturated TAGs in the batch RMIM reaction that resulted in difficulty in the
formation of hard crystals during crystallization.
Overall, the TAG composition and fatty acid composition of the pilot-scale olein was
comparable to the lab-scale olein fractionated at the same temperature. Pilot-scale
fractionation conducted at 8 °C has further increased the olein yield to 74.8% as compared
to the lab-scale olein yield, which was 71.2% (Table 3.3). This is due to the application of
high pressure in the membrane filter press which effectively squeezed out some entrapped
olein from the stearin cake. However, some fine crystals may also squeezed out under high
pressure during pressing of the stearin cake. Therefore, SFA was slightly increased in the
pilot-scale fractionation as compared to the lab-scale (Table 3.4).
The SFC of the olein fractions from lab-scale and pilot-scale fractionation of batch RMIM
interesterified product were compared to the feed palm olein as illustrated in Figure 3.8. In
fact, SFC was always depended on the TAGs distribution in the oil. It was basically reliant
on the intersolubility of the TAGs in the TAG mixture, depending on their chemical
structures or their polymorphism form. Some TAGs will be very soluble when mixed; some
will crystallize separately and being immisible in the solid state that giving rise to form an
eutectic interactions (Gibon, 2006).

97
Figure 3.8
Comparison of the SFC of feed palm olein, the interesterified products of batch RMIM and
the lab-scale olein fractions fractionated at 8, 10, 12, 15, and 18 °C
The olein products contained lower solid fat than the feed olein at temperature of 0 °C. At
temperature above 2 °C, olein fractionated at 18 °C contained significantly higher amount
of SFC than the feed olein. Although olein 18 °C contained higher triunsaturated TAGs
with higher IV as compared to the feed olein, the diunsaturated content was significantly
lower, and thus resulted in greater SFC at temperature above 2 °C (Table 3.3). When
fractionation temperature was reduced, the TAG distributions in olein fractions gradually
moved towards lower trisaturated and disaturated TAGs, with higher triunsaturated and
diunsaturated TAGs. This had caused a significant reduction in SFC when lower
temperature was applied.

98
Similar trends were observed in the crystallization and melting properties of the olein
fractions (Figure 3.9). The oleins fractionated at lower temperature generally started to
crystallize at lower temperature, and melt at lower temperature. For olein 15 °C and 18 °C,
the crystallization peaks and melting peaks were broader due to the TAG composition with
wider range of melting points.
Sharper peaks in low temperature fractionated olein were due to TAG components with
narrower crystallization and melting temperatures. The figure also shows visible removal of
high melting components during the dry fractionation, whereby the high temperature peaks
in both crystallization and melting thermograms of batch RMIM product had disappeared in
all the olein fractions.

99
Figure 3.9 Comparison of (A) crystallization, and (B) melting properties of feed palm olein, and the lab-
scale olein fractions from fractionation of batch RMIM at 8, 10, 12, 15, and 18 °C

100
3.2.2 Fractionation of Batch TLIM
Table 3.5 shows the yield and acylglycerols composition of lab-scale olein fractions, and
pilot-scale fractionation products (PL9 and PS9). Olein yields from fractionation of batch
TLIM were adequately lower as compared to batch RMIM. Lowering the fractionation
temperature resulted in reduction of the olein yield due to the formation of greater amount
of crystals under cooler crystallization conditions.
Table 3.5 showed that the oleins derived from dry fractionation of batch TLIM product
contained significantly higher amount of total diacylglycerols compared to the feed olein.
This was due to the formation of high quantity of partial glycerides during the batch
interesterification reaction as shown in Table 3.1. The presence of DAG further complicates
the crystallization and melting behavior, as DAG can significantly affect the physical
properties of the oil, such as melting properties, polymorphism behavior, rate of
crystallization, crystals size and habits (Siew, 2001).
When lower fractionation temperature was applied, the content of triunsaturated and
diunsaturated TAGs gradually increased, with reduction in the disaturated TAGs content.
At higher fractionation temperature, majority of trisaturated TAGs were removed together
with minor amount of disaturated TAGs. For example, at fractionation temperature of 21 °C,
3.7% of trisaturated TAGs were removed with only 1% reduction in disaturated TAGs.
Reducing the fractionation temperature has further removed the disaturated TAGs from
25.1% to 21.1% at 9 °C. The removal of disaturated and trisaturated TAGs had resulted in
the increment of triunsaturated and diunsaturated TAGs significantly in the oil.

101
Table 3.5
Yield and acylglycerols composition of the olein fractions from lab-scale and pilot-scale
fractionation of batch TLIM [PL9=pilot-scale olein at 9°C; PS9=pilot-scale stearin at 9°C]
Yield/
Acylglycerols POoIV62 Oln9C Oln12C Oln15C Oln18C Oln21C PL 9 PS 9
Yield (%) - 57.40.3 62.61.0 64.40.6 64.90.4 68.40.5 61.0±0.2 39.0±0.2
Total DAG 6.2±0.0 11.20.1 11.70.1 11.20.1 11.50.0 11.50.1 11.40.1 12.60.1
OLL 0.6±0.0 2.20.0 2.20.1 2.20.1 2.10.0 2.10.0 2.20.0 1.40.0
OLO 2.6±0.0 8.10.1 7.90.0 7.70.0 7.60.0 7.50.0 8.00.0 5.10.0
OOO 5.7±0.1 10.00.1 9.80.1 9.70.1 9.50.1 9.30.0 9.90.0 6.90.0
Total
triunsaturated 8.9±0.2 20.20.1 19.80.0 19.50.1 19.20.1 18.90.0 20.10.0 13.40.0
PLL 3.3±0.1 3.30.1 3.20.1 3.20.1 3.20.1 3.10.0 3.30.0 2.00.0
PLO 15.0±0.0 14.60.1 14.40.1 14.10.1 13.70.0 13.60.1 14.60.0 9.20.0
POO 31.9±0.2 23.50.1 23.40.2 22.80.0 22.30.1 22.00.1 23.50.0 15.50.0
SOO 3.5±0.1 2.60.1 2.50.0 2.50.0 2.50.0 2.40.0 2.50.0 1.50.0
Total
diunsaturated 53.7±0.2 43.80.1 43.40.2 42.50.1 41.60.1 41.10.2 43.90.1 28.30.0
MLP 0.4±0.1 0.70.0 0.60.1 0.70.0 0.70.0 0.70.0 0.70.0 0.50.0
PLP 9.5±0.0 5.10.0 5.10.1 5.40.1 5.50.1 5.50.0 5.20.0 5.70.0
POP 17.4±0.0 12.60.1 13.10.1 13.80.1 14.30.1 14.60.0 12.70.0 19.50.0
POS 3.2±0.1 2.30.0 2.50.1 2.60.0 2.80.1 2.80.0 2.40.0 4.10.0
SOS 0.4±0.0 0.40.0 0.40.1 0.50.1 0.50.0 0.50.0 0.40.0 0.70.1
Total
disaturated 30.9±0.0 21.10.1 21.50.3 22.90.1 23.70.1 24.10.0 21.20.0 30.50.1
PPP 0.1±0.0 0.30.0 0.30.1 0.40.0 0.50.0 0.70.0 0.2 0.1 9.10.1
PPS 0.0±0.0 0.00.0 0.00.0 0.00.0 0.10.0 0.10.0 0.00.0 2.70.1
Total
trisaturated 0.1±0.0 0.30.0 0.30.1 0.40.0 0.60.0 0.80.0 0.20.0 11.80.1

102
Overall, the modification process via batch TLIM had significantly increased the
triunsaturated TAGs and reduced the diunsaturated and disaturated TAGs, with no
significant changes in trisaturated TAGs composition in the new oleins. The highest
amount of triunsaturated TAGs was achieved in olein fractionated at 9 °C with over one
fold increment as compared to the feed olein. The high increment of triunsaturated TAGs
was mainly contributed by OLO and OOO which involved 5.5% and 4.3% increment,
respectively. OLO increased in the highest rate with increment of more than two fold
compared to the feed olein. The diunsaturated and disaturated TAGs of the olein reduced to
43.8 and 21.1%, respectively.
Table 3.6 shows the fatty acids composition and IV of the olein fractions and the feed oil.
As fractionation temperature was reduced, MUFA and PUFA increased with decreased of
SFA. The trend of fatty acid composition was particularly related to the performance of dry
fractionation in the effectiveness of separating different melting points TAGs. For
fractionation at 21 °C, SFA reduced from 41.7% to 35.8%. The SFA content gradually
decreased to 33.1% as fractionation temperature was reduced to 9 °C. The trend of
reduction in SFA was believed to be predominantly contributed by the removal of
disaturated TAGs (Table 3.5). As compared to the feed olein, it was found that the
modification processes had generally improved the unsaturation content of palm olein,
whereby MUFA and PUFA increased 6.6% and 2.0%, respectively. IV was improved from
62.0 to 70.7 after batch TLIM interesterification and fractionation at 9 °C.

103
Table 3.6
Fatty acid composition and iodine value (IV) of the olein fractions from lab-scale fractionation of batch TLIM
Sample
Fatty acid composition (Area %)
IV C12:0 C14:0 C16:0 C18:0 C20:0 SFA C16:1 C18:1 MUFA C18:2 C18:3 PUFA
POo IV 62 0.30.0 1.10.0 36.30.1 3.60.0 0.40.0 41.70.1 0.20.0 44.90.1 45.10.1 13.00.0 0.20.0 13.20.0 62.00.0
Olein 9 C 0.20.0 1.00.0 28.70.1 2.90.0 0.30.0 33.10.1 0.20.0 51.50.1 51.70.1 15.00.1 0.20.0 15.20.1 70.70.2
Olein 12 C 0.20.0 1.00.0 29.20.0 3.00.0 0.30.0 33.70.1 0.20.0 51.00.1 51.20.1 14.80.0 0.20.0 15.00.0 70.00.2
Olein 15 C 0.20.0 1.00.0 29.80.0 3.10.0 0.30.0 34.40.0 0.20.0 50.50.0 50.70.0 14.60.0 0.20.0 14.80.0 69.20.0
Olein 18 C 0.20.0 1.00.0 30.50.1 3.20.0 0.30.0 35.20.1 0.20.0 50.00.1 50.20.1 14.40.0 0.20.0 14.60.0 68.50.1
Olein 21 C 0.20.0 1.00.0 31.10.1 3.20.0 0.30.0 35.80.1 0.20.0 49.60.1 49.80.1 14.10.1 0.20.0 14.30.1 67.60.1
PL 9 0.20.0 0.90.0 28.90.1 0.30.0 0.30.0 33.30.1 0.30.0 51.20.0 51.50.0 15.10.0 0.20.0 15.30.0 70.70.0
PS 9 0.20.0 1.20.0 45.10.0 5.00.1 0.50.0 52.00.1 0.20.1 37.40.1 37.60.2 10.40.1 0.10.0 10.50.1 50.40.1
104
Both TAGs and fatty acid composition results showed no significant difference between the
lab-scale and pilot-scale fractionation oleins. This indicated that lab-scale fractionation can
be used to predict the olein quality to be produced in larger scale fractionation when the
same cooling program was applied. Different filtration tools will only affect the stearin
quality as well as the accuracy of the olein yield (Timms, 2005). This can be proven in the
TAG and fatty acid composition results of the lab-scale stearin fractions that illustrated in
Appendix K and L, respectively. The stearins compositions were not as expected. The olein
yield of pilot-scale fractionation was higher due to lesser olein entrapment in the stearin
fraction.
The SFC of the feed palm olein, the batch TLIM interesterified product, and the lab-scale
oleins were measured as a function of temperature, as shown in Figure 3.10. SFC of the
batch TLIM interesterified product was increased due to the formation of adequately high
amount of trisaturated TAGs. Majority of the trisaturated TAGs was removed after lab-
scale fractionation, thus resulted in reducing the SFC of the olein fractions overall (Table
3.5). When fractionation temperature was reduced, lower SFC was observed in the olein
fractions due to the reduction of total disaturated TAGs as well as the increment of total
diunsaturated TAGs (Table 3.5).
The figure also showed that the olein fractionated at 9, 12, and 15 °C have lower SFC at all
tested temperatures, whilst olein 18 °C and 21 °C contained higher SFC at tested
temperature above 5 °C. This was basically due to the presence of some trisaturated TAGs
in olein 18 °C and 21 °C, ranging from 0.4 to 0.8%. Basically, the presence of high

105
unsaturated fatty acids with bend-structures will disturb the arrangement of TAGs during
crystallization, and reduced the SFC of the oil (Lawler and Dimick, 2002). Therefore,
higher content of total triunsaturated TAGs in all the olein fractions had retarded the
crystallization of the diunsaturated and disaturated TAGs, which resulted in lower SFC at
0 °C.
Figure 3.10
Comparison of the SFC of feed palm olein, the interesterified products of batch TLIM and the
lab-scale olein fractions fractionated at 9, 12, 15, 18, and 21 °C
Similar to the DSC diagrams of oleins from batch RMIM interesterification, majority of the
high melting components were removed in the lab-scale fractionation. The exothermic
peaks in crystallization thermogram of the oleins (Figure 3.11, A) were shifted to higher
temperature and became broader when higher fractionation temperature was applied. This

106
was basically due to the incomplete removal of trisaturated TAGs for high temperature
fractionation, such as olein 18 °C and 21 °C.
Figure 3.11
Comparison of (A) crystallization, and (B) melting properties of feed palm olein, and the lab-
scale olein fractions from fractionation of batch TLIM at 9, 12, 15, 18, and 21°C

107
The further removal of trisaturated and disaturated TAGs (mainly POP) at 12 °C had
contributed to the appearance of sharper peak (olein 12 °C) as compared to olein 18 °C and
21 °C. Similar findings were observed in Figure 3.11 (B), whereby the olein 9 °C were fully
melted at 12 °C and the melting temperature was gradually increased to about 20 °C for
olein 21 °C.
3.2.3 Fractionation of Packed-bed TL IM
Table 3.7 shows the TAG profiles of the lab-scale oleins, the pilot-scale olein and stearin
fractions. In lab-scale fractionation of packed-bed TLIM product, the yield of olein
fractions were lower as fractionation temperature was reduced from 21 °C to 9 °C. The
olein yields were decreased gradually from 51.8% to 46.9 % for fractionation temperature
of 21 °C to 12 °C. At 9 °C, the olein yield dropped significantly to 24.8%.
Under the crystallization condition (9 °C), β-crystals (triclinic parallel structure) were
formed, retarded the filtration of the slurry (Lawler and Dimick, 2002), and thus reduced
the olein yield drastically. Although the olein yields were significantly different, the TAG
composition of olein 9 °C was generally similar to olein 12 °C, with only 1.3% higher in
diunsaturated TAGs and 1.6% lower in disaturated TAGs. Therefore 9 °C was too low to
be used for fractionation of the interesterified products.

108
Table 3.7
Yield and acylglycerols composition of the olein fractions from lab-scale fractionation of
packed-bed TLIM
Yield/
Acylglycerols POoIV62 Oln 9C Oln12C Oln15C Oln18C Oln21C PL 12 PS 12
Yield (%) - 24.81.3 46.91.1 48.30.7 49.50.3 51.81.1 67.1±0.0 32.9±0.0
Total DAG 6.2±0.0 8.10.3 8.10.1 8.10.1 7.80.0 7.80.0 8.0±0.0 8.5±0.1
OLL 0.6±0.0 2.70.0 2.80.0 2.70.1 2.70.1 2.60.0 2.6±0.1 1.1±0.0
OLO 2.6±0.0 8.70.0 8.60.3 8.10.0 8.30.0 8.20.0 8.2±0.1 4.0±0.0
OOO 5.7±0.1 10.30.0 9.90.0 9.60.1 9.30.1 9.30.0 9.4±0.1 5.5±0.0
Total
triunsaturated 8.9±0.2 21.70.0 21.30.3 20.40.2 20.30.0 20.10.0 20.1±0.3 10.6±0.1
PLL 3.3±0.1 3.20.0 3.30.1 3.10.0 3.10.3 3.10.0 3.4±0.1 1.5±0.0
PLO 15.0±0.0 16.30.0 15.70.1 15.40.2 14.80.0 14.60.0 15.5±0.1 7.4±0.1
POO 31.9±0.2 26.10.0 25.40.1 25.00.1 24.10.1 24.20.0 24.9±0.0 12.3±0.1
SOO 3.5±0.1 2.70.0 2.60.0 2.60.0 2.60.1 2.50.0 2.7±0.1 1.1±0.1
Total
diunsaturated 53.7±0.2 48.30.0 47.00.2 46.10.2 44.60.2 44.40.1 46.4±0.1 22.2±0.3
MLP 0.4±0.1 0.60.0 0.70.1 0.70.0 0.80.0 0.70.0 1.0±0.1 0.7±0.1
PLP 9.5±0.0 5.50.1 5.60.2 5.90.2 6.20.2 6.10.0 6.3±0.1 7.2±0.0
POP 17.4±0.0 12.70.3 13.70.0 15.40.2 16.00.0 16.60.1 14.5±0.2 25.2±0.3
POS 3.2±0.1 2.30.0 2.60.0 2.80.2 3.00.0 3.20.0 2.7±0.1 5.0±0.0
SOS 0.4±0.0 0.30.0 0.40.0 0.40.1 0.40.0 0.10.1 0.4±0.1 0.7±0.1
Total
disaturated 30.9±0.0 21.40.4 23.00.2 25.20.3 26.40.1 26.70.0 24.7±0.2 38.7±0.4
PPP 0.1±0.0 0.10.0 0.00.0 0.10.0 0.30.1 0.20.0 0.1±0.0 15.1±0.1
PPS 0.0±0.0 0.00.0 0.10.1 0.10.1 0.00.0 0.00.0 0.0±0.0 4.4±0.1
Total
trisaturated 0.1±0.0 0.10.0 0.10.1 0.20.0 0.30.1 0.20.0 0.1±0.0 19.5±0.2
Originally, the feed olein contained higher amounts of total diunsaturated TAGs (PLP, POP,
POS, and SOS) and total diunsaturated (PLL, PLO, POO, and SOO) as compared to the
olein fractions. After the interesterification, the fatty acids had been rearranged, resulted in
increased of the total diunsaturated and disaturated TAGs. Therefore, the olein products

109
contained significantly lower amounts of these TAGs compared to the starting material.
Additionally, total triunsaturated TAGs content of all the olein fractions were much higher
than that of the feed olein, which comprises with only 8.9% of total triunsaturated TAGs.
Total triunsaturated TAGs increased from 20.1% to 21.7% for fractionation temperature of
21 °C to 9 °C.
The improvement in unsaturation content in olein fractions was further confirmed by the
fatty acid composition results. From the fatty acid composition results shown Table 3.8, the
unsaturation content of the olein fractions had improved as compared to the starting
material. Fractionation reduced the SFA content; while increased the MUFA and PUFA as
fractionation temperature was reduced. Olein 9 °C contained the lowest amount of SFA
which was only 32.9%, as compared to 33.2% in olein 12 °C. However, the yield of olein
9 °C was apparently much lower (22.1%) than olein 12 °C, and this again proved that 12 °C
was the more suitable temperature required for the removal of the saturation content.
Another indicator usually used in describing the degree of unsaturation is IV. In food
industry, IV is used to evaluate the liquidity of the oil. The higher the IV, the greater is the
oil unsaturation. The olein obtained from the fractionation process had greater IV compared
to the feed palm olein IV of 62. The IV of olein 21 °C was 68.8 which had improved by 6.8
from the original feed olein. The IV of the oleins were gradually increased to 69.6 (olein
18 °C), 69.8 (olein 15 °C), 71.1 (olein 12 °C), and 72.0 (olein 9 °C).

110
Table 3.8
Fatty acid composition and iodine value (IV) of the olein fractions from lab-scale fractionation of packed-bed TLIM
Sample
Fatty acid composition (Area %)
IV C12:0 C14:0 C16:0 C18:0 C20:0 SFA C16:1 C18:1 MUFA C18:2 C18:3 PUFA
POo IV 62 0.30.0 1.10.0 36.30.1 3.60.0 0.40.0 41.70.1 0.20.0 44.90.1 45.10.1 13.00.0 0.20.0 13.20.0 62.00.0
Olein 9 C 0.20.0 1.00.0 27.90.1 2.90.0 0.30.0 32.30.1 0.20.0 51.70.1 51.90.1 15.50.1 0.30.0 15.80.1 72.00.2
Olein 12 C 0.20.0 1.00.0 28.70.1 3.00.0 0.30.0 33.20.1 0.20.0 51.00.1 51.20.1 15.30.0 0.30.0 15.60.0 71.10.1
Olein 15 C 0.20.0 1.00.0 29.70.1 3.10.0 0.30.3 34.30.1 0.20.0 50.30.2 50.80.2 14.90.1 0.30.0 15.20.1 69.80.1
Olein 18 C 0.20.0 1.00.0 30.10.1 3.10.0 0.30.0 34.70.1 0.20.0 50.00.1 50.20.1 14.90.1 0.30.0 15.20.1 69.60.2
Olein 21 C 0.20.0 1.00.0 30.50.0 3.20.0 0.40.1 35.30.1 0.20.0 49.60.1 49.80.1 14.70.1 0.30.0 15.00.1 68.80.2
PL 12 0.2±0.0 1.0±0.0 29.4±0.3 3.0±0.0 0.3±0.0 33.9±0.2 0.3±0.0 50.2±0.2 50.4±0.2 15.2±0.1 0.5±0.0 15.7±0.1 70.7±0.3
PS 12 0.3±0.0 1.3±0.0 52.6±0.1 5.6±0.0 0.5±0.0 60.3±0.1 0.1±0.0 30.9±0.1 31.0±0.1 8.4±0.0 0.3±0.0 8.7±0.0 41.9±0.2

111
In pilot-scale fractionation conducted at 12 °C, olein yield had increased 20.2% to 67.1%
compared to the lab-scale fractionation (Table 3.7). This trial again indicated that
membrane filter press was much more effective in reducing the olein entrapment, as
compared to the regular vacuum filter. However, the application of high pressure during the
filtration has squeezed out trace amount of very fine crystals, which increased the IV of the
pilot-scale olein by 0.4, compared to the lab-scale olein.
The SFC of the feed olein, and the packed-bed TLIM interesterified palm olein, and the
lab-scale oleins were shown in Figure 3.12.
Figure 3.12
Comparison of the SFC of feed palm olein, the interesterified products of packed-bed TLIM
and the lab-scale olein fractions fractionated at 9, 12, 15, 18, and 21 °C
112
The results showed that the interesterified product and the olein fractions were similar in
SFC trend which were totally different from the feed olein. The SFC of the olein fractions
was much lower than the interesterified product as saturated components had been removed
during fractionation process.
Olein fractionated at the highest temperature (21 °C) achieved the highest percentage of
SFC at each tested temperature from 0 °C to 25 °C, followed by olein 18 °C, olein 15 °C,
olein 12 °C, and olein 9 °C. This was because the olein fractionated at higher temperature
contained higher amounts of saturated fat (Table 3.7). During fractionation, the oil will be
cooled down and begins to crystallize. When crystallization begin, saturated TAGs will
slowly concentrate in the solid phase (stearin), leaving behind a more unsaturated TAGs in
the liquid phase (olein) (Kellens et al., 2007). At lower fractionation temperature, more
saturated TAGs will concentrate in the solid phase, thus producing olein fractions with
higher unsaturation content.
Besides, it was found that only the SFC of olein 12 °C and olein 9 °C were generally lower
than the original palm olein IV 62. At temperature below 10 °C, the SFC of these olein
fractions was lower than the feed olein, meaning that these olein fractions were more
resistant against crystallization at temperature below 10 °C. As for olein at 15 °C, its SFC at
0 °C was lower than the feed olein. At temperature above 2.5 °C, olein 15 °C achieved
higher SFC as compared to the feed oil.

113
Figure 3.13
Comparison of (A) crystallization, and (B) melting properties of the interesterified palm olein,
and the lab-scale olein fractions from fractionation of packed-bed TLIM at 9, 12, 15, 18, and
21°C

114
Figure 3.13 showed the thermal properties of the packed-bed interesterified palm olein, and
its lab-scale olein fractions. Generally, the fractionation at 18 °C and 21 °C had completely
removed the trisaturated TAGs, and resulted in the disappearance of the high melting peaks
in both the crystallization and melting thermograms (Figure 3.13). Further reduction in the
fractionation temperature had resulted in the removal of more disaturated TAGs that leads
to the presence of sharper crystallization peak in the thermogram of olein fractionated at
lower temperatures (Table 3.7). The DSC melting diagram in Figure 3.13 (B) showed that
both olein 9 °C and olein 12 °C had comparable thermal properties, as both oleins were
fully melted at about 16 °C.
Similar to other lab-scale stearin fractions, the stearin TAGs and fatty acid compositions of
packed-bed TLIM were not as expected due to the inaccuracy in the filtration steps, data
were illustrated in Appendix M and Appendix N.
3.3 Evaluation of the Products Quality
There are a few new products obtained from the modification processes, which can be
divided into three categories; the low saturation liquid palm products, the subsequent solid
products, and the intermediate palm olein from the enzymatic interesterifications. Other
than the low saturation liquid palm products, the final solid fractions and the intermediate
products from enzymatic interesterification are also valuable and have potential to be used
as hard-based palm products with higher IV.

115
3.3.1 New Palm Liquid Products versus Other Palm Liquid Products
Figure 3.14 showed the comparison of SFC of the final olein obtained from batch RMIM,
batch TLIM and packed-bed TLIM, with the feed olein, the commercial superolein from
Seri Murni Sdn. Bhd., and the oleins obtained from fractionation of the feed palm olein.
The SFC of the commercial superolein from Seri Murni Sdn. Bhd. was very much higher
than the feed olein, indicating that the superolein from the market was lower in
unsaturation level. Due to the removal of some saturated fats, all of the oleins derived from
palm olein of IV 62, either from dry fractionation or the combination of enzymatic
interesterification and dry fractionation contained adequately lower SFC than the feed palm
olein of IV 62.
Figure 3.14
SFC of the final olein products in comparison with the feed palm olein (POo IV62), lab-scale
(L-FN) and pilot-scale fractionation (P-FN) of the feed olein, and the superolein (Seri Murni)

116
In comparison, the oleins from dry fractionation generally contained lower SFC than the
oleins from enzymatic interesterification and dry fractionation. However, controlling of the
crystallization during fractionation was very difficult due to absent of high melting TAGs
such as trisaturated TAGs (Calliauw et al., 2007a). Due to this matter, crystallization of
palm olein IV 62 had to be conducted at very low temperature. In lab-scale fractionation,
palm olein IV 62 stay clear at 8 °C for more than an hour. Crystallization can only occur
constantly at temperature below 5 °C; whereas in pilot-scale fractionation, crystallization of
palm olein IV 62 had to be carried out at temperature as low as 2 °C.
The difficulty in controlling crystallization had resulted in the production of oleins with
different yield and quality. Figure 3.14 indicated that the SFC of the oleins from pilot-scale
fractionation of palm olein (P-FN IV62 Olein-1 and -2) was significantly different although
they were produced under same fractionation conditions. In addition, the oleins from lab-
scale fractionation (L-FN IV62 Olein-1 and -2) also showed significantly different SFC.
Similar results were found in Figure 3.15, in which the crystallization and melting
properties of P-FN IV62 Olein-1 and P-FN IV62 Olein -2 were very different.
This was basically because of the instability of the crystals in palm olein slurry which could
easily damaged during filtration step. The less stable crystal forms were mainly associated
with high intersolubility of the crystals in the liquid phase. Such miscibility or
intersolubility of TAGs in solid form often presents problems in fractionation of palm olein
(Calliauw et al., 2007b).

117
Figure 3.15 Comparison of (A) crystallization, and (B) melting properties of the three pilot-scale olein
products from batch RMIM, batch TLIM, and packed-bed TLIM with feed palm olein (POo
IV62), pilot-scale fractionation (P-FN) of the feed olein, and the commercial superolein

118
This problem was solved with interesterification of the palm olein. The interesterification
reactions formed some trisaturated TAGs that could facilitate the crystals formation, and
improved the crystallization process (Lawler and Dimick, 2002). Controlling of
crystallization in the interesterified palm olein was much easier compared to that in the
original feed olein. Trisaturated TAGs in the interesterified palm olein can act as seeds or
nucleus for crystallization (Kellens et al., 2007).
Figure 3.16 showed the saturation level and the IV of some palm oil products including
RBDPO, the feed olein (POo IV 62), olein obtained from pilot-scale fractionation of the
feed olein (Oln FN 62), and the three major products obtained from batch RMIM, batch
TLIM and packed-bed TLIM. Basically, the saturation content in palm oil products was
calculated from C12:0, C14:0, C16:0, C18:0, and C20:0. Dry fractionation of RBDPO can
easily reduce the saturation level to produce palm olein with IV of 56 and 62 (Kellens et al.,
2007).

119
Figure 3.16
Comparison of the saturation level and IV of some palm oil products
From the study, dry fractionation of palm olein IV 62 reduced the saturation level from
41.7% to 35.0% with increasing of IV to 67.6, whereas enzymatic interesterification and
dry fractionation produced the oleins with saturation content ranging from 36.5% to 33.3%,
with IV of 67.4 to 70.7. Although the olein from batch RMIM had the lowest SFC,
crystallization and melting temperatures, as shown in Figure 3.14 and Figure 3.15, the
saturation level was higher than that in batch TLIM and packed-bed TLIM.
Here, it can be concluded that the oleins derived from batch and packed-bed TLIM
contained the lowest SFA, which was 33.3% and 33.9%, respectively. Both processes are
applicable for production of low saturation palm oil products in terms of the oil quality as
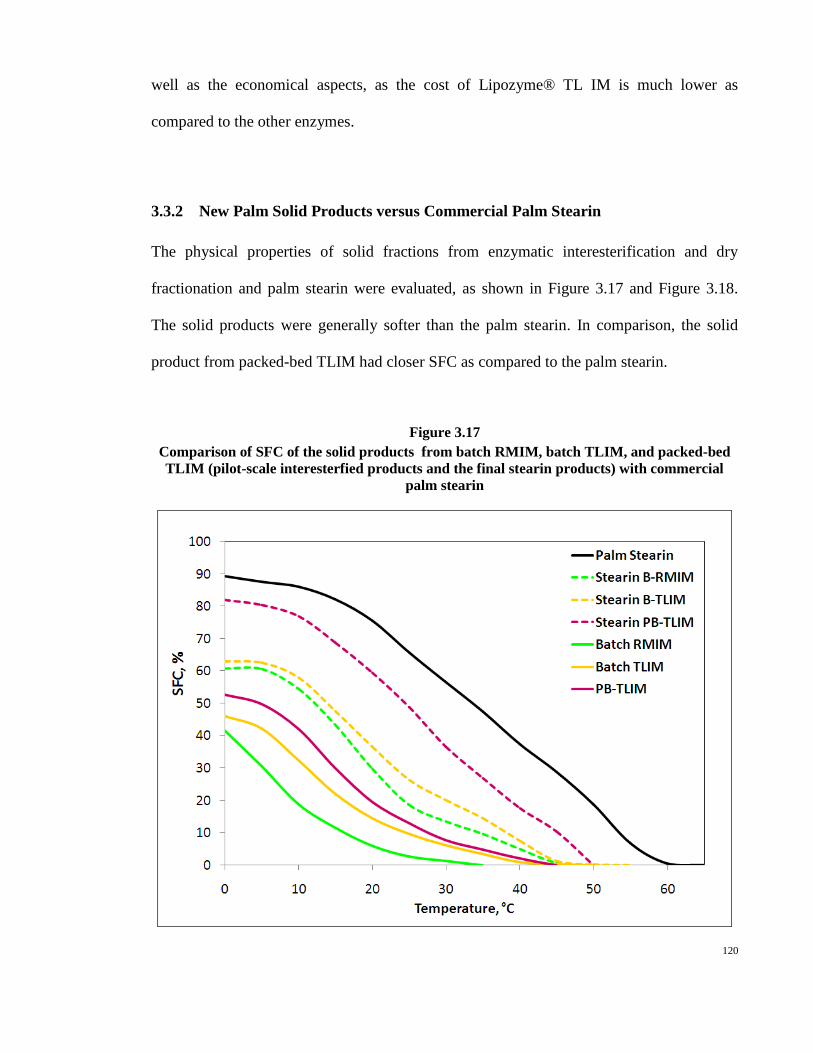
120
well as the economical aspects, as the cost of Lipozyme® TL IM is much lower as
compared to the other enzymes.
3.3.2 New Palm Solid Products versus Commercial Palm Stearin
The physical properties of solid fractions from enzymatic interesterification and dry
fractionation and palm stearin were evaluated, as shown in Figure 3.17 and Figure 3.18.
The solid products were generally softer than the palm stearin. In comparison, the solid
product from packed-bed TLIM had closer SFC as compared to the palm stearin.
Figure 3.17
Comparison of SFC of the solid products from batch RMIM, batch TLIM, and packed-bed
TLIM (pilot-scale interesterfied products and the final stearin products) with commercial
palm stearin

121
Figure 3.18 Comparison of (A) crystallization, and (B) melting properties of the products from batch
RMIM, batch TLIM, and packed-bed TLIM, the relative stearin products and the
commercial palm stearin

122
The solid products from batch TLIM and batch RMIM had much lower SFC and fully melt
at lower temperature (45 °C). Due to the olein entrapment, the solid fractions were riched
in triunsaturated TAGs, which ranging from 10.1% to 13.4%. These three solid products
are of potential to be used as palm hard-based stock, in the formulation of margarine,
vanaspati etc.
Besides, the SFC and thermal properties of the products from enzymatic interesterification
were evaluated and shown in Figure 3.17 and Figure 3.18, respectively. In the enzymatic
interesterification, the physicochemical properties of the palm olein of IV 62 had changed
excluding the fatty acid composition and IV.
The products from enzymatic interesterification were generally harder in its physical
appearance. The batch RMIM product was the softest among the interesterified products,
followed by batch TLIM and packed-bed TLIM. The high SFC was basically due to the
formation of some trisaturated TAGs during the interesterification reactions. These high
melting components act as the backbone structure for crystal networking, thus increased the
SFC.

123
CONCLUSION AND RECOMMENDATION
Enzymatic interesterification with combination of dry fractionation had successfully
reduced the saturation content of palm olein IV 62 from 41.7% to 36.5%, 33.3%, and
33.9%, by using batch RMIM, batch TLIM and packed-bed TLIM, respectively. The IV
was increased from 62.0 to 67.4 for batch RMIM olein product, and 70.7 for batch TLIM
and packed-bed TLIM olein products.
In comparison, the oleins derived from dry fractionation of batch TLIM and packed-bed
TLIM products contained generally lower SFA than the olein obtained from dry
fractionation of the same feed oil (35.0%). The IV of the enzymatic modified oleins was
70.7, which was 3.1 greater than the olein from single-step dry fractionation. Batch RMIM
olein product had similar fatty acid composition, IV, and SFC trend as the olein from dry
fractionation, the IV achieved is 67.4, compared to 67.6 in the olein from dry fractionation.
Although dry fractionation of the feed olein can reduce the saturation level to 35.0%,
crystallization of palm olein was difficult due to the absent of high melting TAGs such as
trisaturated TAGs.
Several aspects can be looked into to further reduce the saturation content of palm products.
For example, developing the cooling program such as prolonging the crystallization time at
higher fractionation temperature to have more stable/rigid crystals; interesterification of
other palm products such as palm oil or palm olein with lower IV, to produce greater
amount of trisaturated TAGs for ease of fractionation.
124
Besides, directed interesterification is also another way of reducing the saturation content.
Directed interesterification allows crystallization during interesterification, in which
crystallization takes place simultaneously with interesterification. The saturated
components that produced during the reaction can be eliminated from taking part in the
reaction continuously. However, the application of this concept is difficult due to the slow
crystallization behavior of palm products. Long time interesterification may also cause
formation of high amount of by products such as partial glycerides.
In conclusion, the combination of enzymatic interesterification and dry fractionation is a
better way of reducing the saturation content in palm olein, as the level of saturation can be
reduced up to 33.3%. This olein has fulfilled the requirement for healthy oil according to
WHO dietary guidelines (WHO, 2003). Some saturation is necessary for better oil stability
especially during cooking at high temperature.

125
REFERENCES
Ando Y., Ota T., Matsuhira Y., and Yazawa K. (1996). Stereospecific analysis of triacyl-
sn-glycerols in docosahexaenoic acid-rich fish oils. J Am Oil Chem Soc. 73. 483-487.
Angers P., Tousignant É., Boudreau A., and Arul J. (1998). Regiospecific analysis of
fractions of bovine milk fat triacylglycerols with the same partition number. Lipids. 33.
1195-1201.
Angers P., and Arul J. (1999). A simple method for regiospecific analysis of
triacylglycerols by gas-chromatography. J Am Oil Chem Soc. 76. 481-484.
Azmil H. H. A. T. and Siew W. L. (2008). Quality assessment of palm products upon
prolonged heat treatment. Journal of Oleo Science. 12. 639-648.
AOCS Official Method Ch 3-91. (Corrected 1996). Determination of fatty acids in the 2-
position in the triglycerides of oils and fats. In Sampling and Analysis of Commercial Fats
and Oils. Champaign: American Oil Chemist‟s Society Press.
Berger K. G. (1981, revised 1986). Food uses of palm oil. PORIM Occasional Paper. 2. 1-
9.
Berger K. G. (2001). Palm oil. In Gunstone F. D. (ed). Structured and Modified Lipids.
New York: Marcel Dekker Inc. (p. 119-153)
Becker C. C., Rosenquist A., and Hølmer G. (1993). Regiospecific analysis of
triacylglycerols using ally magnesium bromide. Lipids. 28. 147-149.
Birker P. J. M. W. L. and Padley F. B. (1987). Physical properties of fats and oils. In
Hamilton R. J. and Bhati A. (ed). Recent Advances in Chemistry and Techonology of Fats
and Oils. New York: Elsevier. (p. 1-11)
Bloomer S., Adlercreutz P. and Mattiasson B. (1990). Triglycerides interesterification by
lipase. 1. Cocoa butter equivalent from a fraction of palm oil. J. Am. Oil. Chem. Soc. 67.
519-524.
Brockerhoff H. (1960). A stereospecific analysis of triglycerides. J Lipid Research. 6. 10-
15.
Brokerhoff H. (1967). Stereospecific analysis of triglycerides: an alternative method. J
Lipid Research. 8. 167-169.
Brockerhoff H. (1971). Stereospecific analysis of triglycerides. Lipids. 6. 942-956.
Chang M. K., Abraham G. and John V. T. (1990). Production of cocoa butter-like fat from
interesterification of vegetable oils. J. Am. Oil. Chem. Soc. 67. 832-834.

126
Cheah S. C, and Augustine O. S. H. (1987). Application of Enzyme Reaction to Oils and
Fats. Proc. of 1987 Int. O.P/P.O Conf.-Technology. Palm Oil Research Institute of
Malaysia. pg113-123.
Chong C. L. (1994). Chemical and physical properties of palm oil and palm kernel oil. In
Abdullah A. (ed). Selected Readings on Palm Oil and Its Uses. Kuala Lumpur: Palm Oil
Research Institute of Malaysia. (p. 60-77)
Claus C. B. Annmette R., and Gunhild H. (1993). Regiospecific analysis of triacylglycerols
using ally magnesium bromide. Lipids. 28. 147-149.
Criado M., Hernández-Martín E., and Otero C. (2007). Optimized interesterification of
virgin olive oil with a fully hydrogenated fat in a batch reactor: Effect of mass transfer
limitations. Eur. J. Lipid. Sci. Technol. 109. 474-485.
David A. (1998). Fat modification as a tool for product development Part 2.
Interesterification and biomodification. In Lipid Technology. May 1998. 53-57.
David K. (2008). Fats and oils in human health. In Casimir C. A. and David B. M. (ed).
Food Lipids Chemistry, Nutrition and Biotechnology (Third Edition). New York: CRC
Press. (p.499-511)
Deffense E. (1985). Fractionation of palm oil. J. Am. Oil. Chem. Soc. 62. 376–385.
Desnuelle P. and Savary P. (1963). Specificity of lipases. J Lipid Research. 4. 369-384.
Dourtoglou T., Stefanon E., Lalas S., Dourtoglou V., and Poulos C. (2001). Quick
regiospecific analysis of fatty acids in triacylglycerols with GC using 1,3-specific lipase in
butanol. Analyst. 126. 1032-1036.
Faur L. (1996). Transformation of fat for use in food products. In Karleskind A. (ed). Oils
and Fats Manual: A Comprehensive Treatise (Volume 2). Paris: Lavoisier Publishing. (p.
897-1024)
Ghazali H. M., Hamidah S., Che Man Y. B. (1995). Enzymatic transesterification of palm
olein with nonspecific and 1,3-specific lipases. J Am Oil Chem Soc. 72. 633-639.
Foubert I., Dewettinck K., Van de Walle D., Dijkstra J. and Quinn P. J. (2007). Physical
properties: Structural and physical characteristics. In Gunstone F. D., Harwood J. L., and
Dijkstra A. J. (eds). The Lipid Handbook (Third Edition). New York: CRC Press. (p.471-
534)
Gee P. T. (2007). Analytical characteristics of crude and refined palm oil and fractions. Eur
J Lipid Sci Technol. 109. 373–379.
Ghazali H. M., Hamidah S., and Che Man Y. B. (1995). Enzymatic transesterification of
palm olein with nonspecific and 1,3-specific lipases. J Am Oil Chem Soc. 72.633-639.
127
Gibon V. (2006). Fractionation of lipids for use in food. In Gunstone F. D. (ed). Modifying
Lipids for Use in Food. Boca Raton: CRC Press. (p.201-233)
Gunstone F. D. (2001a). Why are structured lipids and new lipid sources required? In
Gunstone F. D. (ed). Structured and Modified Lipids. New York: Marcel Dekker. (p. 1-9)
Gunstone F. D. (2001b). Procedures used for lipid modification. In Gunstone F. D. (ed).
Structured and Modified Lipids. New York: Marcel Dekker. (p. 11-35)
Jamshid F., Mohammad S., and Manouchehr H. (2006). Application of palm olein in the
production of zero-trans vanaspati through enzymatic interesterification. Eur. J. Lipid. Sci.
Technol. 108. 636-643.
Jamshid F., Manouchehr H., Mohammad S., and Ashkan M. (2007). Trans-free Iranian
vanaspati through enzymatic and chemical transesterification of triple blends of fully
hydrogenated soybean, rapeseed and sunflower oils. Food Chemistry. 102. 827-833.
Kowalski B., Tarnowska K., Gruczynska E., and Bekas W. (2004). Chemical and
enzymatic interesterification of a beef tallow and rapeseed oil equal-weight blend. Eur. J.
Lipid. Sci. Technol. 106. 655-664.
Kellens M. and Hendrix M. (2000). Fractionation. In Richard D. O., Walter E. F., and Peter
J. W. (ed). Introduction to Fats and Oils Technology (Second Edition). Champaign: AOCS
Press. (p. 194-207)
Kellens M., Gibon V., Hendrix M., and Greyt W. D. (2007). Palm oil fractionation. Eur. J.
Lipid. Sci. Technol. 109. 336-349.
Krauss R. M., Eckel R. H., Howard B., Appel L. J., Daniels S. R., Deckelbaum R. J.,
Erdman J. W., Kris-Ehteron P., Goldberg I. J., Kotchen T. A., Lichtenstein A. H., Mitch W.
E., Mullis R., Robinson K., Wylie-Rosett J., St Jeor S., Suttie J., Tribble D. L., and
Bazzarre T. L. (2000). AHA dietary guidelines: Revision 2000: A statement for healthcare
professionals from the nutrition committee of the American Heart Association. Journal of
the American Heart Association. 31. 2751-2766.
Kris-Etherton P., Daniels S. R., Eckel R. H., Engler M., Howard B. V., Krauss R. M.,
Lichtenstein A. H., Sacks F., St. Jeor S., Stampfer M., Grundy S. M., Appel L. J., Byers T.,
Campos H., Cooney G., Denke M. A., Kennedy E., Marckmann P., Pearson T. A., Riccardi
G., Rudel L. L., Rudrum M., Stein D. T., Tracy R. P., Ursin V., Vogel R. A., Zock P. L.,
Bazzarre T. L., and Clark J. (2001). Summary of the scientific conference on dietary fatty
acids and cardiovascular health: Conference summary from the nutrition committee of the
American Heart Association. Journal of the American Heart Association. 103. 1034-1039.
Kurashige J., Matsuzaki N. and Takahashi H. (1993). Enzymatic modification of
canola/palm oil mixtures: Effects on the fluidity of the mixture. J. Am. Oil. Chem. Soc. 70.
849-852.

128
Lampert D. (2000). Process and products of interesterification. In Richard D. O., Walter E.
F., and Peter J. W. (ed). Introduction to Fats and Oils Technology (Second Edition).
Champaign: AOCS Press. (p. 208-234)
Lawler P. J. and Dimick P. S. (2002). Crystallization and polymorphism of fats. In Casimir
C. A. and David B. M. (ed). Food Lipids Chemistry, Nutrition, and Biotechnology (Second
Edition, Revised and Expanded). New York: Marcel Dekker Inc. (p. 275-299)
Lefevre M. (2009). AHA statement on omega 6 polyunsaturated fatty acids. Available from:
http://www.soyconnection.com/newsletters/soy-connection/health-
nutrition/article.php/AHA+Statement+on+Omega+6+Polyunsaturated+Fatty+Acids?id=21
2. Accessed Aug 25, 2009.
Lichtenstein A. H., Appel L. J., Brands M., Carnethon M., Daniels S., Franch H. A.,
Franklin B., Kris-Etherton P., Harris W. S., Howard B., Karanja N., Lefevre M., Rudel L.,
Sacks F., Van Horn L., Winston M., and Wylie-Rosett J. (2006). Diet and lifestyle
recommendations revision 2006: A scientific statement from the American Heart
Association Nutrition Committee. Journal of American Heart Association. 114. 82-96.
Liu K. J., Cheng H. M., Chang R. C., and Shaw J. F. (1997). Synthesis of cocoa butter
equivalent by lipase-catalyzed interesterification in supercritical carbon dioxide. J. Am. Oil.
Chem. Soc. 74. 1477-1482.
Luddy F. E., Barford R. A., Herb S. F., Magidman P., and Riemenschneider R. W. (1964).
Pancreatic lipase hydrolysis of triglycerides by semimicro technique. J Am Oil Chem Soc.
41. 693-696.
Mattson F. H. and Vopenhein R. A. (1961). The use of pancreatic lipase for determining
the distribution of fatty acids in partial and complete glycerides. J Lipid Research. 2. 58-62.
McMurry J. (2004). Carbonyl condensation reactions. In McMurry J. (ed). Organic
Chemistry (Sixth Edition). Belmont: Thomson Learning Inc. (p. 854-891)
Mohd Suria Affandi Y. (1996). Refining and downstreaming processing of palm and palm
kernel oils. In Abdullah A. (ed). Selected Readings on Palm Oil and Its Uses. Kuala
Lumpur: Palm Oil Research Institute of Malaysia. (p. 35-49)
MPOB Test Methods P3.2. (2005). Determination of iodine value. In MPOB Test Methods.
Kuala Lumpur: Malaysian Palm Oil Board. (p. 282-289).
MPOB Test Methods P3.4-Part 1. (2005).Methods of test for palm oil and palm oil
products: Preparation of methyl esters of fatty acids-part 1: Boron trifluoride method. In
MPOB Test Methods. Kuala Lumpur: Malaysian Palm Oil Board. (p. 297-300).

129
MPOB Test Methods P3.4-Part 4. (2005).Methods of test for palm oil and palm oil
products: Preparation of methyl esters of fatty acids-part 4: Rapid method. In MPOB Test
Methods. Kuala Lumpur: Malaysian Palm Oil Board. (p. 308-309).
MPOB Test Methods P4.2. (2005). Determination of slip melting point. In MPOB Test
Methods. Kuala Lumpur: Malaysian Palm Oil Board. (p. 336-338).
MPOB Test Methods P4.3. (2005). Determination of cloud point. In MPOB Test Methods.
Kuala Lumpur: Malaysian Palm Oil Board. (p. 339-341).
MPOB Test Methods P4.9-Section 1. (2005). Determination of solid fat content by pulsed
nuclear magnetic resonance (PNMR)-Section 1: Direct Method. In MPOB Test Methods.
Kuala Lumpur: Malaysian Palm Oil Board. (p. 375-384).
Natália M. O., M. Manuela R. da F., and Suzana F-D. (2006). Operational stability of
Thermomyces lanuginose lipase during interesterification of fat in continuous packed-bed
reactors. Eur. J. Lipid. Sci. Technol. 108. 545-553.
Naudet M. (1996). Main chemical constituents of fats. In Karleskind A. (ed). Oils and Fats
Manual: A Comprehensive Treatise (Volume 1). Paris: Lavoisier Publishing. (p. 67-116)
Nor Aini I., Noor Lida H. M. D. (2005). Interesterified palm oil as alternatives to
hydrogenation. Asia Pac J Clin Nutr. 14. 396-401.
Norizzah A. R., Chong C. L., Cheow C. S., and Zahiha O. (2003). Effects of chemical
interesterification on physicochemical properties of palm stearin and palm kernel olein
blends. Food Chemistry. 86. 229-235.
Novozyme. (2004). Enzymatic interesterification. In: Novozyme Interesterification Manual
[Oils & Fats/2002-15391-03]. Version 2.0. Available from: www.novozymes.com.
Accessed Oct 5, 2007.
Paul A., Édith T., Armand B., and Joseph A. (1998). Regiospecific analysis of fractions of
bovine milk fat triacylglycerols with the same partition number. Lipids, 33. 1195- 1201.
Petrauskaité V., De Greyt W. F., Kellens M. J., and Huyghebaert A. D. (1998). Chemical
interesterification of vegetable oil blends: optimization of process parameters. OCL. 5. 65-
69.
Quilan P. and Moore S. (1993). Modification of triglycerides by lipases: process
technology and its application to the production of nutritionally improved fats, INFORM. 4.
580–585.
Razali I. and Nor‟aini S. (1994). The use of palm oil products in frying. In Abdullah A. (ed).
Selected Readings on Palm oil and Its Uses. Kuala Lumpur: Palm Oil Research Institute of
Malaysia. (p. 106-117).

130
Robles-Medina A., González-Moreno P. A., Esteban-Cerdán L., and Molina-Grima E.
(2009). Biocatalysis: Towards ever greener biodiesel production. Biotechnology Advances
27. 398–408.
Ronald P. M. and Jogchum P. (2002). Dietary Fats and Coronary heart disease. In Casimir
C. A. and David B. M. (ed). (Second Edition, Revised and Expanded). New York: Marcel
Dekker Inc. (p.603-636)
Rousseau D. and Marangoni A. (2002). Chemical interesterification of food lipids: Theory
and practice. In Casimir C. A. and David B. M. (ed). Food Lipids Chemistry, Nutrition, and
Biotechnology (Second Edition, Revised and Expanded). New York: Marcel Dekker Inc. (p.
301-333)
Rønne T. H., Pedersen L. S., and Xu X. (2005). Triglyceride selectivity of immobilized
Thermomyces lanuginose lipase in interesterification. J. Am. Oil. Chem. Soc. 82. 737-743.
Sean F. O. (2002). Nomenclature and classification of lipids. In Akoh C. C. and Min D. B.
(ed). Food Lipids Chemistry, Nutrition, and Biotechnology (Second Edition, Revised and
Expanded). New York: Marcel Dekker Inc. (p. 1-40)
Serdarevich B. and Carroll K. K. (1966). Synthesis and characterization of 1- and 2-
monoglycerides of anteiso fatty acids. J Lipid Research. 7. 277-284.
Shimida Y., Ogawa J., Watanebe Y., Nagao T., Kawashima A., Kobayashi T., and Shimizu
S. (2003). Regiospecific analysis by ethanolysis of oil with immobilized Candida
antarctica lipase. Lipids. 38. 1281-1286.
Siew W. L. (2001). Understanding the interactions of diacylglycerols with oils for better
product performance. Proceeding of 2001 International Palm Oil Congress (Chemistry and
Technology). (p.74-81)
Siew W. L. (2002). Palm oil. In Frank D. G. (ed). Vegetables Oils in Food Technology
Composition, Properties and Uses. United Kingdom: Blackwell Publishing. (p. 59-97)
Siew W. L., and Ng W. L. (1996). Characterisation of crystals in palm olein. J. Sci. Food.
Agric. 70. 212-216.
Solomons T. W. G. (2004a). Aldehydes and ketones II. Aldol reactions. In Solomons T. W.
G., and Fryhle C. B. (ed). Organic Chemistry (Eighth Edition). Singapore: John Wiley &
Son (Asia) Pte. Ltd. (p. 769-801)
Solomons T. W. G. (2004b). Amino acids and proteins. In Solomons T. W. G., and Fryhle
C. B. (ed). Organic Chemistry (Eighth Edition). Singapore: John Wiley & Son (Asia) Pte.
Ltd. (p. 1165-1219)
Sreenivasan B. (1978). Interesterification of fats. J Am Oil Chem Soc. 55. 796-805.

131
Swe P. Z., Che Man Y. B., Ghazali H. M.. (1995). Composition of crystal of palm olein
formed at room temperature. J Am Oil Chem Soc. 72. 343-347.
Tan B. K. (1979). Palm oil studies: the effect of fractionation on palm oil triacylglycerides.
[DPhil diss]. Liverpool: Liverpool Polytechnic. 275 p.
Tan B. K. (2009). Healthy oils for home use. Proceeding International Palm Oil Congress
2009. 9-12 November 2009. Kuala Lumpur Convention Centre, Malaysia. (p. 99)
Timms R. E. (2005). Fractional crystallization – the fat modification process for the 21st
century. Eur. J. Lipid Sci. Technol. 107. 48-57.
Thomas A. E., Scharoun J. E., and Ralston H. (1965). Quantitative estimation of isomeric
monoglycerides by thin-layer chromatography. J Am Oil Chem Soc. 42. 789-792.
Turon F., Bachain P., Caro Y., Pina M., and Graille J. (2002). A direct method for
regiospecific analysis of TAG using α-MAG. Lipids, 37. 817-821.
Ucciani E. and Debal A. (1996). Chemical properties of fats. In Karleskind A. (ed). Oils
and Fats Manual (volume 1). Paris: Lavoisier Publishing. (p. 325-443)
Vasudevan P. T., López-Cortés N., Caswell H., Reyes-Duarte D., Plou F. J., Ballesteros A.,
Como K., and Thomson T. (2004). A novel hydrophilic support, Cofoam, for enzyme
immobilization. Biotechnology Letters. 26. 473-477.
Voon P. T., and Kalanithi N. (2008). Significance of the Sn-2 hypothesis. Palm Oil
Developments. 48. 14-19.
Wang Z-W., Li N., and Zong M-H. (2009). A simple procedure for the synthesis of
potential 6-azauridine prodrugs by Thermomyces lanuginose lipase. J. Molecular Catalysis
B: Enzymatic. 59. 212-219.
Watanabe. Y, Shimada. Y, Sugihara. A, Noda. H, Fukura. H, and Tominaga. Y. (2000).
Continuous production of biodiesel fuel from vegetable oil using immobilized Candida
antarctica lipase. J. Am. Oil. Chem. Soc. 77. 355-360.
Willis W. M. and Marangoni A. G. (2002). Enzymatic interesterification. In Akoh C. C.
and Min D. B. (ed). Food Lipids Chemistry, Nutrition, and Biotechnology (Second Edition,
Revised and Expanded). New York: Marcel Dekker Inc. (p. 839-875)
World Health Organization. (2003). Diet, Nutrition and the Prevention of Chronic Diseases.
Technical report series 916.
Xu X. (2000). Production of specific-structured triacylglycerols by lipase-catalyzed
reactions: a review. Eur. J. Lipid Sci. Technol. 102. 287-303.
Xu X., Skands A., and Adler-Nissen J. (2001). Purification of specific structured lipids by
distillation: Effects of acyl migration. J Am Oil Chem Soc. 78. 715-718.

132
Xu X., Porsgaard T., Zang H., Adler-Nissen J., and Høy C-E. (2002). Production of
structured lipids in a packed-bed reactor with Thermomyces lanuginosa lipase. J Am Oil
Chem Soc. 79. 561-565.
Xu X. (2003). Engineering of enzymatic reactions and reactors for lipid modification and
systhesis. Eur. J. Lipid. Sci. Technol. 105. 289-304.
Yamaguchi, Akoh C. C., and Lai O. M. (2004). Modification of fish oil by Lipozyme TL
IM to produce structured lipid. J. Food Lipids. 11. 65-73.
Yang. T, and Xu X. (2001). Enzymatic modification of palm oils: Useful products with
potential processes. In Proceeding of the 2001 PIPOC International Palm Oil Congress
(Chemistry and Technology): Kuala Lumpur: Malaysian Palm Oil Board (p. 45-64)
Zaliha O., Chong C. L., Cheow C. S., Norizzah A. R., Kellens M. J. (2004). Crystallization
properties of palm oil by dry fractionation. Food Chemistry. 86. 245-250.
Zeitoun M. A. M., Neff W. E., List G. R. and Mounts T. L. (1993). Physical properties of
interesterified fat blends. J Am Oil Chem Soc. 70. 467-471.
Zhang H., Xu X., Mu H., Nilsson J., Adler-Nissen J., and Høy C-E. (2000). Lipozyme IM-
catalyzed interesterification for the production of margarine fats in a 1 kg scale stirred tank
reactor. Eur. J. Lipid. Sci. Technol. 102. 411-418.
Zhang H., Xu X., Nilsson J., Mu H., Adler-Nissen J., and Høy C-E. (2001). Production of
margarine fats by enzymatic interesterification with silica-granulated Thermomyces
lanuginose lipase in a large-scale study. J. Am. Oil. Chem. Soc., 78. 57-64.

133
APPENDICES
Appendix A
The application sheet of Lipozyme® TL IM

134
Appendix A, continued

135
Appendix A, continued

136
Appendix A, continued

137
Appendix A, continued

138
Appendix B
The application sheet of Lipozyme® RM IM

139
Appendix B, continued

140
Appendix C
The normalized triacylglycerols compositions (Area %) of the 2 %w/w Lipozyme® TL IM
lab-scale interesterification products after 1, 2, 3, 4, 8 and 24 hours of reaction
Triacylglycerols POo IV 62 1 2 3 4 8 24
Total triunsaturated 9.7 12.1 13.6 14.8 16.0 18.4 20.9
OLL 0.9 1.1 1.3 1.6 1.7 2.2 2.7
OLO 2.8 4.0 4.7 5.2 5.8 6.9 8.1
OOO 6.1 7.1 7.6 8.1 8.6 9.3 10.1
Total diunsaturated 56.4 54.6 53.1 52.1 50.0 47.0 44.3
PLL 3.7 3.5 3.4 3.5 3.3 3.2 3.2
PLO 15.8 16.1 16.1 16.2 15.8 15.5 15.0
POO 33.0 31.6 30.3 29.4 27.8 25.5 23.7
SOO 3.9 3.4 3.3 3.1 3.1 2.8 2.4
Total disaturated 33.6 32.5 32.0 31.5 31.4 30.7 29.4
MLP 0.8 0.8 0.8 0.8 0.8 0.9 0.9
PLP 10.5 9.8 9.2 8.9 8.5 7.4 6.5
POP 18.3 18.4 18.3 18.2 18.2 18.4 18.0
POS 3.6 3.3 3.5 3.5 3.5 3.6 3.6
SOS 0.5 0.3 0.3 0.2 0.5 0.5 0.5
Total trisaturated 0.4 0.9 1.4 1.7 2.7 4.0 5.5
PPP 0.4 0.7 1.1 1.3 2.2 3.1 4.2
PPS 0.0 0.2 0.3 0.4 0.5 0.9 1.3

141
Appendix D
The normalized triacylglycerols compositions (Area %) of the 5 %w/w Lipozyme® TL IM
lab-scale interesterification products after 1, 2, 3, 4, 8 and 24 hours of reaction
Triacylglycerols POo IV 62 1 2 3 4 8 24
Total triunsaturated 9.7 15.3 17.9 18.8 19.8 21.2 21.8
OLL 0.9 1.7 2.1 2.1 2.3 2.7 2.8
OLO 2.8 5.4 6.7 7.2 7.6 8.2 8.8
OOO 6.1 8.3 9.2 9.6 9.9 10.3 10.2
Total diunsaturated 56.4 51.0 48.0 47.0 46.0 44.4 43.2
PLL 3.7 3.4 3.3 3.1 3.1 3.2 3.2
PLO 15.8 15.9 15.7 15.5 15.4 15.0 14.2
POO 33.0 28.6 26.3 25.7 24.9 23.8 23.4
SOO 3.9 3.1 2.8 2.8 2.6 2.5 2.4
Total disaturated 33.6 31.8 30.9 30.4 30.0 29.2 29.5
MLP 0.8 0.8 0.9 0.7 0.8 0.9 1.0
PLP 10.5 8.6 7.7 7.2 6.9 6.6 6.4
POP 18.3 18.4 18.3 18.4 18.2 17.8 17.8
POS 3.6 3.6 3.6 3.6 3.6 3.5 3.6
SOS 0.5 0.4 0.5 0.5 0.5 0.5 0.9
Total trisaturated 0.4 2.0 3.2 3.8 4.4 5.3 5.6
PPP 0.4 1.6 2.5 3.0 3.4 4.1 4.4
PPS 0.0 0.4 0.7 0.8 1.0 1.2 1.3

142
Appendix E
The normalized triacylglycerols compositions (Area %) of the 10 %w/w Lipozyme® TL IM
lab-scale interesterification products after 1, 2, 3, 4, 8 and 24 hours of reaction
Triacylglycerols POo IV 62 1 2 3 4 8 24
Total triunsaturated 9.7 14.5 16.6 18.6 19.2 21.2 21.2
OLL 0.9 1.4 1.7 2.2 2.2 2.8 2.8
OLO 2.8 5.0 6.1 6.9 7.3 8.3 8.2
OOO 6.1 8.1 8.8 9.5 9.7 10.2 10.2
Total diunsaturated 56.4 51.8 50.0 48.0 47.0 43.8 43.9
PLL 3.7 3.4 3.3 3.3 3.1 3.2 3.2
PLO 15.8 16.0 16.0 15.8 15.6 14.7 14.8
POO 33.0 29.6 27.8 26.3 25.7 23.4 23.6
SOO 3.9 2.9 3.0 2.7 2.7 2.6 2.4
Total disaturated 33.6 32.1 30.9 30.2 29.9 29.3 29.3
MLP 0.8 0.8 0.8 0.9 0.7 0.9 0.8
PLP 10.5 9.1 8.2 7.6 7.0 6.4 6.4
POP 18.3 18.4 18.3 18.1 18.2 18.0 18.0
POS 3.6 3.4 3.3 3.3 3.6 3.6 3.6
SOS 0.5 0.5 0.5 0.5 0.5 0.5 0.5
Total trisaturated 0.4 1.6 2.6 3.3 4.0 5.7 5.7
PPP 0.4 1.3 2.0 2.6 3.1 4.5 4.4
PPS 0.0 0.3 0.6 0.7 0.9 1.3 1.3

143
Appendix F
The normalized TAG compositions (Area %) of the 2 %w/w Lipozyme® RM IM lab-
scale interesterification products after 1, 2, 3, 4, 8 and 24 hours of reaction
Triacylglycerols POo IV 62 1 2 3 4 8 24
Total triunsaturated 9.7 11.4 12.1 13.6 14.2 15.9 19.1
OLL 0.9 1.0 1.2 1.4 1.4 1.8 2.3
OLO 2.8 3.6 3.9 4.7 4.9 5.7 7.3
OOO 6.1 6.8 7.1 7.6 8.0 8.5 9.6
Total diunsaturated 56.4 54.7 53.9 52.8 52.0 49.1 47.4
PLL 3.7 3.5 3.6 3.5 3.4 3.4 3.3
PLO 15.8 16.1 15.9 16.4 16.3 15.8 16.0
POO 33.0 31.7 30.9 29.9 29.3 26.9 25.4
SOO 3.9 3.5 3.5 3.1 3.1 3.1 2.7
Total disaturated 33.6 33.4 33.4 32.7 32.7 33.1 30.9
MLP 0.8 0.8 0.9 0.9 0.9 1.0 0.9
PLP 10.5 9.9 9.8 9.4 9.3 8.7 7.5
POP 18.3 18.5 18.7 18.7 18.8 19.2 18.4
POS 3.6 3.7 3.6 3.6 3.6 3.8 3.6
SOS 0.5 0.5 0.5 0.2 0.2 0.5 0.5
Total trisaturated 0.4 0.6 0.7 1.0 1.1 1.9 2.8
PPP 0.4 0.5 0.6 0.8 0.9 1.6 2.2
PPS 0.0 0.1 0.1 0.2 0.2 0.3 0.6

144
Appendix G
The normalized TAG compositions (Area %) of the 5 %w/w Lipozyme® RM IM lab-scale
interesterification products after 1, 2, 3, 4, 8 and 24 hours of reaction
Triacylglycerols POo IV 62 1 2 3 4 8 24
Total triunsaturated 9.7 13.5 15.5 16.2 16.7 17.2 19.0
OLL 0.9 1.3 1.6 1.7 1.7 1.9 2.3
OLO 2.8 4.7 5.6 5.9 6.2 6.3 7.2
OOO 6.1 7.6 8.4 8.6 8.9 9.0 9.5
Total diunsaturated 56.4 52.7 50.3 49.4 48.6 48.7 47.0
PLL 3.7 3.4 3.3 3.3 3.2 3.2 3.3
PLO 15.8 16.1 16.1 16.0 16.0 16.1 15.9
POO 33.0 29.9 27.9 27.2 26.5 26.6 25.1
SOO 3.9 3.3 3.1 3.0 2.9 2.8 2.8
Total disaturated 33.6 32.8 32.7 32.8 32.9 32.3 31.0
MLP 0.8 0.7 0.9 0.8 0.9 0.8 1.0
PLP 10.5 9.3 8.8 8.5 8.5 8.1 7.4
POP 18.3 18.8 19.0 19.3 19.4 19.2 18.4
POS 3.6 3.6 3.7 3.8 3.7 3.8 3.7
SOS 0.5 0.5 0.5 0.5 0.5 0.5 0.6
Total trisaturated 0.4 1.0 1.5 1.7 1.9 1.9 3.2
PPP 0.4 0.8 1.3 1.4 1.6 1.5 2.5
PPS 0.0 0.2 0.3 0.3 0.3 0.4 0.7
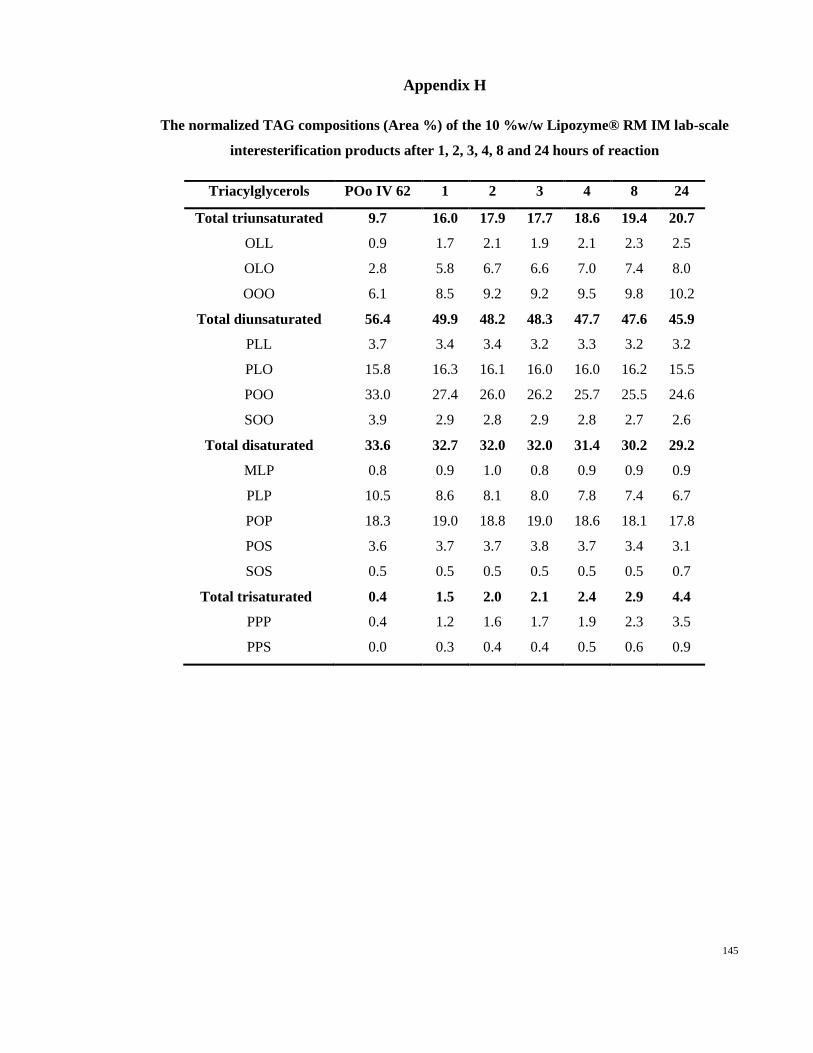
145
Appendix H
The normalized TAG compositions (Area %) of the 10 %w/w Lipozyme® RM IM lab-scale
interesterification products after 1, 2, 3, 4, 8 and 24 hours of reaction
Triacylglycerols POo IV 62 1 2 3 4 8 24
Total triunsaturated 9.7 16.0 17.9 17.7 18.6 19.4 20.7
OLL 0.9 1.7 2.1 1.9 2.1 2.3 2.5
OLO 2.8 5.8 6.7 6.6 7.0 7.4 8.0
OOO 6.1 8.5 9.2 9.2 9.5 9.8 10.2
Total diunsaturated 56.4 49.9 48.2 48.3 47.7 47.6 45.9
PLL 3.7 3.4 3.4 3.2 3.3 3.2 3.2
PLO 15.8 16.3 16.1 16.0 16.0 16.2 15.5
POO 33.0 27.4 26.0 26.2 25.7 25.5 24.6
SOO 3.9 2.9 2.8 2.9 2.8 2.7 2.6
Total disaturated 33.6 32.7 32.0 32.0 31.4 30.2 29.2
MLP 0.8 0.9 1.0 0.8 0.9 0.9 0.9
PLP 10.5 8.6 8.1 8.0 7.8 7.4 6.7
POP 18.3 19.0 18.8 19.0 18.6 18.1 17.8
POS 3.6 3.7 3.7 3.8 3.7 3.4 3.1
SOS 0.5 0.5 0.5 0.5 0.5 0.5 0.7
Total trisaturated 0.4 1.5 2.0 2.1 2.4 2.9 4.4
PPP 0.4 1.2 1.6 1.7 1.9 2.3 3.5
PPS 0.0 0.3 0.4 0.4 0.5 0.6 0.9

146
Appendix I
TAG composition of stearin fractions from lab-scale fractionatin of batch RMIM
Triacylglycerols Stearin
8 °C
Stearin
10 °C
Stearin
12 °C
Stearin
15 °C
Stearin
18 °C
Total triunsaturated 10.5 9.9 9.7 10.5 10.6
OLL 0.9 0.8 0.9 0.9 0.9
OLO 3.8 3.6 3.5 3.7 3.7
OOO 5.9 5.6 5.3 5.9 6.1
Total diunsaturated 30.9 30.2 28.0 29.9 30.3
PLL 1.8 2.0 2.0 2.0 2.1
PLO 9.8 9.5 8.8 9.6 9.6
POO 17.4 16.9 15.7 16.7 16.7
SOO 2.0 1.9 1.6 1.7 2.0
Total disaturated 37.5 40.6 40.4 35.9 33.1
MLP 0.7 0.7 0.7 0.6 0.6
PLP 7.8 8.1 7.8 7.3 6.9
POP 23.9 26.0 26.1 23.0 20.9
POS 4.9 5.2 5.1 4.5 1.2
SOS 0.4 0.8 0.7 0.6 0.6
Total trisaturated 7.6 7.2 8.6 10.0 12.2
PPP 6.1 5.8 7.0 8.0 9.7
PPS 1.5 1.4 1.7 2.0 2.5

147
Appendix J
Fatty acid composition of stearin fractions from lab-scale fractionatin of batch RMIM
Sample
Fatty acid composition (Area %)
IV C12:0 C14:0 C16:0 C18:0 C20:0 SFA C16:1 C18:1 MUFA C18:2 C18:3 PUFA
Stearin 8 C 0.2 1.2 45.4 4.9 0.5 52.2 0.2 37.5 37.7 10.0 0.1 10.1 49.9
Stearin 10 C 0.2 1.2 46.2 5.0 0.5 53.1 0.2 36.9 37.1 9.7 0.1 9.8 48.8
Stearin 12 C 0.2 1.3 48.3 5.0 0.5 55.2 0.2 35.3 35.5 9.1 0.1 9.2 46.4
Stearin 15 C 0.2 1.2 47.9 5.0 0.5 54.9 0.2 35.4 35.6 9.4 0.1 9.5 47.0
Stearin 18 C 0.2 1.2 49.3 5.1 0.5 56.2 0.2 34.2 34.4 9.2 0.1 9.3 45.6
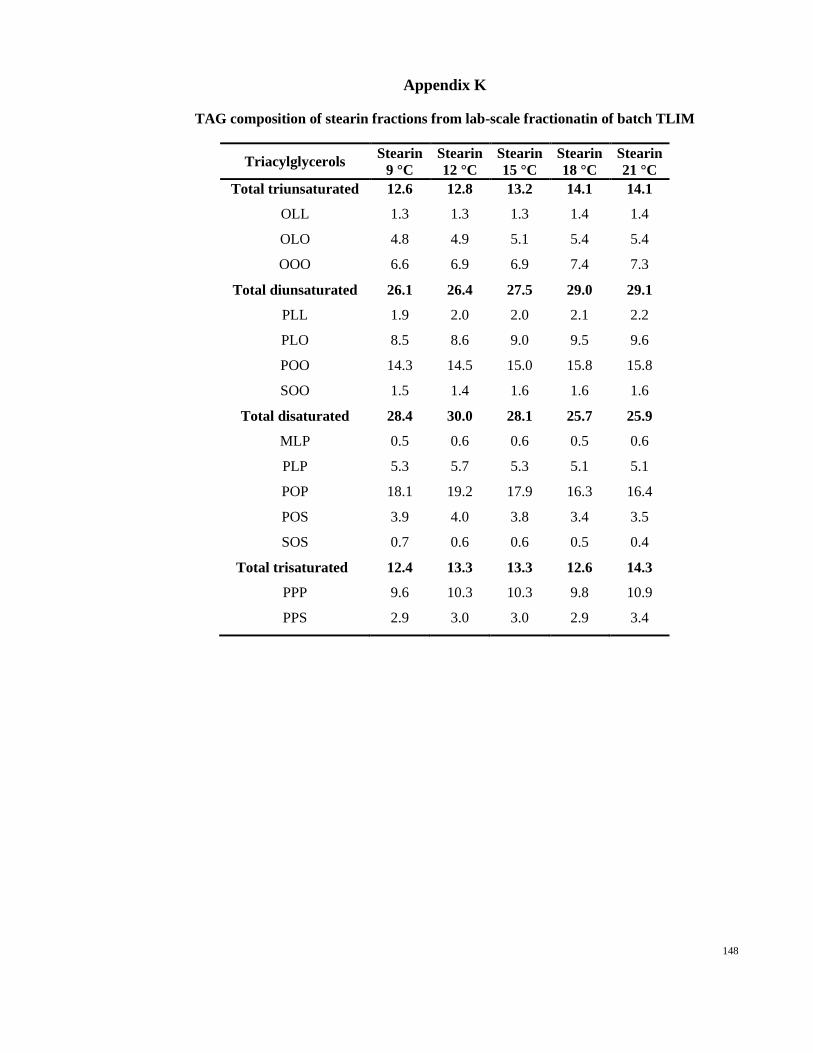
148
Appendix K
TAG composition of stearin fractions from lab-scale fractionatin of batch TLIM
Triacylglycerols Stearin
9 °C
Stearin
12 °C
Stearin
15 °C
Stearin
18 °C
Stearin
21 °C
Total triunsaturated 12.6 12.8 13.2 14.1 14.1
OLL 1.3 1.3 1.3 1.4 1.4
OLO 4.8 4.9 5.1 5.4 5.4
OOO 6.6 6.9 6.9 7.4 7.3
Total diunsaturated 26.1 26.4 27.5 29.0 29.1
PLL 1.9 2.0 2.0 2.1 2.2
PLO 8.5 8.6 9.0 9.5 9.6
POO 14.3 14.5 15.0 15.8 15.8
SOO 1.5 1.4 1.6 1.6 1.6
Total disaturated 28.4 30.0 28.1 25.7 25.9
MLP 0.5 0.6 0.6 0.5 0.6
PLP 5.3 5.7 5.3 5.1 5.1
POP 18.1 19.2 17.9 16.3 16.4
POS 3.9 4.0 3.8 3.4 3.5
SOS 0.7 0.6 0.6 0.5 0.4
Total trisaturated 12.4 13.3 13.3 12.6 14.3
PPP 9.6 10.3 10.3 9.8 10.9
PPS 2.9 3.0 3.0 2.9 3.4

149
Appendix L
Fatty acid composition of stearin fractions from lab-scale fractionatin of batch TLIM
Sample
Fatty acid composition (Area %)
IV C12:0 C14:0 C16:0 C18:0 C20:0 SFA C16:1 C18:1 MUFA C18:2 C18:3 PUFA
Stearin 9 C 0.2 1.2 46.3 5.1 0.5 53.3 0.2 36.4 36.6 10.0 0.0 10.0 48.7
Stearin 12 C 0.2 1.2 47.4 5.2 0.5 54.5 0.2 35.6 35.8 9.7 0.0 9.7 47.4
Stearin 15 C 0.2 1.2 46.5 5.1 0.5 53.4 0.2 36.3 36.5 10.0 0.0 10.0 48.5
Stearin 18 C 0.2 1.2 44.6 4.9 0.5 51.4 0.2 37.8 38.0 10.5 0.0 10.5 50.8
Stearin 21 C 0.2 1.2 45.7 5.0 0.5 52.6 0.2 36.8 37.0 10.2 0.1 10.3 49.6

150
Appendix M
TAG composition of stearin fractions from lab-scale fractionatin of packed-bed TLIM
Triacylglycerols Stearin
9 °C
Stearin
12 °C
Stearin
15 °C
Stearin
18 °C
Stearin
21 °C
Total triunsaturated 14.1 14.8 15.7 15.5 15.5
OLL 1.5 1.8 1.9 1.9 1.9
OLO 5.4 5.8 6.2 6.1 6.1
OOO 7.1 7.3 7.6 7.5 7.6
Total diunsaturated 30.7 31.1 32.5 32.6 32.5
PLL 2.0 1.6 1.5 2.3 2.1
PLO 9.8 10.3 11.0 10.9 10.7
POO 17.0 17.5 18.3 17.9 17.9
SOO 1.8 1.8 1.6 1.6 1.8
Total disaturated 35.6 33.8 31.2 30.4 29.5
MLP 0.7 0.6 0.6 0.6 0.6
PLP 6.8 6.6 6.3 6.1 5.8
POP 22.7 21.5 19.7 19.3 18.8
POS 4.8 4.5 4.1 3.9 3.9
SOS 0.6 0.6 0.5 0.5 0.4
Total trisaturated 12.2 12.5 11.8 12.6 13.2
PPP 9.5 9.7 9.1 9.8 10.2
PPS 2.7 2.8 2.7 2.8 3.0

151
Appendix N
Fatty acid composition of stearin fractions from lab-scale fractionatin of packed-bed TLIM
Sample
Fatty acid composition (Area %)
IV C12:0 C14:0 C16:0 C18:0 C20:0 SFA C16:1 C18:1 MUFA C18:2 C18:3 PUFA
Stearin 9 C 0.2 1.2 44.0 4.8 0.5 50.7 0.2 38.4 38.6 10.6 0.1 10.7 51.7
Stearin 12 C 0.2 1.2 43.9 4.7 0.5 50.5 0.2 38.4 38.6 10.7 0.2 10.9 52.0
Stearin 15 C 0.2 1.2 42.5 4.6 0.5 49.0 0.2 39.7 39.9 11.1 0.1 11.2 53.6
Stearin 18 C 0.2 1.2 43.0 4.6 0.5 49.5 0.2 39.0 39.2 11.0 0.2 11.2 53.2
Stearin 21 C 0.2 1.2 43.2 4.7 0.5 49.8 0.2 39.1 39.3 10.9 0.1 11.0 52.8

152
LIST OF PUBLICATIONS
The work presented in this thesis has been published / presented either fully or partially in
the following: -
Journal
Saw M. H., Chuah C. H., and Siew W. L. (2009). Characterization of low saturation palm
oil products after continuous enzymatic interesterification and dry fractionation. J Food
Science. 74. E177-E183.
Conference
Saw M. H., Siew W. L., and Chuah C. H. (2007). Regiospecificities of sn-1,3 specific
lipases for enzymatic interesterification for RBD palm olein. Poster presented in Malaysian
Science and Technology Congress 2007, 4-6th
September 2007, Subang Jaya, Selangor.
Saw M. H., Siew W. L. and Chuah C. H. (2008). Enzymatic interesterification of RBD
palm olein by lipase Rhizomucor Miehei. Poster presented in 2008 National Seminar on
Palm Oil Milling, Refining Technology, Quality and Environment, 15-16th
October 2008,
Kota Kinabalu, Sabah.
Saw M. H., Siew W. L. and Chuah C. H. (2009). Physical properties of enzymatic
interesterification of palm olein. Poster presented in MPOB International Palm Oil
Congress 2009 (PIPOC 2009), 9-12th
November 2009, Kuala Lumpur.