Embed Size (px)
Citation preview

1
Logistics Systems EngineeringReliability Fundamentals
NTUSY-521-N
SMUSYS 7340
Dr. Jerrell T. Stracener, SAE Fellow
2
Reliability - Basic Concepts
3
Reliability
• A product, service and system attribute as wellas an engineering function
• Reliability principles, methods and techniques apply to:products and servicesandLogistics systems
4
Reliability Concepts, Principles and Methodology
• Hardware• Software• Operator• Service• Product• Production/Manufacturing Processes and Equipment• Product and Customer Support• Systems
5
What is Reliability
To the user of a product, reliability is problem free operationReliability is a function of stress
To understand reliability, understand stress on hardwarewhere its going to be usedhow its going to be usedwhat environment it is going to be used in

6
What is Reliability
– To efficiently achieve reliability, rely on analytical understanding of reliability and less on understanding reliability through testing
– Field ProblemsStress/DesignParts and Workmanship
7
What is Reliability
– Reliability affects market share:During the 1970’s, Western color TV sets were
failing in service at a rate of five times that prevailing in Japanese sets
Example 1: Prior to coming under Japanese
management, the U.S. Motorola factory ran at a “fall-off” rate of 150 to 180 per 100 sets packed. This meant that 150 to 180 defects were found for every 100 sets packed.
8
What is Reliability
– Reliability affects market share:Example 1 (Continued):
Three years later, after being taken over by a Japanese company, the fall-off rate at Quasar (the new name of the factory) had gone down to a level of about 3 or 4 per 100 sets.5
9
What is Reliability
– Reliability affects market share:Example 2:
Western automobiles have experienced a similar problem as in example 1. Consumer Reports annually published frequency of repair statistics for automobiles, taken from surveys of the magazine’s many readers. In short, there were almost no American car names reported in vehicles with high reliability.
10
What is Reliability
– Reliability affects market share:Example 2 (Continued):
Consumers bought millions of imported cars because they have the reputation of reliability. Each million cars the US imports represents abut $15 billion added to the US trade deficit.6
– Reliability affects risk:Example:
11
What is Reliability
– Reliability affects risk:Example:
The Challenger space shuttle solid rocket motor was designed and qualified to operate in the range of 50 to 90oF. On January 27-28, the temperatures at the launch site were predicted around 18oF. The political decision to launch anyway cost seven lives and a delay of over 30 months in the US space program.7
12
Definitions
– Reliability is a characteristic of an item, expressed by the probability that the item will perform its required function under given conditions for a stated time interval.1
– The probability that an item will perform a required function without failure under stated conditions for a stated period of time.2

13
Definitions
– The probability that an item will perform its intended function for a specified interval under stated conditions.3
– The rigorous definition has four parts:4 1. Reliability is the probability that a system2. will demonstrate specified performance3. For a stated period of time4. when operated under specified conditions.
14
Definitions
– Reliability is a measure of the capability of a system, equipment or component to operate without failure when in service.
– Reliability provides a quantitative statement of the chance that an item will operate without failure for a given period of time in the environment for which it was designed.
15
Definitions
– In its simplest and most general form, reliability is the probability of success.
– To perform reliability calculations, reliability must first be defined explicitly. It is not enough to say that reliability is a probability. A probability of what?
16
Definitions
– Succinctly put, reliability is a performance attribute that is concerned with the probability of success and frequency of failures and is defined as: The probability that an item will perform
its intended function under stated conditions, for either a specified interval or over its useful life.
17
Definition of Reliability
The essential elements of a definition of reliability are:System, subsystem, equipment or componentSatisfactory performanceRequired period of operationConditions of operation
EnvironmentOperationMaintenanceSupport

18
SystemsDefinition &Description
RequiredPeriod ofOperation
Degree ofCustomer
Satisfaction
Operation
Reliability
Definition ofSuccessful
Performance
Environment
19
Reliability is
PERFORMANCEOVERTIME
20
What Affects Reliability
– Redundancy– Design Simplicity– Time– Learning Curve– Material Quality– Experience– Requirements
21
Prediction of Product PerformanceHow many items will be required to meet
demand?How much maintenance and support will
be required? Facilities Spares Maintenance Personnel
How many items will not meet warranty?
Why is Reliability Modeling & Analysis Needed
22
– Basis for design, manufacturing and support decisionsEvaluate AlternativesIdentify and rank drivers
Why is Reliability Modeling & Analysis Needed
23
How is Reliability Used
– It is used to define the longevity of a product and the associated cost it incurs.
– It helps identify risk of the product for both the consumer and producer.
– It incorporates statistics to better identify how much “give” or “take” can go into a product or service. Usually, the higher the reliability, the higher the initial cost.
– It predicts the likelihood of failure for a product, service or system.
24
How is Reliability Used
– Basic reliability and mission reliability predictions are used through the item design phase to performDesign evaluations
requirements assessment design comparisons
Trade-studies evaluation design alternatives rank design alternatives
25
How is Reliability Used
Perform sensitivity analyses Mission effectiveness Supportability Life cycle costs Warranties
26
Importance of Reliability
– Reliability is a measure of a product’s performance that affects both product function and operating and repair costs
– The reliability of a product is a primary factor in determining operating and repair costs.
– Reliability determines whether or not a product is available to perform its function.

27
Reliability Goals
1. Increase competitive position2. Increase customer satisfaction3. Reduce customer support requirements4. Decrease cost of ownership
28
Reliability - Basic Metrics and Models
29
30
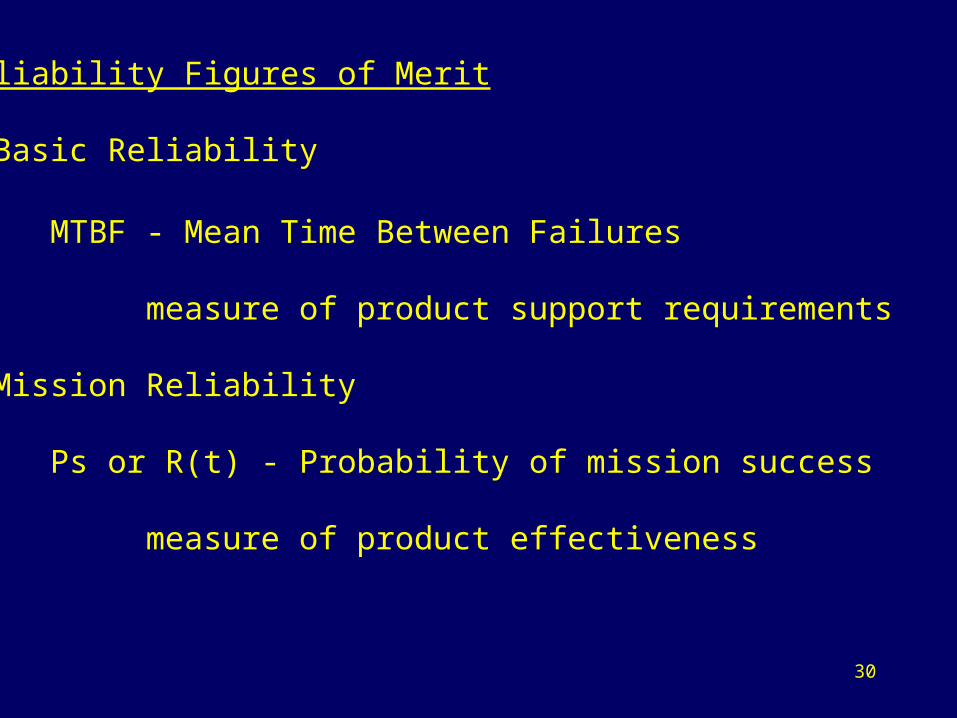
Reliability Figures of Merit
• Basic Reliability
MTBF - Mean Time Between Failures
measure of product support requirements
• Mission Reliability
Ps or R(t) - Probability of mission success
measure of product effectiveness
31
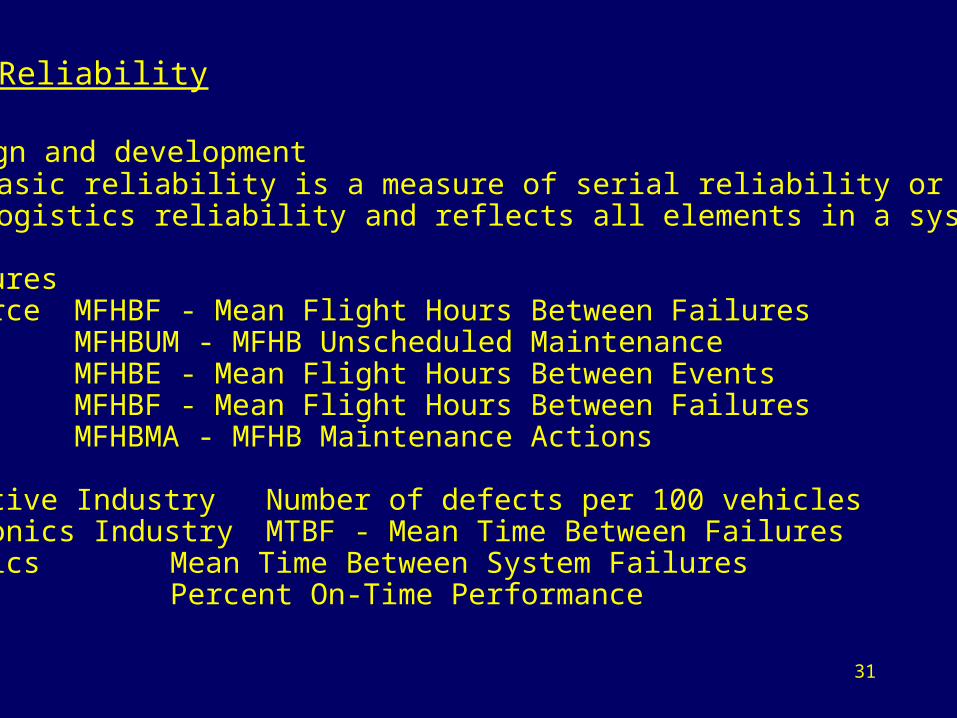
Basic Reliability
• Design and developmentBasic reliability is a measure of serial reliability or logistics reliability and reflects all elements in a system
• MeasuresAir Force MFHBF - Mean Flight Hours Between Failures
MFHBUM - MFHB Unscheduled MaintenanceArmy MFHBE - Mean Flight Hours Between EventsNavy MFHBF - Mean Flight Hours Between Failures
MFHBMA - MFHB Maintenance Actions
Automotive Industry Number of defects per 100 vehiclesElectronics Industry MTBF - Mean Time Between FailuresLogistics Mean Time Between System Failures
Percent On-Time Performance
32
33
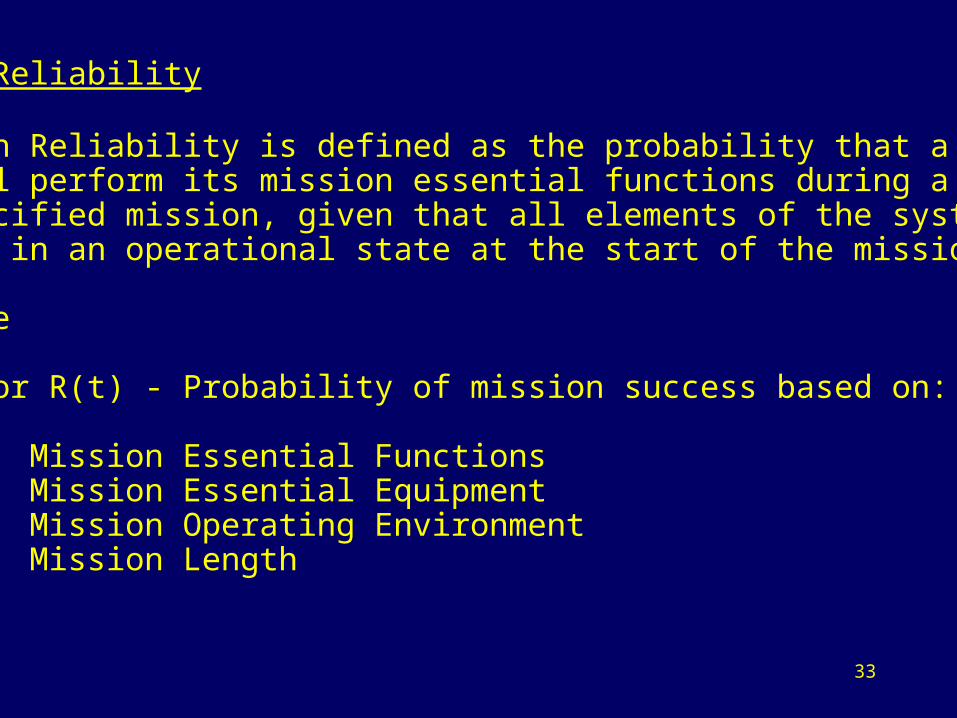
Mission Reliability
• Mission Reliability is defined as the probability that a system will perform its mission essential functions during a specified mission, given that all elements of the systemare in an operational state at the start of the mission.
• Measure
Ps or R(t) - Probability of mission success based on:
Mission Essential FunctionsMission Essential EquipmentMission Operating EnvironmentMission Length

34
Reliability Life Characteristic Curve
35
The Exponential Model:
RemarksThe Exponential Model is most often used in Reliability applications, partly because of mathematical convenience due to a constant failure rate.
The Exponential Model is often referred to as the Constant Failure Rate Model.
The Exponential Model is used during the ‘Useful Life’ period of an item’s life, i.e., after the ‘Infant Mortality’ period before Wearout begins.
The Exponential Model is most often associated with electronic equipment.
36
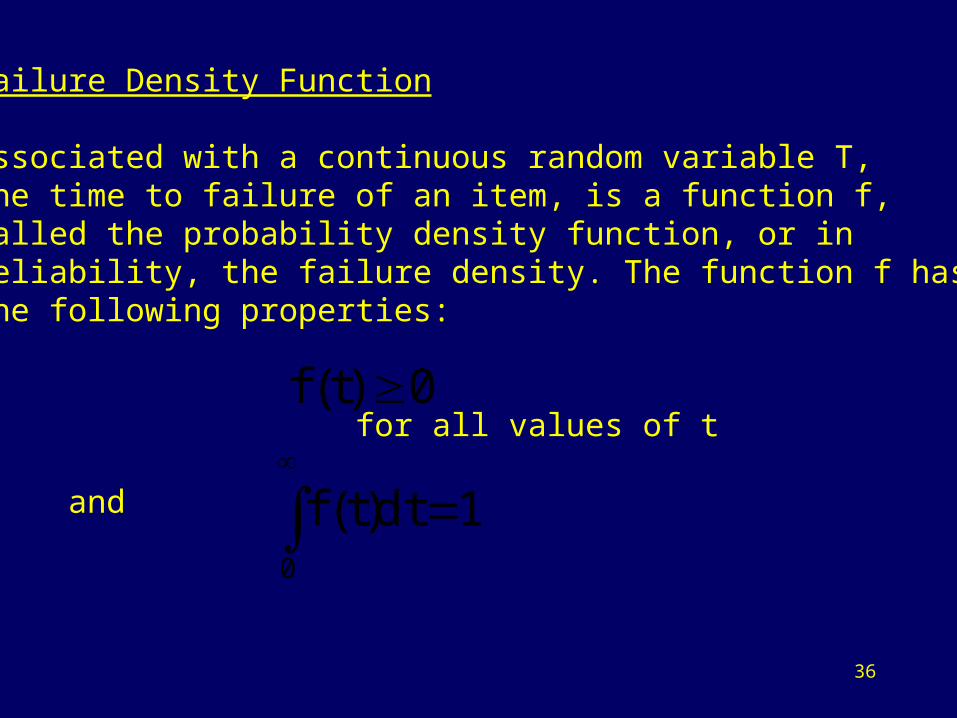
Failure Density Function
Associated with a continuous random variable T, the time to failure of an item, is a function f, called the probability density function, or inreliability, the failure density. The function f has the following properties:
for all values of t
and
0)t(f
1dt)t(f0
37
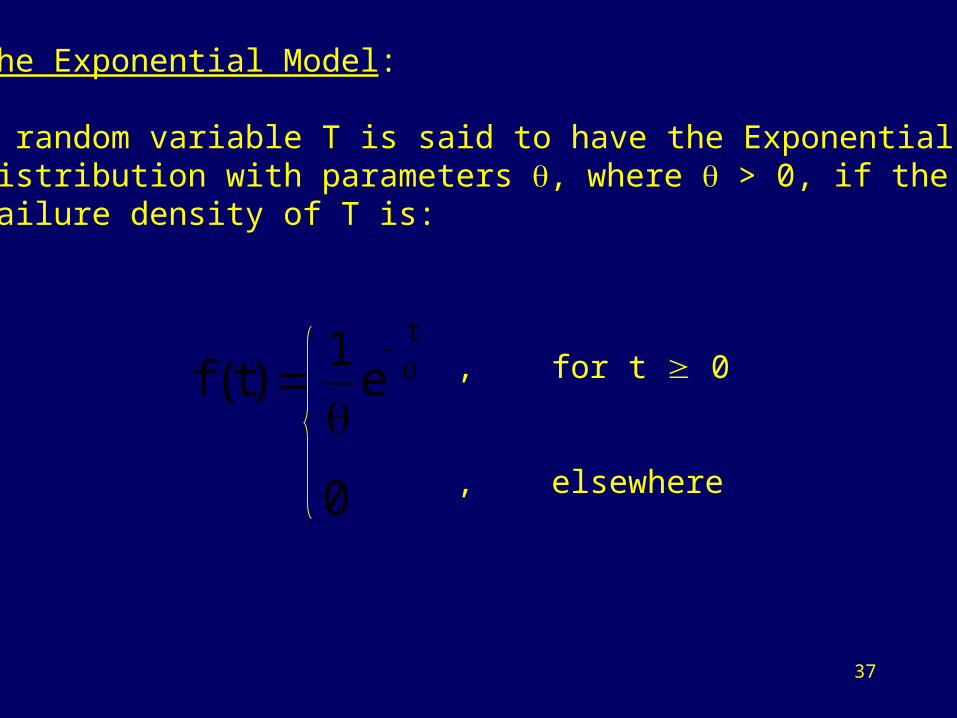
The Exponential Model:
A random variable T is said to have the ExponentialDistribution with parameters , where > 0, if the failure density of T is:
, for t 0
, elsewhere
t
e1
)t(f
0
38
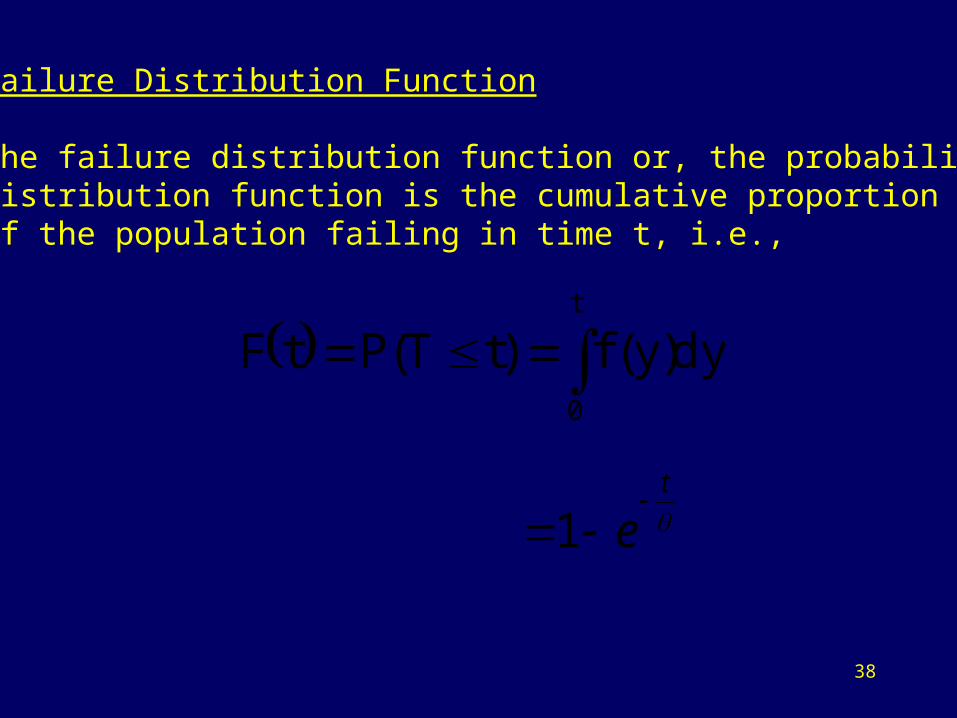
Failure Distribution Function
The failure distribution function or, the probability distribution function is the cumulative proportion of the population failing in time t, i.e.,
dy)y(f)tT(PtFt
0
t
e
1
39
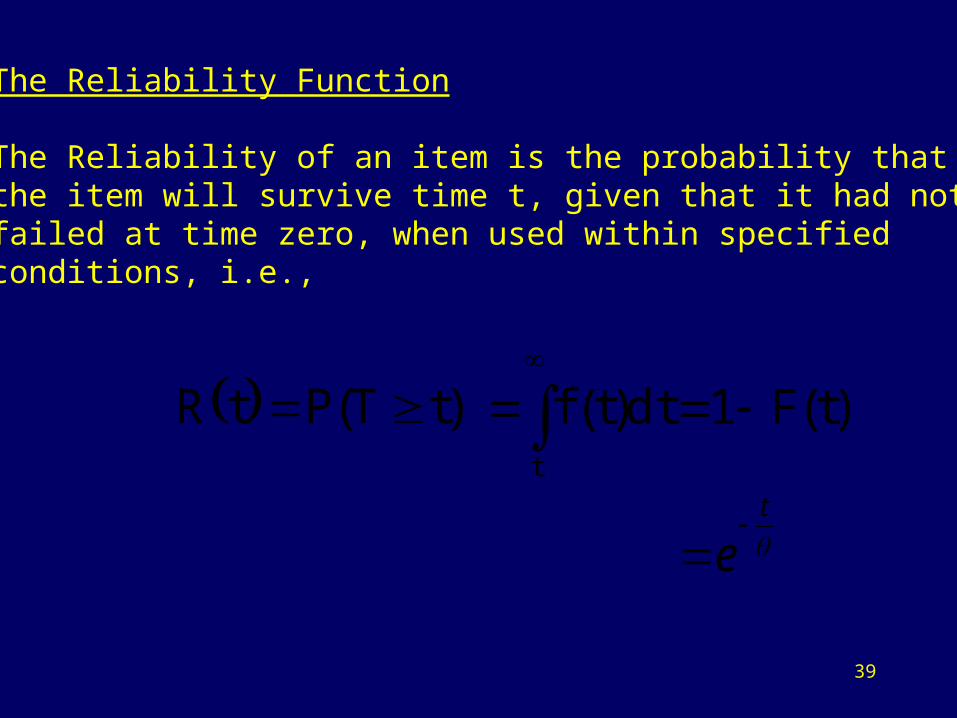
The Reliability Function
The Reliability of an item is the probability that the item will survive time t, given that it had not failed at time zero, when used within specified conditions, i.e.,
)tT(PtR
t
)t(F1dt)t(f
t
e
40
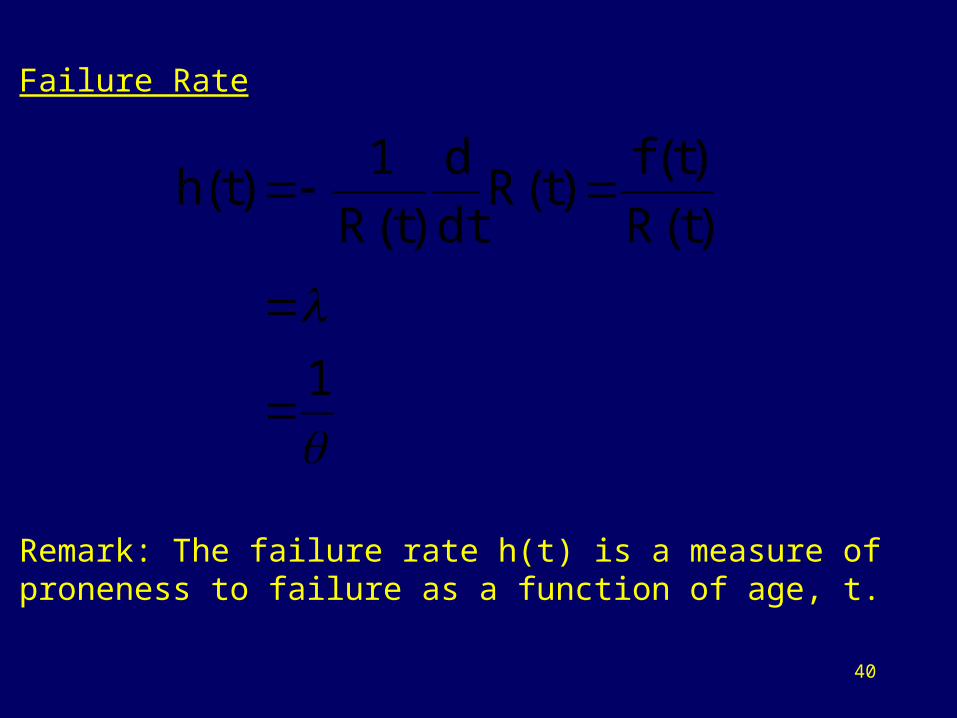
Failure Rate
Remark: The failure rate h(t) is a measure of proneness to failure as a function of age, t.
)t(R
)t(f)t(R
dt
d
)t(R
1)t(h
1
41
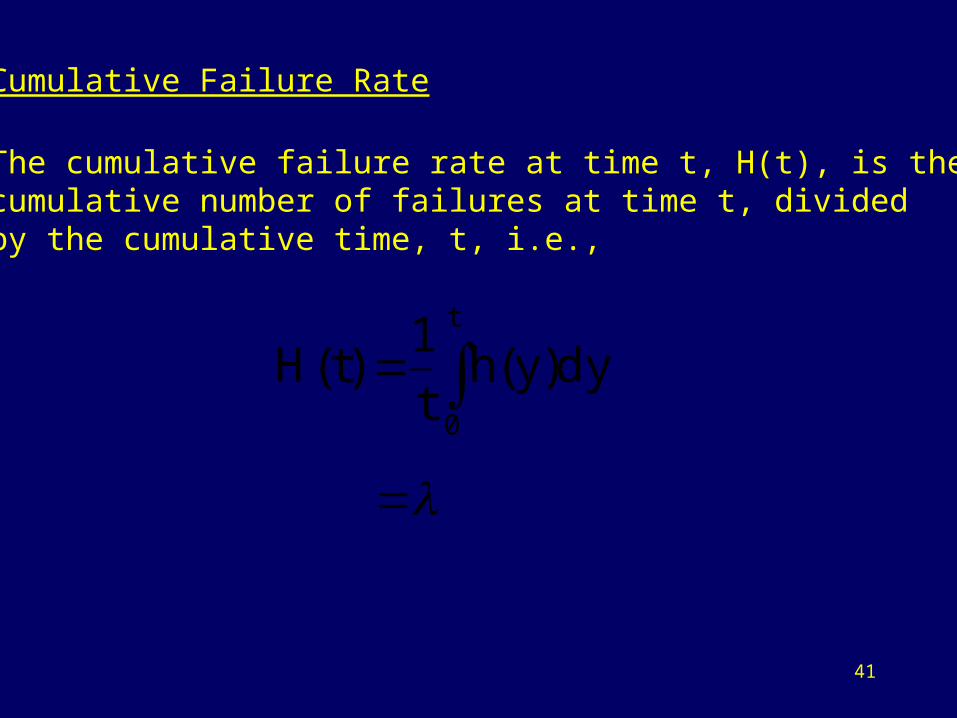
Cumulative Failure Rate
The cumulative failure rate at time t, H(t), is the cumulative number of failures at time t, divided by the cumulative time, t, i.e.,
t
0
dy)y(ht
1)t(H

42
The Reliability Function
The reliability of an item at time t may be expressed in terms of its failure rate at time t as follows:
where h(y) is the failure rate
t
0dy)y(ht
0
edy)y(hexp)t(R
tetR )(
43
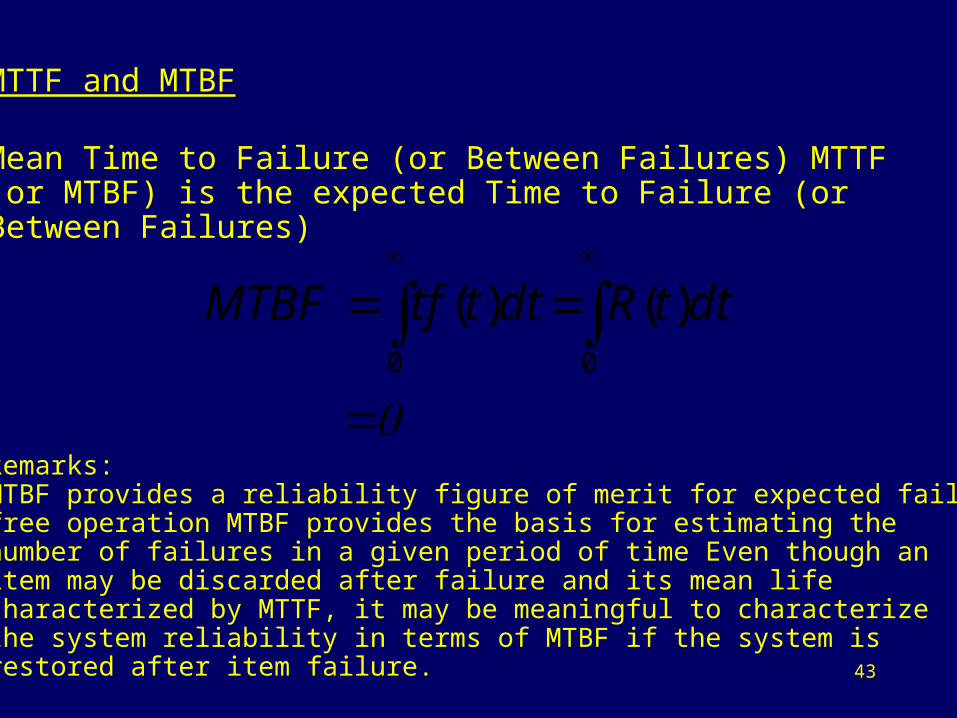
MTTF and MTBF
Mean Time to Failure (or Between Failures) MTTF (or MTBF) is the expected Time to Failure (or Between Failures)
Remarks:MTBF provides a reliability figure of merit for expected failure free operation MTBF provides the basis for estimating the number of failures in a given period of time Even though an item may be discarded after failure and its mean life characterized by MTTF, it may be meaningful to characterize the system reliability in terms of MTBF if the system is restored after item failure.
00
)()( dttRdtttfMTBF
44
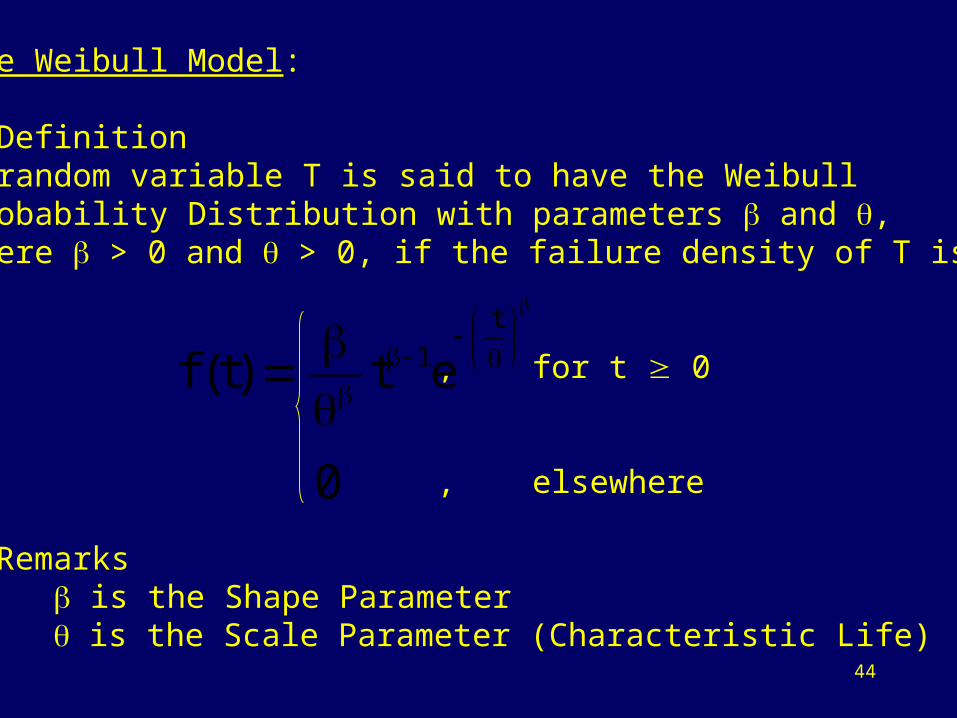
The Weibull Model:
• DefinitionA random variable T is said to have the Weibull Probability Distribution with parameters and , where > 0 and > 0, if the failure density of T is:
, for t 0
, elsewhere
• Remarks is the Shape Parameter is the Scale Parameter (Characteristic Life)
t
1et )t(f
0
45
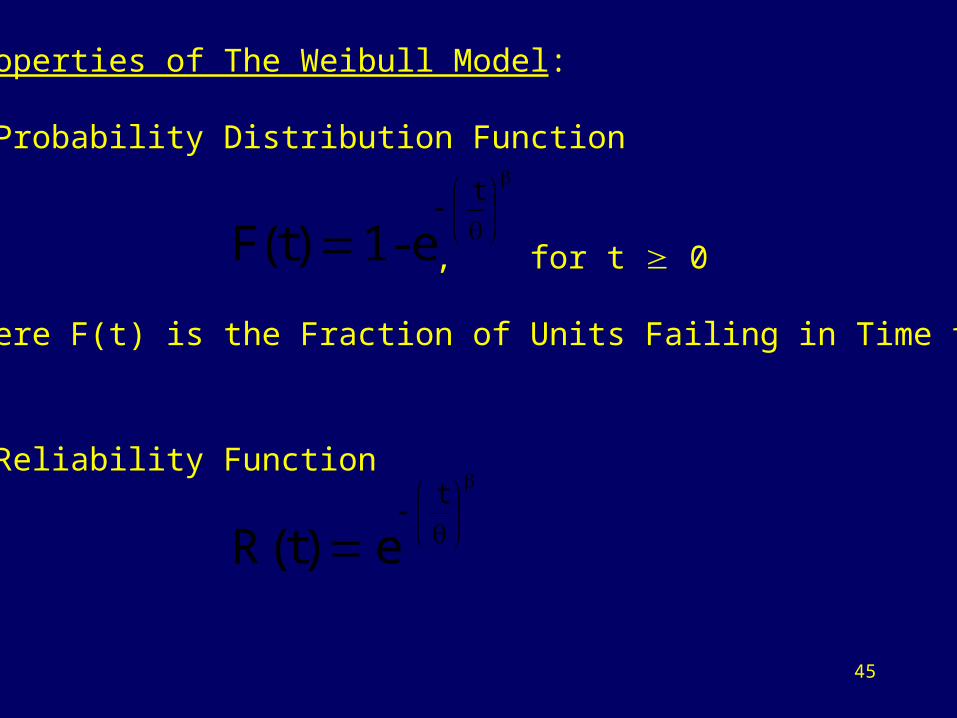
Properties of The Weibull Model:
• Probability Distribution Function
, for t 0
where F(t) is the Fraction of Units Failing in Time t
• Reliability Function
t
e-1 )t(F
t
e )t(R
46
The Weibull Model - Weibull Probability Paper (WPP):
Weibull Probability Paper links
http://perso.easynet.fr/~philimar/graphpapeng.htm
http://www.weibull.com/GPaper/index.htm
47
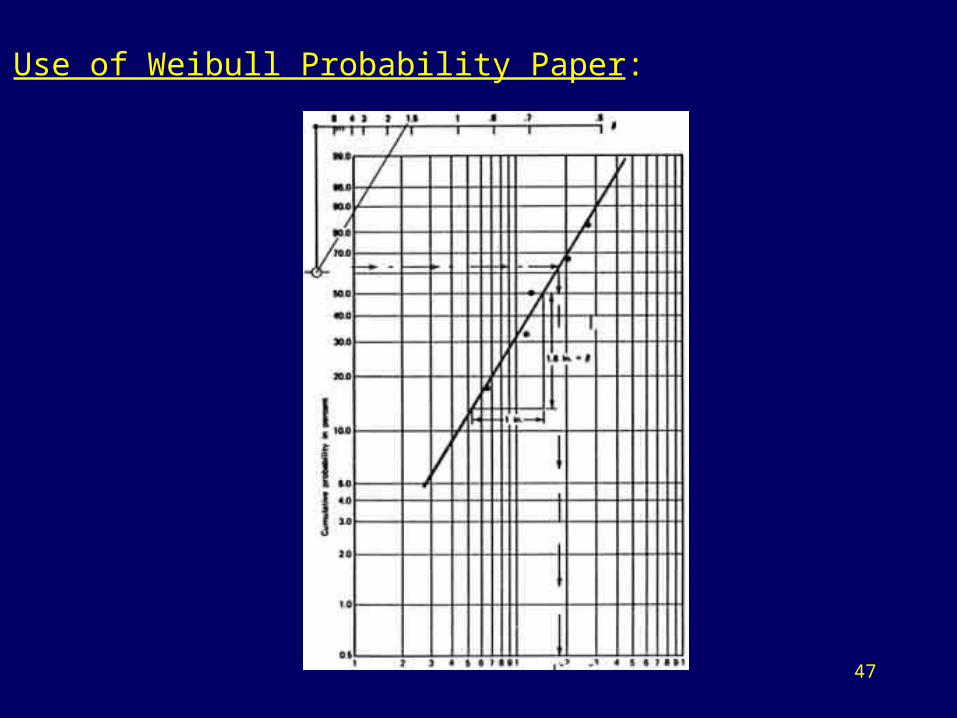
Use of Weibull Probability Paper:
48
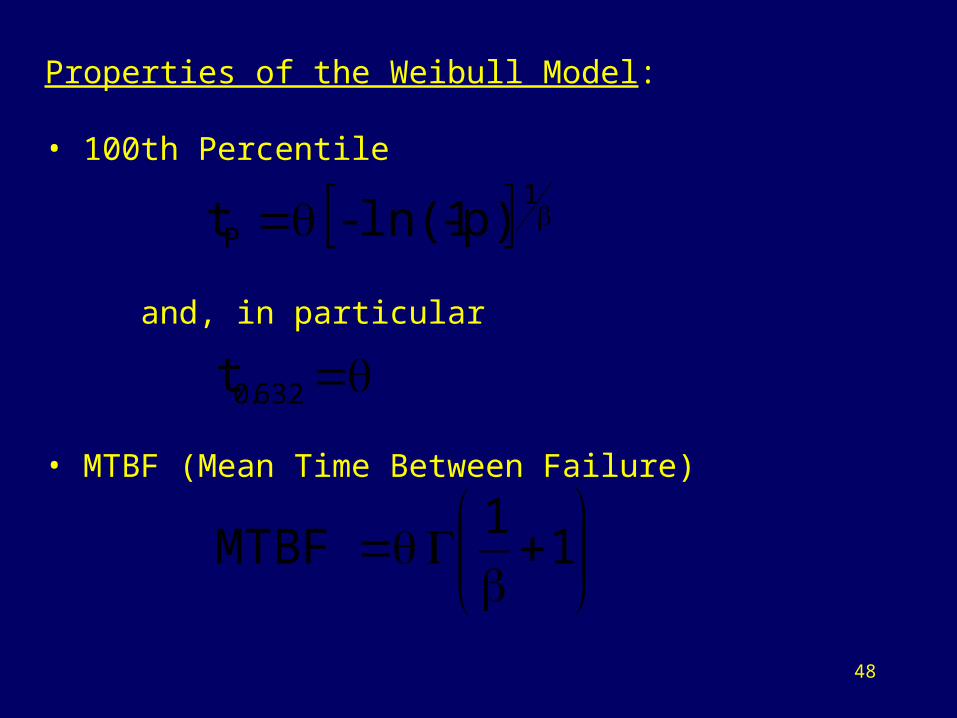
Properties of the Weibull Model:
• 100th Percentile
and, in particular
• MTBF (Mean Time Between Failure)
1
P p)-ln(1- t
t 632.0
1
1 MTBF
49
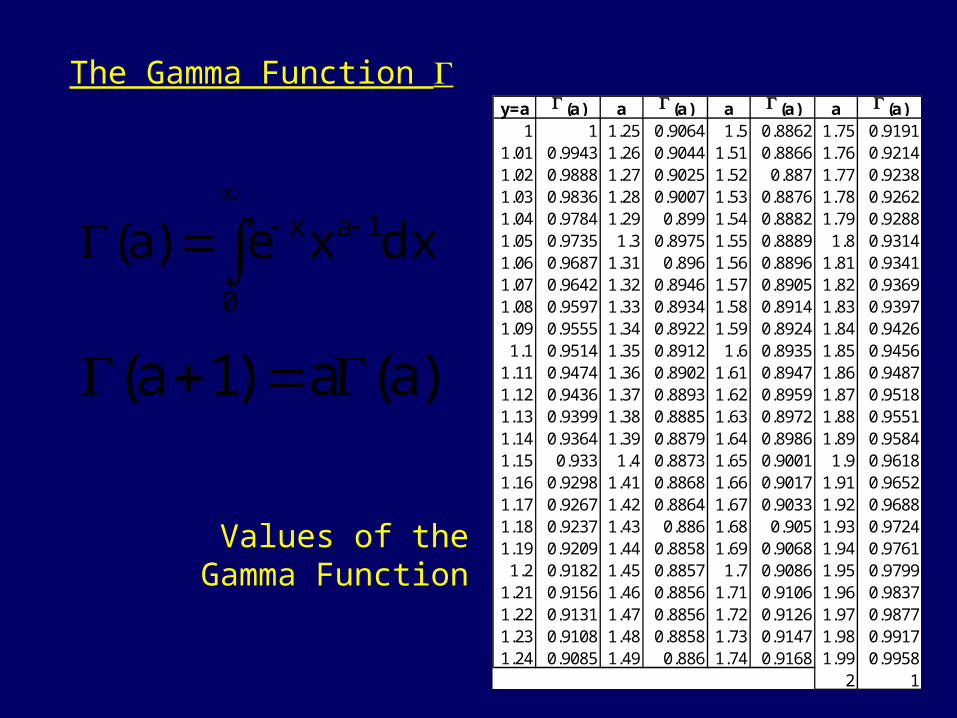
The Gamma Function
0
1ax dxxe)a(
)a(a)1a(
y=a (a) a (a) a (a) a (a)1 1 1.25 0.9064 1.5 0.8862 1.75 0.9191
1.01 0.9943 1.26 0.9044 1.51 0.8866 1.76 0.92141.02 0.9888 1.27 0.9025 1.52 0.887 1.77 0.92381.03 0.9836 1.28 0.9007 1.53 0.8876 1.78 0.92621.04 0.9784 1.29 0.899 1.54 0.8882 1.79 0.92881.05 0.9735 1.3 0.8975 1.55 0.8889 1.8 0.93141.06 0.9687 1.31 0.896 1.56 0.8896 1.81 0.93411.07 0.9642 1.32 0.8946 1.57 0.8905 1.82 0.93691.08 0.9597 1.33 0.8934 1.58 0.8914 1.83 0.93971.09 0.9555 1.34 0.8922 1.59 0.8924 1.84 0.94261.1 0.9514 1.35 0.8912 1.6 0.8935 1.85 0.94561.11 0.9474 1.36 0.8902 1.61 0.8947 1.86 0.94871.12 0.9436 1.37 0.8893 1.62 0.8959 1.87 0.95181.13 0.9399 1.38 0.8885 1.63 0.8972 1.88 0.95511.14 0.9364 1.39 0.8879 1.64 0.8986 1.89 0.95841.15 0.933 1.4 0.8873 1.65 0.9001 1.9 0.96181.16 0.9298 1.41 0.8868 1.66 0.9017 1.91 0.96521.17 0.9267 1.42 0.8864 1.67 0.9033 1.92 0.96881.18 0.9237 1.43 0.886 1.68 0.905 1.93 0.97241.19 0.9209 1.44 0.8858 1.69 0.9068 1.94 0.97611.2 0.9182 1.45 0.8857 1.7 0.9086 1.95 0.97991.21 0.9156 1.46 0.8856 1.71 0.9106 1.96 0.98371.22 0.9131 1.47 0.8856 1.72 0.9126 1.97 0.98771.23 0.9108 1.48 0.8858 1.73 0.9147 1.98 0.99171.24 0.9085 1.49 0.886 1.74 0.9168 1.99 0.9958
2 1
Values of theGamma Function
50
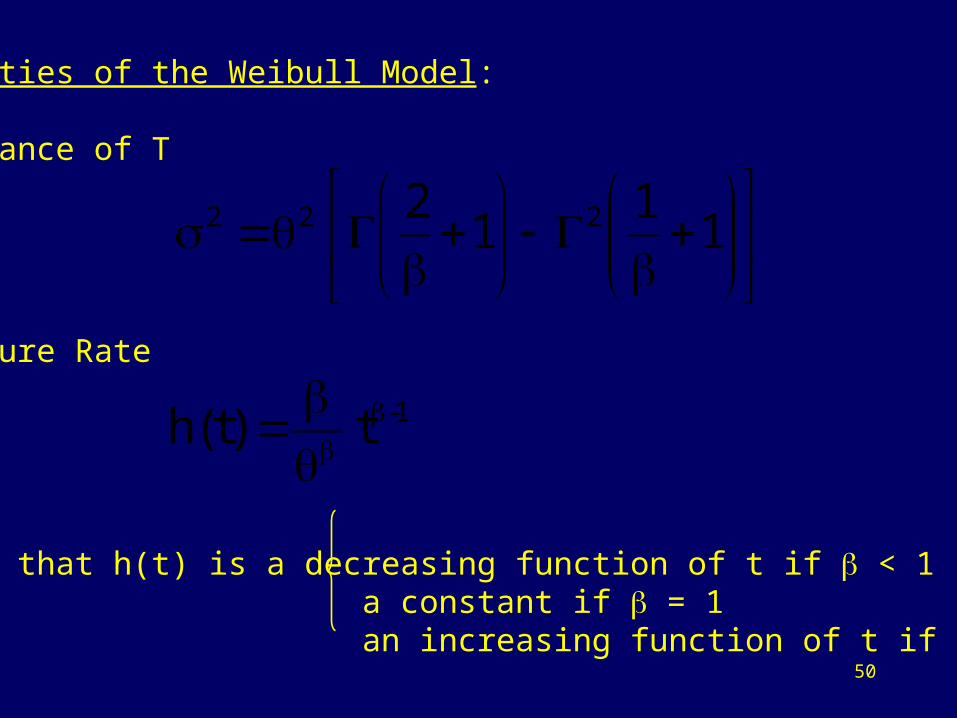
Properties of the Weibull Model:
• Variance of T
• Failure Rate
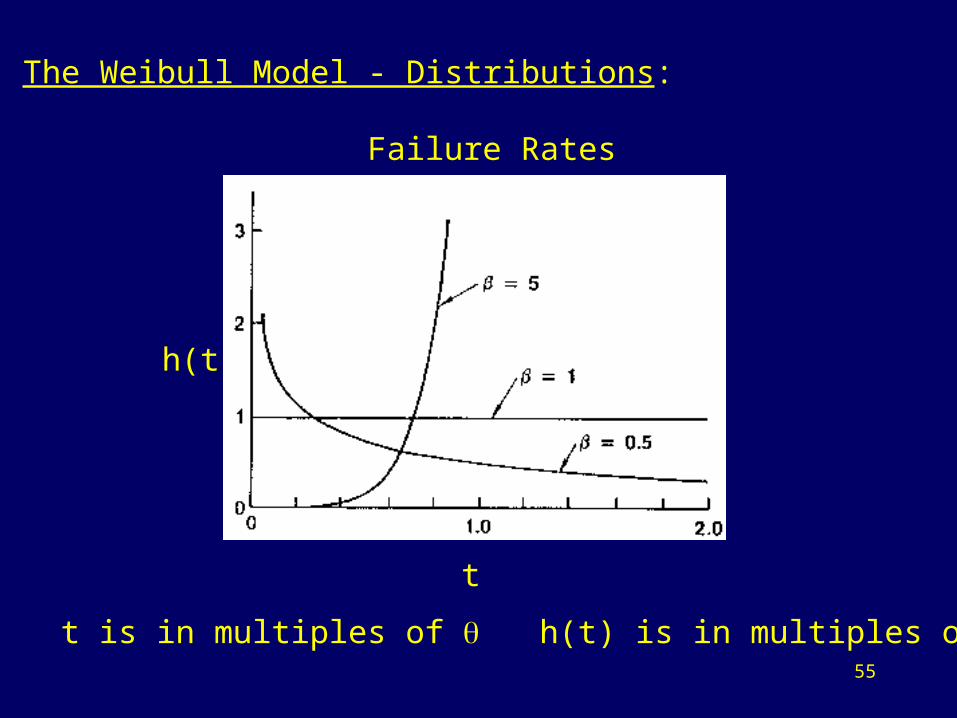
Notice that h(t) is a decreasing function of t if < 1a constant if = 1an increasing function of t if > 1
1
11
2 222
1-t )t(h

51
Properties of the Weibull Model:
• Cumulative Failure Rate
• The Instantaneous and Cumulative Failure Rates, h(t) and H(t), are straight lines on log-log paper.
• The Weibull Model with = 1 reduces to the Exponential Model.
• Any straight line on Weibull Probability paper is a Weibull Distribution with slope, and intercept, - ln , where the ordinate is ln{ln(1/[1-F(t)])} the abscissa is ln t.
)t(ht )t(H
1-
52
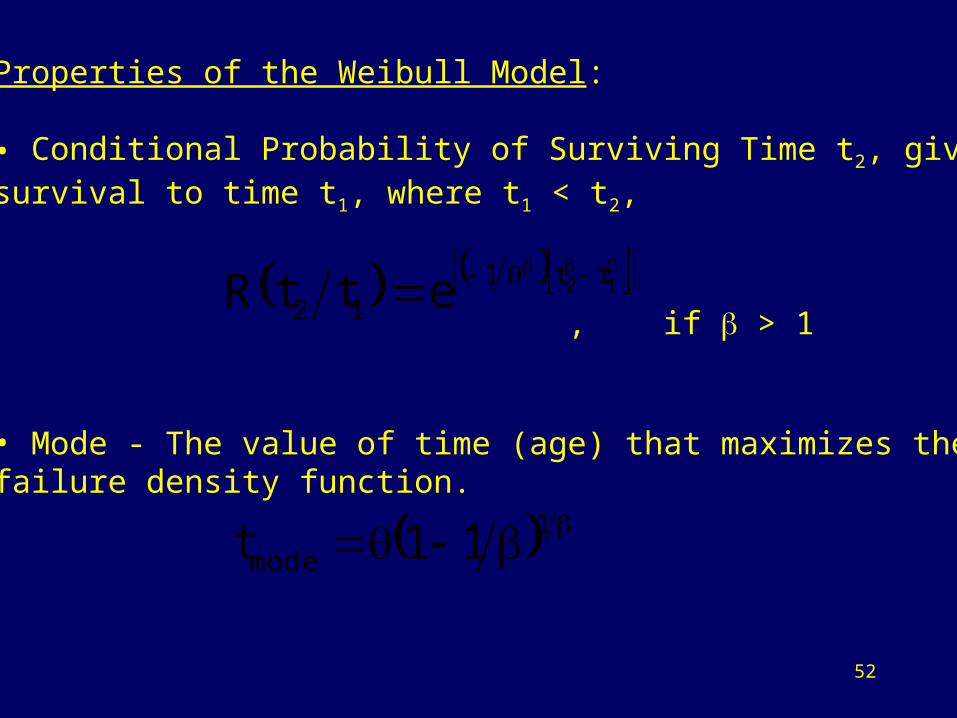
Properties of the Weibull Model:
• Conditional Probability of Surviving Time t2, given survival to time t1, where t1 < t2,
, if > 1
• Mode - The value of time (age) that maximizes the failure density function.
12 tt112 ettR
1emod 11t
53
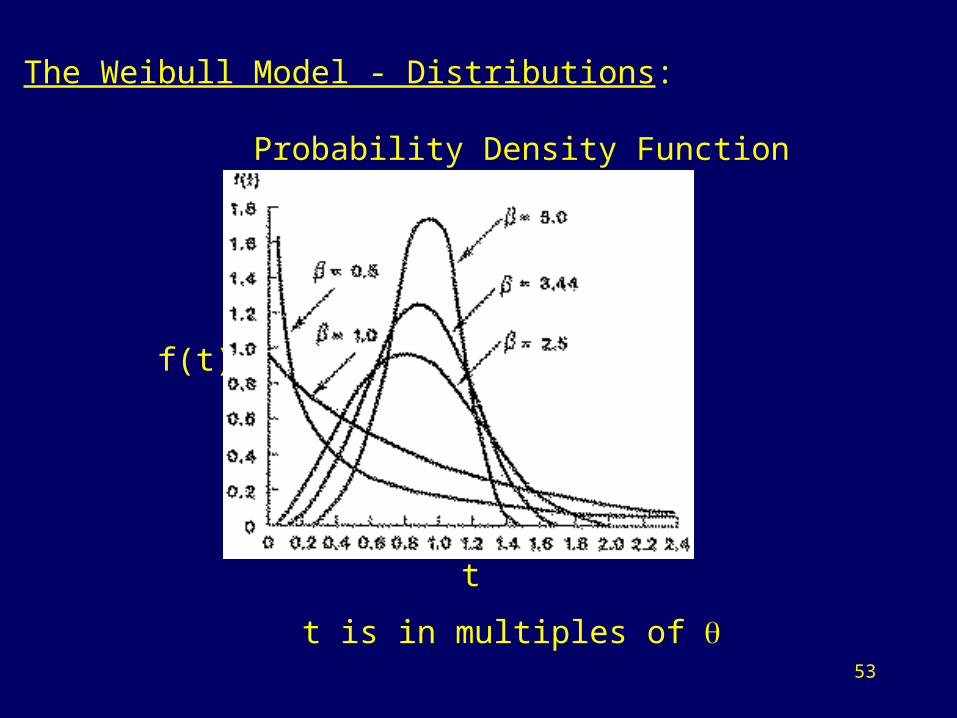
The Weibull Model - Distributions:
Probability Density Function
f(t)
t
t is in multiples of
54
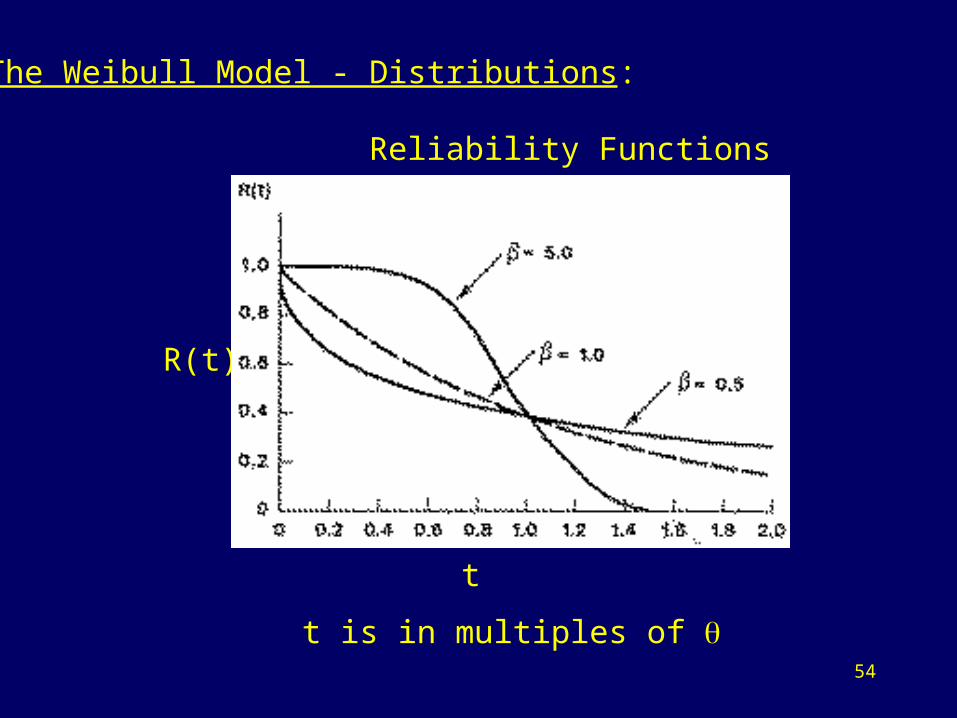
The Weibull Model - Distributions:
Reliability Functions
R(t)
t
t is in multiples of
55
The Weibull Model - Distributions:
Failure Rates
h(t)
t
t is in multiples of h(t) is in multiples of 1/
56
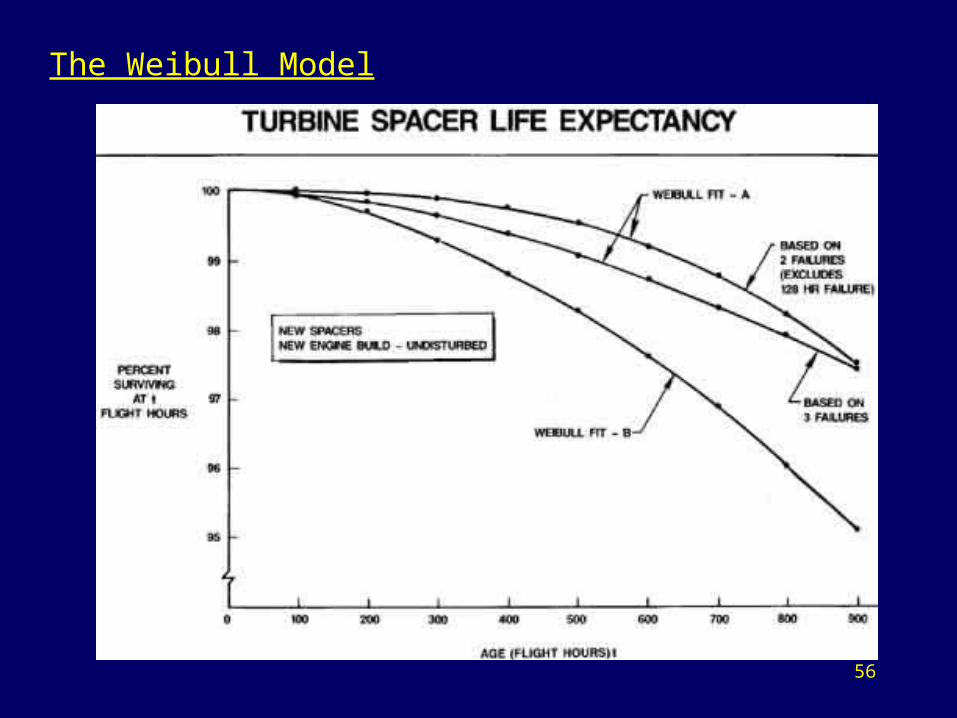
The Weibull Model