Embed Size (px)
Citation preview

1
LSSG Green Belt Training
Improve: How do we get there?

2
DMAIC Six Sigma - Improve
Develop Potential Solutions Identify potential solutions through
data analysis, brainstorming, benchmarking
Create Future State Develop and implement future
state process map and/or innovative solutions for the project
Evaluate and Mitigate Risk Analyze the impact of the solution
and error proof the process
Measure
Control
Analyze
Improve
Define
3
Agenda for Improve
1. Optimize Solutions (6 Sigma)2. Kaizen Events (Lean)
- Develop and Simulate Future State
3. Mistake-Proof New Process/Risk Management
4. Develop / Implement Pilot Plan5. Service Recovery
4
Six Sigma Improve Activities
Identify available relationshipsDetermine interactionsReduce list of X’s to a critical few
Determine optimum settings for X’sTools: Multivariate Analysis, DOE,
RSM/Optimization, and Simulation
Implement improvementVerify benefitsVerify measuring system
5
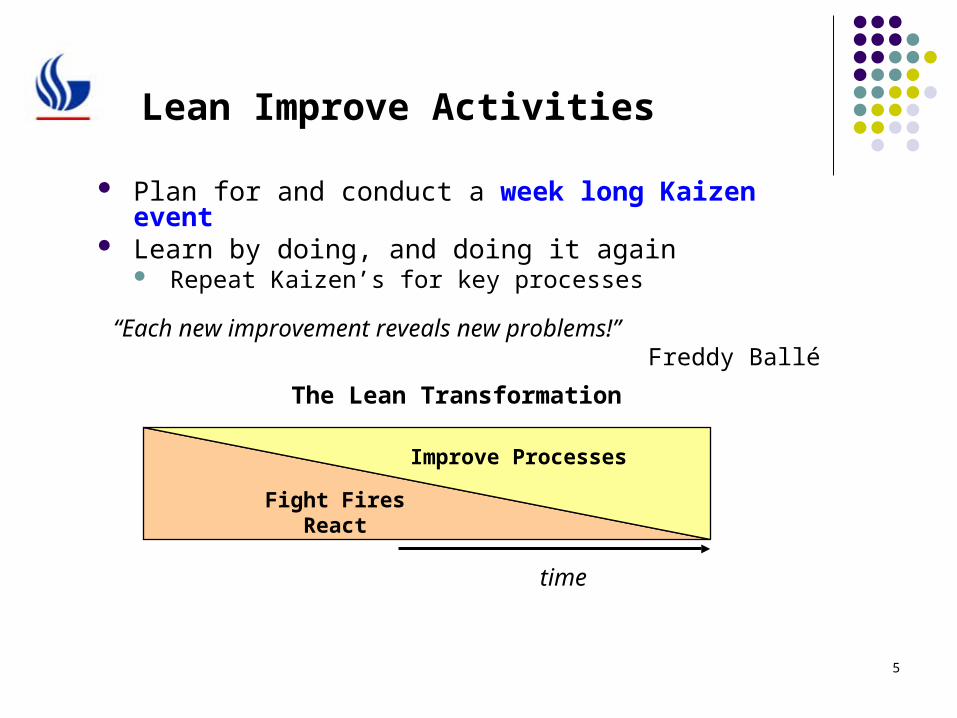
Lean Improve Activities
Plan for and conduct a week long Kaizen event Learn by doing, and doing it again
Repeat Kaizen’s for key processes
The Lean Transformation
Fight FiresReact
Improve Processes
time
“Each new improvement reveals new problems!”Freddy Ballé
6
Kaizen Events
The “Improve” process for Lean, where obvious waste has been identified
A team-based, 3-5 day event with no down time Cross-functional teams meet full-time (100% of
their time!) to solve a specific problem with pre-specified scope, metrics and goals
Results presented to management at the end of the week, with project completion in 30 days
Assumption is made that the team will have all the support and resources needed from management
7
Kaizen Events
Meet within 100 feet and “walk” the process to identify opportunities that are not working right and do not require detailed data to justify change
Count the number of steps within and between tasks; estimate task and handoff times; add improvement opportunities to Value Stream Map
Share “peak” experiences (“Appreciative Inquiry”) Develop hypothesis and test immediately to see if it works
Make quick and not so elegant changes Expect the unexpected!

8
Kaizen Event Team
The team should include the following: 6-8 people People who work in the process and will have to live with
the changes and at least one supervisor from this area Representatives from upstream and downstream processes Support personnel (IT, HR, etc.) One neutral observer Plus a neutral facilitator
9
Kaizen Event - Day 1
Travel - am Lean Classroom Training - pm
All participants required to attend half-day Lean training (Intro, waste, VSM, takt time, etc.)
Review plan for the week Clarify charter and scope; special needs; available data Clarify roles/form sub-teams Distribute materials/post white paper on walls
10
Kaizen Event - Day 2
Current State Mapping - am Sub-teams create current process map using large yellow post-its Label with key data; identify missing data Identify major opportunities for improvement Adjust project scope if required
Interview Employees/ Collect Data - pm Sub-teams time a sample of existing sub-processes (with stop-watches) Key personnel interviewed for knowledge of problems, suggestions for improvement,
and reasons why sample data collection may not be “normal” May be preceded by a tour of the entire process
11
Kaizen Event - Day 3
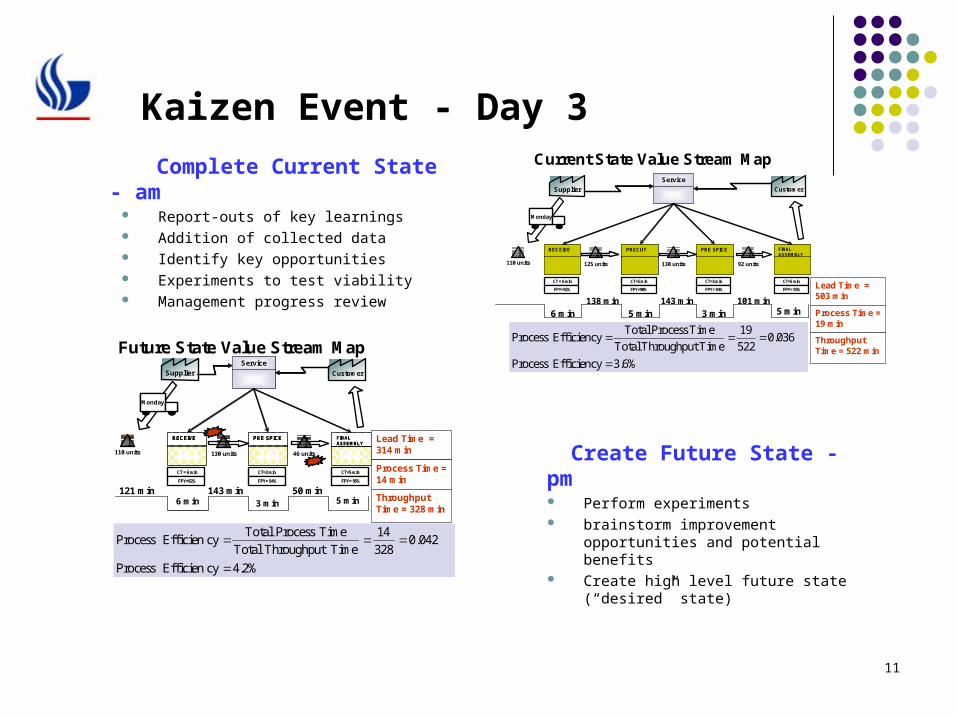
Complete Current State - am Report-outs of key learnings Addition of collected data Identify key opportunities Experiments to test viability Management progress review
Create Future State - pm Perform experiments brainstorm improvement opportunities
and potential benefits Create high level future state (“desired”
state)
Current State Value Stream Map
3 min5 min6 min
Supplier
I110 units
RECEIVERECEIVE PRECUTPRECUT PRE SPICEPRE SPICE
ServiceService
Customer
MondayMonday
I92 units
I130 units
CT = 6 min
FPY=92%
CT=5 min
FPY=90%
CT=3 min
FPY= 94%
FINAL ASSEMBLYFINAL ASSEMBLYI
125 units
CT=5 min
FPY= 95%
138 min 143 min 101 min
Lead Time = 503 min
Process Time = 19 min
5 min
Throughput Time = 522 min
3.6% cy EfficienProcess
036.0522
19
Time Throughput Total
Time ProcessTotal cy EfficienProcess
Future State Value Stream Map
3 min6 min
RECEIVERECEIVE PRE SPICEPRE SPICE
ServiceService
Customer
I46 units
I130 units
CT = 6 min
FPY=92%
CT=3 min
FPY= 94%
FINAL ASSEMBLYFINAL ASSEMBLY
CT=5 min
FPY= 95%
121 min 143 min 50 min
110 units
Supplier
I
MondayMonday
Lead Time = 314 min
Process Time = 14 min
5 min Throughput Time = 328 min
4.2% cy EfficienProcess
042.0328
14
Time Throughput Total
Time ProcessTotal cy EfficienProcess
12
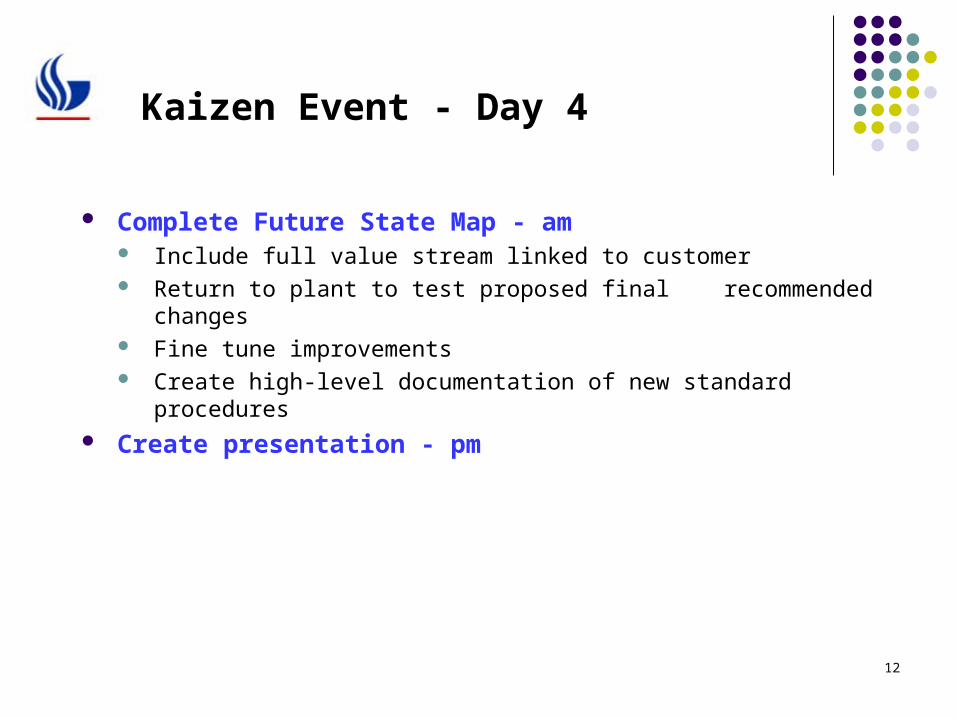
Kaizen Event - Day 4
Complete Future State Map - am Include full value stream linked to customer Return to plant to test proposed final recommended changes Fine tune improvements Create high-level documentation of new standard procedures
Create presentation - pm
13
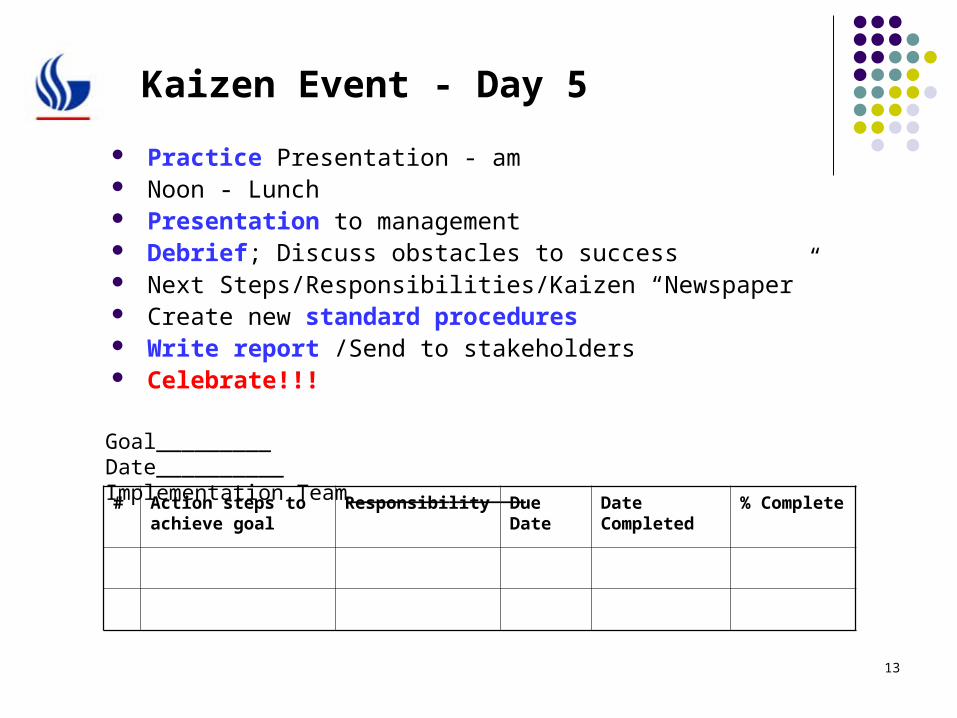
Kaizen Event - Day 5
Practice Presentation - am Noon - Lunch Presentation to management Debrief; Discuss obstacles to success Next Steps/Responsibilities/Kaizen “Newspaper” Create new standard procedures Write report /Send to stakeholders Celebrate!!!
# Action steps to achieve goal
Responsibility Due Date
Date Completed
% Complete
Goal_________ Date__________Implementation Team______________

14
Poka-Yokes: Product and Service Failsafing
Keeping a mistake from becoming a defect Prevention
Determine potential problems Develop fault-proof designs Create prevention plans
A proactive approach Detection
Develop signaling system/identification
Plan for quick response at operator level
Do root cause analysis; use “5 Whys”
Eliminate special causes
An extension of FMEA
15
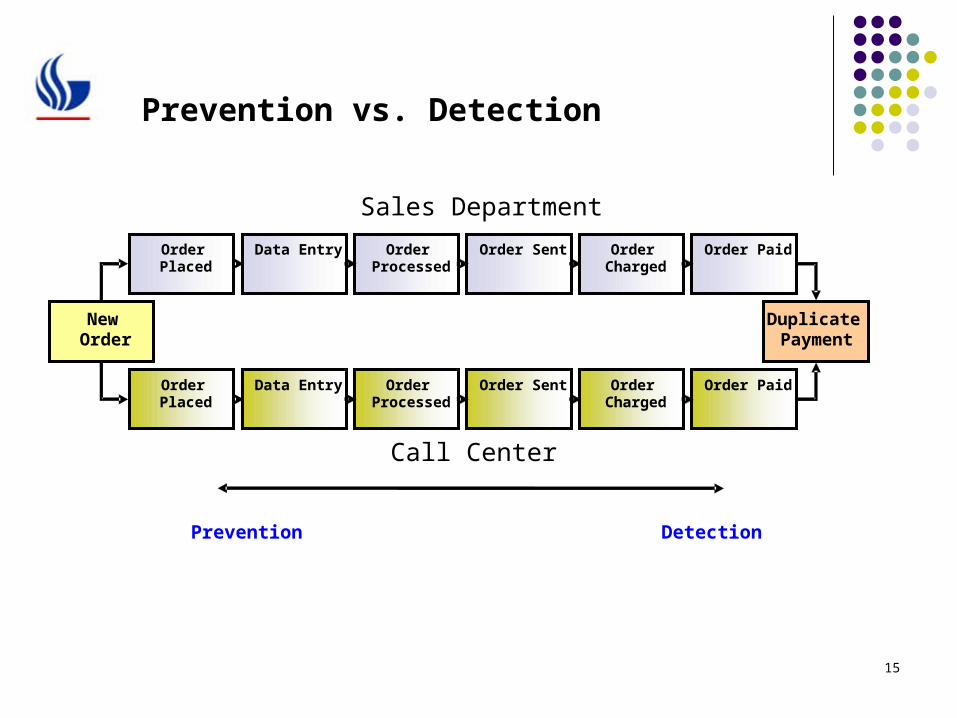
Prevention vs. Detection
Sales Department
Order PlacedOrder Placed
Data EntryData Entry Order Processed
Order Processed
Order SentOrder Sent Order Charged
Order Charged
Order PaidOrder Paid
Order PlacedOrder Placed
Data EntryData Entry Order Processed
Order Processed
Order SentOrder Sent Order Charged
Order Charged
Order PaidOrder Paid
Duplicate Payment
New OrderNew
Order
Call Center
Prevention Detection
16
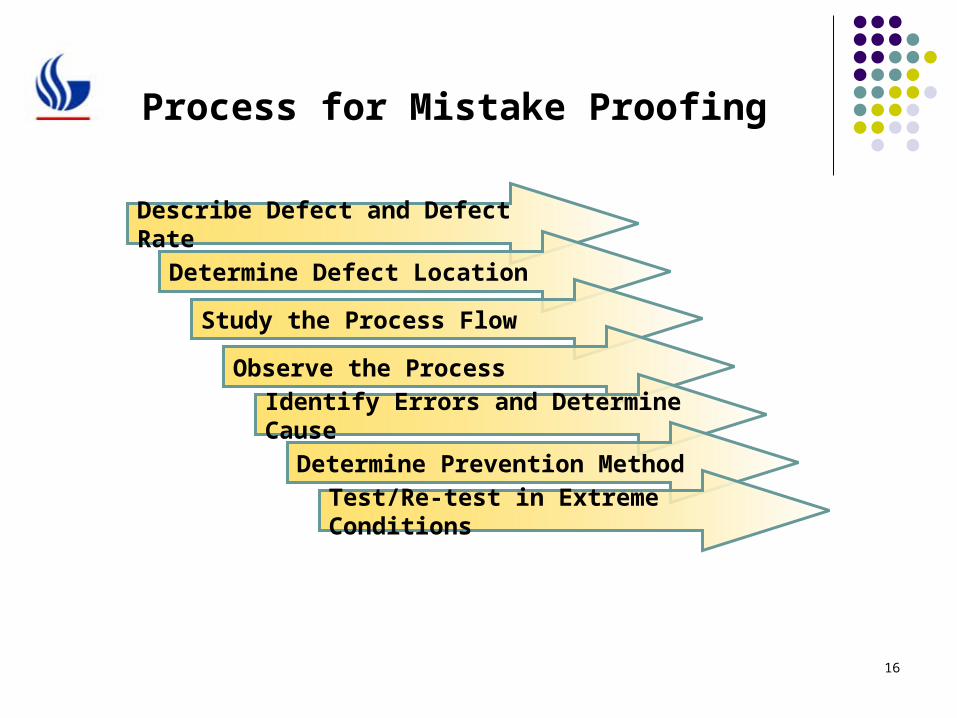
Process for Mistake Proofing
Describe Defect and Defect Rate
Determine Defect Location
Study the Process Flow
Observe the Process
Identify Errors and Determine Cause
Determine Prevention Method
Test/Re-test in Extreme Conditions
17
Service Recovery
A real-time response to a service failure Involves training front-line workers to immediately
respond to customer problems Involves identification of potential “incidents” and
determination of optimum response
Process Improvement can take too long. What do we do in the meantime?
18
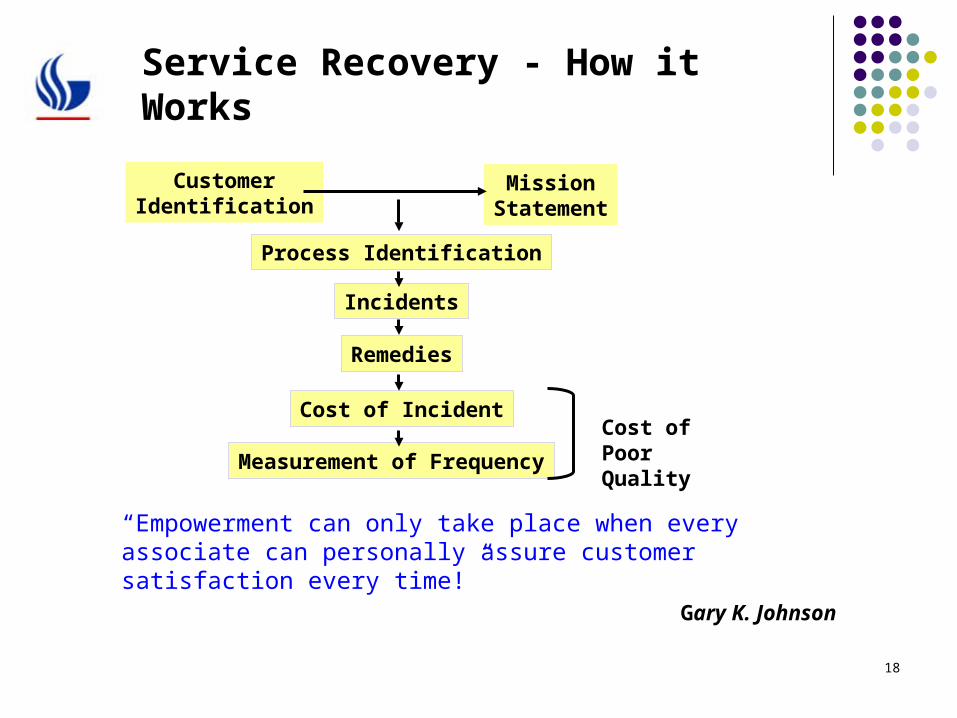
Service Recovery - How it Works
“Empowerment can only take place when every associate can personally assure customer satisfaction every time!”
Gary K. Johnson
Process Identification
Incidents
Remedies
Cost of Incident
Measurement of Frequency
CustomerIdentification
MissionStatement
Cost ofPoor Quality