Embed Size (px)
Citation preview
Page 1 of 33
Machine Learning and Statistical Approaches for Classification of Risk of 1
Coronary Artery Disease using Plasma Cytokines. 2
Seema Singh Saharan1, Pankaj Nagar2, Kate Townsend Creasy3, Eveline O. Stock4, James Feng5, 3
Mary J. Malloy6, John P. Kane 7. 4
Abstract 5
Background 6
As per the 2017 WHO fact sheet, Coronary Artery Disease (CAD) is the primary cause of death in the world, and 7
accounts for 31% of total fatalities. The unprecedented 17.6 million deaths caused by CAD in 2016 underscores 8
the urgent need to facilitate proactive and accelerated pre-emptive diagnosis. The current research took an 9
innovative approach to implement K Nearest Neighbor (k-NN) and ensemble Random Forest Machine Learning 10
algorithms to achieve a targeted “At Risk” Coronary Artery Disease (CAD) classification. To ensure better 11
generalizability mechanisms like k-fold cross validation, hyperparameter tuning and statistical significance 12
(p<.05) were employed. The classification is also unique from the aspect of incorporating 35 cytokines as 13
biomarkers within the predictive feature space of Machine Learning algorithms. 14
Results 15
A total of seven classifiers were developed, with four built using 35 cytokine predictive features and three built 16
using 9 cytokines statistically significant (p<.05) across CAD versus Control groups determined by independent 17
two sample t tests. The best prediction accuracy of 100% was achieved by Random Forest ensemble using nine 18
significant cytokines. Significant cytokines were selected to decrease the noise level of the data, allowing for 19
better classification. 20
Additionally, from the bio-medical perspective, it was enlightening to empirically observe the interplay of the 21
cytokines. Compared to Controls, moderately correlated (correlation coefficient r=.5) cytokines “IL1-β”, “IL-10” 22
1 M.Phil., Corresponding Author, Research Scholar, Department of Statistics, University of Rajasthan, Jaipur, Voluntary Data Scientist UCSF Kane Lab, San Francisco, Part Time Lecturer, UC Berkeley Extension.
Email: [email protected] , [email protected] 2 Ph.D., Associate Professor, Department of Statistics, University of Rajasthan, Jaipur. Email: [email protected]
3 Ph.D., Cardiovascular Research Institute, Department of Medicine, University of California, San Francisco. Email: [email protected]
4 M.D., Cardiovascular Research Institute, Department of Medicine, University of California, San Francisco. Email: [email protected]
5 B.S., Cardiovascular Research Institute, Department of Medicine, University of California, San Francisco. Email: [email protected]
6 M.D., Cardiovascular Research Institute, Departments of Medicine and Pediatrics, University of California, San Francisco. Email: [email protected]
7 M.D., Ph.D. Cardiovascular Research Institute, Department of Medicine, Department of Biochemistry and Biophysics,
University of California, San Francisco.
Email: [email protected]
Page 2 of 33
were both significant and down regulated in the CAD group. Both cytokines were primarily responsible for the 23
Random forest generated 100% classification. In conjunction with Machine Learning (ML) algorithms, the 24
traditional statistical techniques like correlation and t tests were leveraged to obtain insights that brought forth a 25
role for cytokines in the investigation of CAD risk. 26
Conclusions 27
Presently, as large-scale efforts are gaining momentum to enable early detection of individuals at risk for CAD 28
by the application of novel and powerful ML algorithms, detection can be further improved by incorporating 29
additional biomarkers. Investigation of emerging role of cytokines in CAD can materially enhance the detection 30
of risk and the discovery of mechanisms of disease that can lead to new therapeutic approaches. 31
Keywords 32
CAD, Machine Learning, k-NN, Random Forest, Predictive Accuracy, Distance Metrics, k fold Cross Validation, 33
Classification, Plasma cytokines. 34
Background 35
Introduction 36
Cardiovascular disease is the leading cause of death in Europe and North America [1] [2] which underscores the 37
need for incorporation of novel emerging risk factors to improve prediction of risk, enabling early diagnosis and 38
personalized management. The power of Machine Learning algorithms like k-NN, Random Forest can be 39
harnessed to extract patterns to inform health related decision making. This paper expatiates the exploratory 40
juxtaposition of k-NN and Random Forest by varying a broad spectrum of tuning parameters and incorporating 41
statistical significance in conjunction with k-fold cross validation, a powerful resampling technique that 42
overcomes the issue of overfitting, ensuring better generalizability of the model [3]. Cytokines were considered 43
significant by an independent two samples t test (p<.05) between CAD versus Control groups. 44
We used plasma cytokines as novel biomarkers to improve classification in patients with or without clinical 45
coronary disease. This approach promises to identify mechanisms of disease, cytokine targets not previously 46
recognized, and to improve early detection of individuals at risk. Cytokines are proteins generated by the immune 47
system in response to cell signals. They act as messengers for other cells by targeted activation of receptors and 48
trigger downstream signaling resulting in pro-inflammatory or anti-inflammatory response. Common cytokines 49
include lymphokines, chemokines, interferons, interleukins etc. that respond to environmental signals triggering 50
pro or anti-inflammatory cascades [4] [5] [6]. Cytokines are known to be involved in the development and 51
progression of CAD [7]. 52
Review of Related Work 53
Page 3 of 33
There are very few prior studies that have used ML algorithms to differentiate CAD versus Control by using 54
cytokines [8] [5] as predictive features emphasizing the importance of the current study. k-NN is very popular 55
within the landscape of ML algorithms due to its interpretability and distance metric options for measuring the 56
similarity within predictor features resulting in the target feature classification. This algorithm has been used 57
across a broad spectrum of domain areas including medical diagnosis of which some prominent research has been 58
discussed here. Random Forest [3], an ensemble algorithm though not as interpretable as k-NN is also a very 59
innovative technique that has been empirically proven to generate high predictive accuracy. 60
Yu, Linghua, et al. [6] studied hand, foot, and mouth disease (HFMD) prevalently found in the Asia-Pacific 61
regions. The research participants implemented Random Forest to distinguish the HFMD disease group from the 62
controls using 26 significant cytokines as predictor features. The findings of the research showcased correlation 63
between enteroviral infection, genotype, and clinical presentation. The Random Forest algorithm achieved a final 64
AUC value of 91, indicative of its excellent partition efficacy. 65
Struck, et al. [9] employed cytokine predictors, using Random Forest to differentiate malaria from a blood stream 66
bacterial infection. The 7-15 cytokines used for the task were selected using Machine Learning classification 67
techniques. The researchers used cytokines to offset the deficiency of a rapid malaria test not being able to 68
differentiate serious malaria infection from asymptomatic malaria. This study exhibited a high disease status 69
prediction accuracy of 88% that could provide directives to develop new point-of-care tests in Sub-Saharan Africa. 70
Kandhasamy et al [10] tackles the early prediction of diabetes, a commonly occurring disease in the contemporary 71
context using important machine learning classifiers like Decision trees, k-NN, Random Forest and Support 72
Vector Machines. Additionally, improved efficacy of non-noisy versus noisy data is also demonstrated by using 73
performance metrics like Prediction Accuracy, Sensitivity and Specificity. To generate a more consistent dataset, 74
missing values were replaced by the median value of the attribute across all observations. 75
Jabbar, Akhil, et al. [11] used an innovative approach for diagnosing heart disease, by combining k-NN algorithm 76
with a genetic algorithm. The research empirically proved that the inclusion of a genetic algorithm within the 77
folds of k-NN enhances the prediction accuracy thereby providing an inventive diagnostic approach. 78
Enriko, Ketut & Suryanegara et al [12] experimented and compared Machine Learning algorithms such as Naïve 79
Bayes, Decision Tree and k-NN by only applying 8 biomarker features instead of the recommended 13 features. 80
The 8 features used were chosen because they were simple to measure and provided a better prediction accuracy 81
in the context of k-NN compared to Naïve Bayes and Decision Trees. The usage of multiple algorithms provided 82
a comparative analysis with regards to evaluation measurement like prediction accuracy. 83
Faizal, Edi, and Hamdani Hamdani. [13] extracted the early diagnosis of CAD based on feature similarity with 84
predictive attributes like age, gender, and risk factor symptoms. Specifically, the classification technique used for 85
Page 4 of 33
this research was the k-NN weighted via the Minkowski distance. To reduce the chance of error in terms of 86
differentiation, it was decided that if the similarity index was less than .80, the diagnosis would be determined 87
with the consultation of an expert. The performance metrics like Prediction Accuracy and Sensitivity obtained by 88
the application of this methodology were high. 89
Saini, Indu, et al. [14] studied the usage of k-NN for the detection of QRS complexes in ECG related data. The 90
authors showed that prediction accuracy primarily depended on the value of k and the distance metric used for 91
classification. Running experiments, proved that Euclidean distance and a value of k=3 in conjunction with 5-92
fold cross validation generated the best k-NN classifier. 93
The current study endeavored to improve and extend the techniques reviewed in the aforementioned studies. The 94
objective of minimizing and downplaying noisy data were the motivation behind the current research’s usage of 95
significant cytokines as well as that of weighted k-NN. The usage and comparison of multiple algorithms has 96
proven an effective way to obtain a holistic view with regards to classification. The current research incorporates 97
this comparison paradigm to present the results. The empirical proof of enhanced performance by the usage of 98
hyperparameter tuning and cross fold validation [15] for Random Forest and k-NN directed the in-depth 99
exploration conducted in the current research effort. Fine tuning hyperparameters in general has proven to be an 100
effective optimization technique. 101
Methods 102
The data set is composed of biomarker levels for 104 individuals. Thirty-five cytokine biomarkers were measured 103
for each individual in addition to the final target feature attribute which categorizes whether the individual belongs 104
to the CAD (39 individuals) or the Control (65 individuals) group. The feature space in the model incorporates 35 105
cytokine biomarkers that helped quantify the similarity and finally the classification of CAD or Control. 106
This study was approved by the UCSF Institutional Review Board Committee on Human Research and conducted 107
in accordance with the principles of the Declaration of Helsinki. All subjects provided written informed consent 108
prior to participation. For this study, blood samples were collected from male (43.3%) and females subjects, ages 109
18 to 65 (median age = 42) with diagnosed CAD and age, sex-matched controls. CAD subjects had a previous 110
history of myocardial infarction, angiographically diagnosed CAD, or previous coronary artery bypass graft 111
surgery. Control subjects had no history or clinical evidence of CAD. Exclusion criteria included current or prior 112
treatment for autoimmune disease and/or cancer, diabetes diagnosis, tobacco use, NSAID use prior to blood 113
collection, post-menopausal women, and age over 65. None of the subjects were receiving lipid lowering 114
medications. Blood was drawn into EDTA collection tubes and immediately stored on ice. Samples were 115
centrifuged to separate plasma which was aliquoted and stored at -80° C until use. Samples were thawed on ice 116
and assayed for cytokine content with a human 35-plex ELISA assay (ThermoFisher/Life Sciences) according to 117
Page 5 of 33
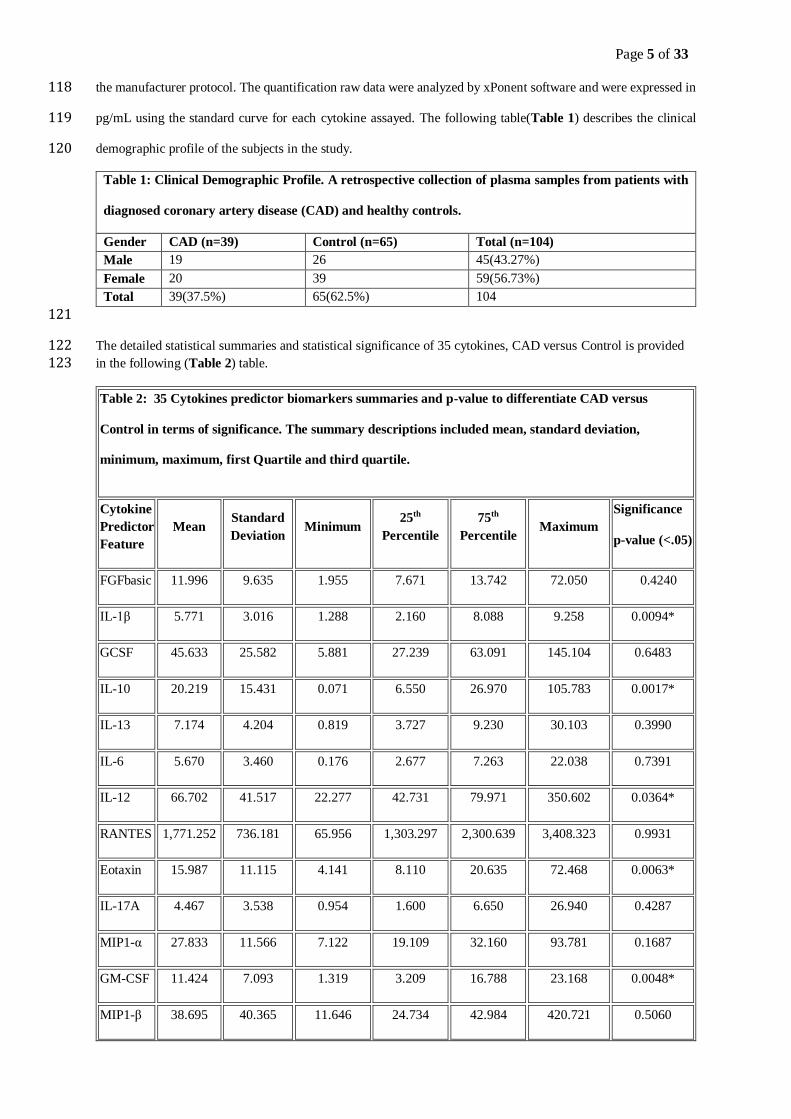
the manufacturer protocol. The quantification raw data were analyzed by xPonent software and were expressed in 118
pg/mL using the standard curve for each cytokine assayed. The following table(Table 1) describes the clinical 119
demographic profile of the subjects in the study. 120
Table 1: Clinical Demographic Profile. A retrospective collection of plasma samples from patients with
diagnosed coronary artery disease (CAD) and healthy controls.
Gender CAD (n=39) Control (n=65) Total (n=104)
Male 19 26 45(43.27%)
Female 20 39 59(56.73%)
Total 39(37.5%) 65(62.5%) 104
121
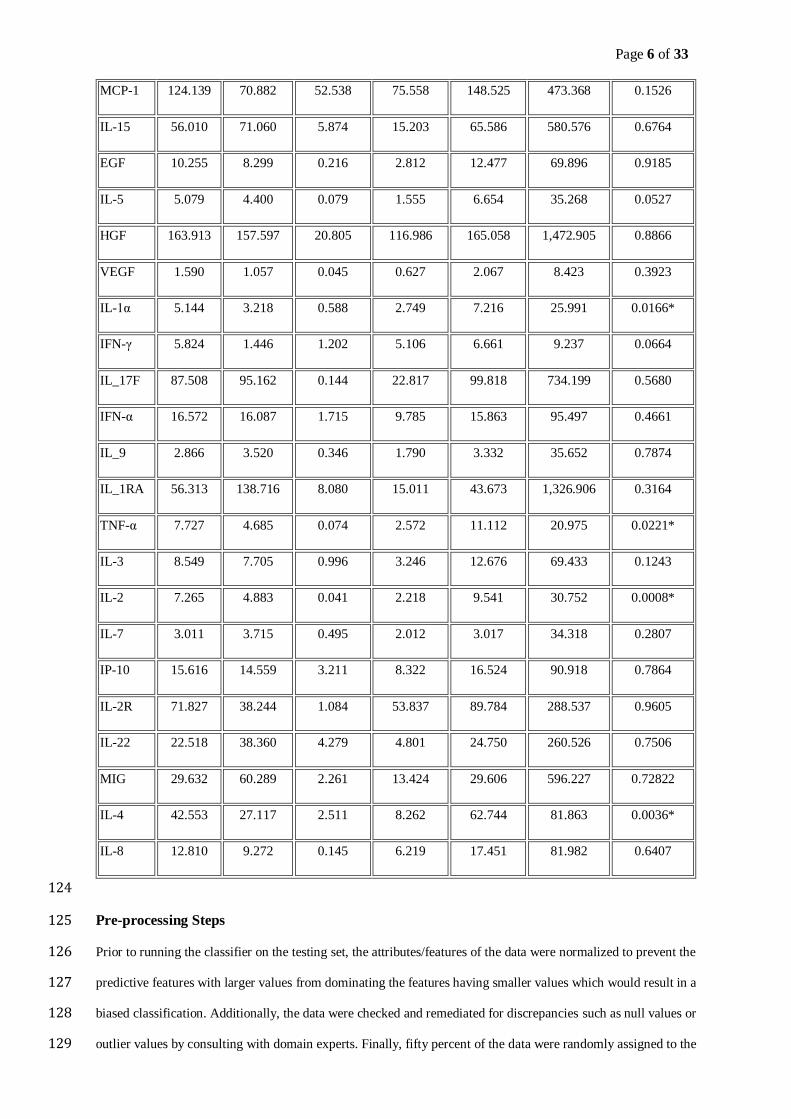
The detailed statistical summaries and statistical significance of 35 cytokines, CAD versus Control is provided 122 in the following (Table 2) table. 123
Table 2: 35 Cytokines predictor biomarkers summaries and p-value to differentiate CAD versus
Control in terms of significance. The summary descriptions included mean, standard deviation,
minimum, maximum, first Quartile and third quartile.
Cytokine
Predictor
Feature
Mean Standard
Deviation Minimum
25th
Percentile
75th
Percentile Maximum
Significance
p-value (<.05)
FGFbasic 11.996 9.635 1.955 7.671 13.742 72.050 0.4240
IL-1β 5.771 3.016 1.288 2.160 8.088 9.258 0.0094*
GCSF 45.633 25.582 5.881 27.239 63.091 145.104 0.6483
IL-10 20.219 15.431 0.071 6.550 26.970 105.783 0.0017*
IL-13 7.174 4.204 0.819 3.727 9.230 30.103 0.3990
IL-6 5.670 3.460 0.176 2.677 7.263 22.038 0.7391
IL-12 66.702 41.517 22.277 42.731 79.971 350.602 0.0364*
RANTES 1,771.252 736.181 65.956 1,303.297 2,300.639 3,408.323 0.9931
Eotaxin 15.987 11.115 4.141 8.110 20.635 72.468 0.0063*
IL-17A 4.467 3.538 0.954 1.600 6.650 26.940 0.4287
MIP1-α 27.833 11.566 7.122 19.109 32.160 93.781 0.1687
GM-CSF 11.424 7.093 1.319 3.209 16.788 23.168 0.0048*
MIP1-β 38.695 40.365 11.646 24.734 42.984 420.721 0.5060
Page 6 of 33
MCP-1 124.139 70.882 52.538 75.558 148.525 473.368 0.1526
IL-15 56.010 71.060 5.874 15.203 65.586 580.576 0.6764
EGF 10.255 8.299 0.216 2.812 12.477 69.896 0.9185
IL-5 5.079 4.400 0.079 1.555 6.654 35.268 0.0527
HGF 163.913 157.597 20.805 116.986 165.058 1,472.905 0.8866
VEGF 1.590 1.057 0.045 0.627 2.067 8.423 0.3923
IL-1α 5.144 3.218 0.588 2.749 7.216 25.991 0.0166*
IFN-γ 5.824 1.446 1.202 5.106 6.661 9.237 0.0664
IL_17F 87.508 95.162 0.144 22.817 99.818 734.199 0.5680
IFN-α 16.572 16.087 1.715 9.785 15.863 95.497 0.4661
IL_9 2.866 3.520 0.346 1.790 3.332 35.652 0.7874
IL_1RA 56.313 138.716 8.080 15.011 43.673 1,326.906 0.3164
TNF-α 7.727 4.685 0.074 2.572 11.112 20.975 0.0221*
IL-3 8.549 7.705 0.996 3.246 12.676 69.433 0.1243
IL-2 7.265 4.883 0.041 2.218 9.541 30.752 0.0008*
IL-7 3.011 3.715 0.495 2.012 3.017 34.318 0.2807
IP-10 15.616 14.559 3.211 8.322 16.524 90.918 0.7864
IL-2R 71.827 38.244 1.084 53.837 89.784 288.537 0.9605
IL-22 22.518 38.360 4.279 4.801 24.750 260.526 0.7506
MIG 29.632 60.289 2.261 13.424 29.606 596.227 0.72822
IL-4 42.553 27.117 2.511 8.262 62.744 81.863 0.0036*
IL-8 12.810 9.272 0.145 6.219 17.451 81.982 0.6407
124
Pre-processing Steps 125
Prior to running the classifier on the testing set, the attributes/features of the data were normalized to prevent the 126
predictive features with larger values from dominating the features having smaller values which would result in a 127
biased classification. Additionally, the data were checked and remediated for discrepancies such as null values or 128
outlier values by consulting with domain experts. Finally, fifty percent of the data were randomly assigned to the 129
Page 7 of 33
training and the rest to the test set to eliminate selection bias. Given the small data set (n=104), the 50% split was 130
decided upon after a series of test runs to achieve the best prediction accuracy 131
k-NN K-Nearest Neighbor 132
k-NN, a supervised ML algorithm was initially proposed by Fix and Hodges [16]. It is based upon the similarity 133
paradigm, indicating that the classification of unlabeled examples are differentiated by means of distance metrics 134
and are finally ascribed the class of k(k ≥ 1) nearest neighbors. k-NN, by the virtue of being non-parametric in 135
nature does not make assumptions regarding the underlying data distribution, therefore making it less restrictive 136
and a more powerful classifier as compared to other popular ML algorithms. k-NN is a versatile algorithm that 137
can be used for classification as well as prediction via Regression. 138
k-NN is a lazy learner therefore does not create a learning model, but instead every new testing instance is iterated 139
through the training data to decide upon its class label. An increase of data instances causes a higher 140
computational complexity due to the lack of the abstraction phase. k-NN also has the disadvantage that it does not 141
predict well for data that are noisy or have outliers. Despite the caveats, the availability of computational power 142
in contemporary context as well as the hyper-parameters that can be tuned for k-NN, allow it to be leveraged to 143
adequately classify testing examples in a reasonable amount of time. 144
In the past as well as in the present, a plethora of complex medical research has applied k-NN [12] to achieve 145
optimal diagnostic prediction. k-NN is prevalently used for detecting genetic diseases, conducting facial 146
recognition, and generating music recommendation . The choice of this algorithm stems from the fact that even 147
though classification can be slow, k-NN is fundamentally a simplistic algorithm which typically uses numeric 148
predictor features, is easily comprehendible and outperforms many of the more complex ML algorithms. 149
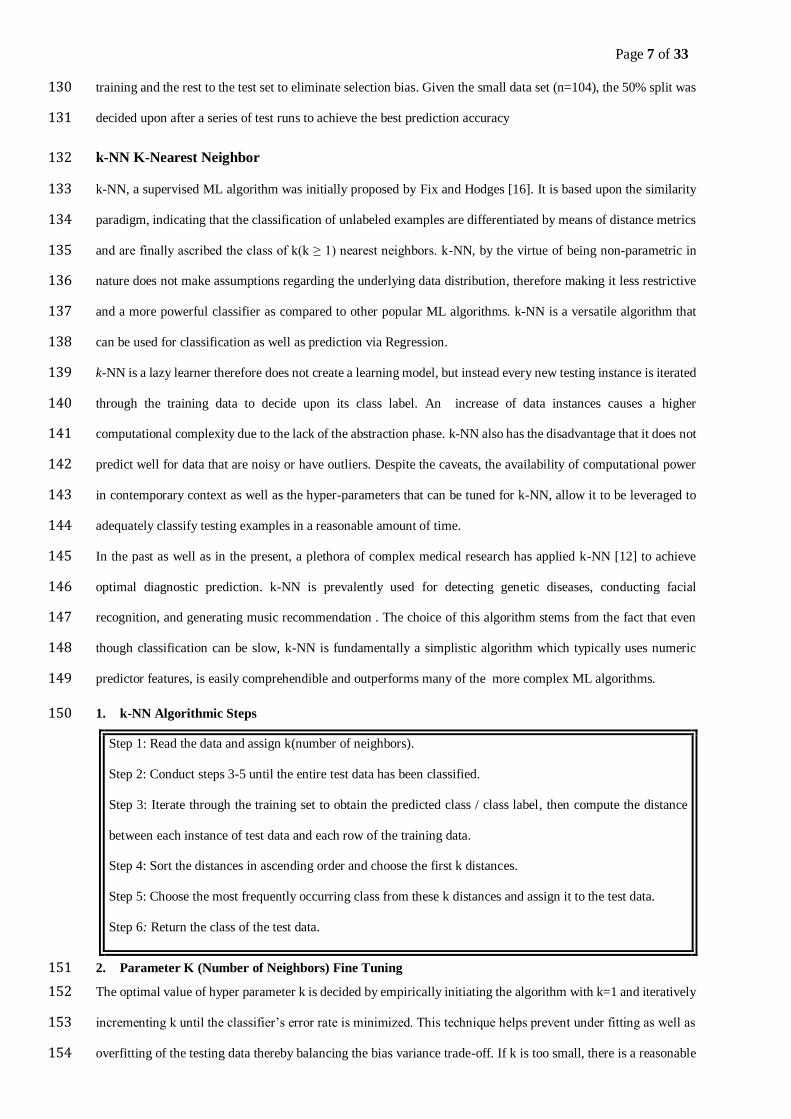
1. k-NN Algorithmic Steps 150
Step 1: Read the data and assign k(number of neighbors).
Step 2: Conduct steps 3-5 until the entire test data has been classified.
Step 3: Iterate through the training set to obtain the predicted class / class label, then compute the distance
between each instance of test data and each row of the training data.
Step 4: Sort the distances in ascending order and choose the first k distances.
Step 5: Choose the most frequently occurring class from these k distances and assign it to the test data.
Step 6: Return the class of the test data.
2. Parameter K (Number of Neighbors) Fine Tuning 151
The optimal value of hyper parameter k is decided by empirically initiating the algorithm with k=1 and iteratively 152
incrementing k until the classifier’s error rate is minimized. This technique helps prevent under fitting as well as 153
overfitting of the testing data thereby balancing the bias variance trade-off. If k is too small, there is a reasonable 154
Page 8 of 33
possibility that an outlier will affect the classification and if k is too large the similarity neighborhood might 155
incorporate several deviant classes. For a noisy dataset, where the nearest neighbors vary widely in their distances, 156
closest neighbors are more reliable for class label characterization and are given priority weightage by the process 157
of majority vote. 158
3. Similarity Distance Metric Parameter 159
To compute the k-NN similarity index using the contextual feature space, the distance between two feature vectors 160
is prevalently measured using Euclidean distance, weighted Minokwski distance, Manhattan distance, Canberra 161
distance, Chebyshev distance and the Cosine distance. Much of the current analysis was implemented using the 162
caret R Package [17], Canberra R package and ggplot2 [18]package. 163
The following distances were implemented for the current research: 164
3.1 Minokwski distance 165
Mathematically, the distance d(x, y) in a D-dimensional feature space between two points 166
x = (x1, x2, x3 … … xD)T and y = (y1, y2, y3. . . . . . yD)T is represented as follows: 167
𝐝(𝐱, 𝐲) = ||𝐱 − 𝐲||𝐩 = (∑ |𝐱𝐢 − 𝐲𝐢|𝐩𝐃
𝐢 )𝟏/𝐩 (𝟏) 168
The Lp-norm is defined as the Minokwski distance where p is the factor depicting the norm. 169
Weighted Minkowski distance is used to identify the importance of a feature attribute in context of the overall 170
classification. 171
To incorporate the weightage, each feature is assigned a weighing coefficient wi (i=1………..D) and therefore the 172
weighted Minkowski distance function is mathematically represented as follows: 173
𝐝𝐰(𝐗, 𝐘) = (∑ 𝐰𝐢
𝐃
𝐢=𝟏
|𝐱𝐢 − 𝐲𝐢|𝐩)𝟏/𝐩 (𝟐) 174
3.2 Euclidean distance 175
If p=2, L2-norm is defined as the Euclidean distance. 176
𝐝(𝐱, 𝐲) = ||𝐱 − 𝐲||𝟐 = (∑ |𝐱𝐢 − 𝐲𝐢|𝟐
𝐃
𝐢
)𝟏/𝟐 (𝟑) 177
If p=1, L1-norm is the Manhattan distance. 178
𝐝(𝐱, 𝐲) = ||𝐱 − 𝐲||𝟏 = ∑ |𝐱𝐢 − 𝐲𝐢|𝐃𝐢 (𝟒) 179
180
3.3 Canberra Distance 181
Canberra is an algorithm that represents the weighted version of the Manhattan distance. This metric specifies the 182
distance between pair of points in the vector space. This distance measure is ascertained by computing the 183
absolute value of the difference between pair of vector points divided by the sum of the absolute values of the 184
Page 9 of 33
vector points. This distance is used primarily for values that are represented in a multidimensional space as well 185
as a dataset whose values vary to a small extent close to zero. 186
Mathematically, the Canberra distance d between vectors xi and yi in a D-dimensional real vector space is given 187
by the following formula: 188
𝐝(𝐱, 𝐲) = ∑|𝐱𝐢 − 𝐲𝐢|
|𝐱𝐢| + |𝐲𝐢|
𝐃
𝐢
(𝟓) 189
Random Forest 190
The Random Forest classification model consists of many decision trees operating as an ensemble that result in 191
the target class with the majority vote get assigned to the test example. The low correlation between models helps 192
ensures that the composite classification of the ensemble outperforms any individual classification by offsetting 193
the errors of each model. Bagging or Bootstrap Aggregation are used to implement diversity within the tree models 194
Each model uses a randomly sampled training data extracted with replacement that generates a distinct tree. This 195
procedure does not allow replicating the training data since sub-setting a record cannot be chosen more than once. 196
Additionally, unlike a simple decision tree, the ensemble decision trees are forced to split on a node as per a 197
randomly selected distinct feature, which might not be the best partition criterion resulting in low correlation 198
amongst the differentiated parallel trees. The trees in the random forest are not only disparate with regards to 199
training data, but also with regards to node split feature partition. 200
The steps entailing the implementation of Random Forest algorithm are as follows: 201
Step 1: Read the data and select random samples.
Step 2: Conduct steps 3-4 until the entire test data gets classified.
Step 3: Create a decision tree for each sample by random partition split feature criterion. Generate a
classification result for each decision tree.
Step 5: Perform majority voting for every classified result.
Step 6: Majority vote is applied to assign the final class label.
Step 7 Return the class of the test data.
Optimization techniques 202
The optimizing mechanism of k-fold cross validation as well as inclusion of statistically significant cytokines 203
were incorporated to enhance the final classification result. 204
1. k-fold Cross Validation 205
k-fold Cross Validation is a technique that optimizes the prediction ability of a model in the context of new 206
unlabeled data consequently offsetting issues like overfitting or selection bias. The technique entails partitioning 207
Page 10 of 33
a dataset into k complementary subsets, implementing training of the model on k-1 subsets, and then finally 208
validating it on one partition. This study used k=10 to implement 10-fold cross validation. 209
Following steps delineate the process of k-fold cross-validation. 210
Step 1: Read the data and randomize it.
Step 2: Partition the dataset into k-1 groups for training and one group for validation.
Step 3: Iterate through the k-1 training group to fit a model with a set of tuning parameters.
Step 4: Evaluate the validation models to determine the best tuning parameter for optimizing classification
accuracy or prediction by averaging to obtain the model’s potential generalizability skill.
Step 5: Finally, the test is run to provide a realistic classification or prediction using the optimal tuning
parameters.
2. Significant Cytokines 211
The investigation also entails narrowing down the feature space, using the attributes of paramount importance by 212
selecting the ones significantly different in the CAD versus Control groups. The independent two samples t-test 213
was used at a threshold significance level(α) =.05. 214
Classifier Experimental Framework 215
The first classifier experiment entailed applying the k-NN algorithm involving 35 cytokine predictor features with 216
the Euclidean distance and 10-fold cross-validation. The second classifier experiment involved the usage of k-NN 217
algorithm incorporating only significant cytokines as predictor features with the Euclidean distance and 10-fold 218
cross-validation. The third classifier experiment evaluated the usage of 10-fold cross-validated, and weighted k-219
NN with all cytokines across a variety of kernel functions like inverse, rectangular and triangular etc. The fourth 220
classifier experiment implemented 10-fold cross-validated, and weighted k-NN with kernel function and only 221
significant cytokines. The fifth classifier experiment implemented Random Forest using the 35 cytokines with 10-222
fold cross-validation. The sixth classifier experiment applied Random Forest with only significant cytokines and 223
10-fold cross-validation. Finally, the seventh classifier experiment entailed using k-NN algorithm with Canberra 224
distance tested across different values of k. For this analysis the predominately R programming packages caret 225
[17], knngarden, corrplot [19] and ggplot2 [18] were used to obtain the results. The 10-fold cross-validation 226
resampling technique was used for all classifier experiments except classifier 10 which entailed k-NN algorithm 227
implemented with the Canberra distance measure. 228
Evaluation Measures 229
Page 11 of 33
A versatile set of performance evaluation measures were used to obtain insight related to the efficacy of algorithms 230
in conjunction with achieving the objective of juxtaposing the spectrum of algorithms experimented on. Mainly, 231
the focus was on the following numerical measures: 232
1. Prediction Accuracy 233
Fundamentally, Prediction Accuracy is the key metric that accesses the quality of a model in terms of how well 234
the test data is classified as per the targeted feature. Mathematically this can be depicted as follows: 235
𝐏𝐫𝐞𝐝𝐢𝐜𝐭𝐢𝐨𝐧 𝐀𝐜𝐜𝐮𝐫𝐚𝐜𝐲 =𝐍𝐮𝐦𝐛𝐞𝐫 𝐨𝐟 𝐜𝐨𝐫𝐫𝐞𝐜𝐭 𝐩𝐫𝐞𝐝𝐢𝐜𝐭𝐢𝐨𝐧𝐬
𝐓𝐨𝐭𝐚𝐥 𝐧𝐮𝐦𝐛𝐞𝐫 𝐨𝐟 𝐏𝐫𝐞𝐝𝐢𝐜𝐭𝐢𝐨𝐧𝐬 (𝟔) 236
In context of the current scenario, where we are dealing with a binary classification of CAD versus Control , it 237
can also be quantified in terms of true positive and true negative measures. 238
𝐏𝐫𝐞𝐝𝐢𝐜𝐭𝐢𝐨𝐧 𝐀𝐜𝐜𝐮𝐫𝐚𝐜𝐲 = 𝐓𝐏 + 𝐓𝐍
𝐓𝐏 + 𝐓𝐍 + 𝐅𝐏 + 𝐅𝐍 (𝟕) 239
Where, TP = True Positive, TN = True Negative, FP = False Positive and FN = False Negative. 240
2. Sensitivity (TPR: True Positive Rate) 241
This metric numerically quantifies the performance of a ML algorithm from the perspective of the proportion of 242
actual positive instances that were predicted to be positive. Alternatively, it is also called the True positive rate. 243
𝐒𝐞𝐧𝐬𝐢𝐭𝐢𝐯𝐢𝐭𝐲 = 𝐓𝐏
𝐓𝐏 + 𝐅𝐍 (𝟖) 244
Where, TPR=1-TNR(True Negative Rate) 245
3. Specificity (TNR: True Negative Rate) 246
This measure quantifies the proportion of actual negative instances that were predicted to be negatives. 247
Alternatively, it is also called the True negative rate. 248
𝐒𝐩𝐞𝐜𝐢𝐟𝐢𝐜𝐢𝐭𝐲 = 𝐓𝐍
𝐓𝐍 + 𝐅𝐏 (𝟗) 249
Where TNR =1-TPR(True Positive Rate) 250
4. AUC-ROC (Area Under the Curve-Receiver Operating Characteristics) 251
This is a vital measure that helps determine the degree of separability achieved by the relevant Classification 252
algorithm. Higher AUC increases the algorithm’s capability of differentiating into classes. The ROC curve is 253
created by plotting FPR (x-axis) against the TPR (y-axis). 254
5. T tests for Statistical Significance 255
To improve the efficacy of classification and for optimal feature selection, independent two sample t tests were 256
used to extract the features that are significantly different for CAD versus Control plasma cytokine levels. The 257
significance level (α) of .05 was used to differentiate the statistical significance versus the insignificance. 258
6. Correlation Coefficient Matrix 259
Page 12 of 33
A correlation coefficient matrix was constructed to ascertain the strength, direction, and the statistical significance 260
of pairwise association pertaining to cytokines that were mainly responsible for the classification of at-risk CAD 261
group versus the not at-risk Control group. The Pearson correlation coefficient matrix provided a better 262
understanding of the relational bio marker underpinnings. To identify significance of the correlational association, 263
independent two sample t tests were used with a threshold significance level of α=.05. 264
Results 265
Identification of Significant Cytokines for CAD classification 266
The following graphs and tables provide a comparative analysis of significant cytokines grouped by CAD versus 267
Control, with the independent two samples t test determining significance. Specifically, the significant cytokines 268
were “IL1-β”, “IL-10”, “IL-12”, “Eotaxin”, “GM-CSF”, “IL1-α”, “TNF”,“IL-2” and “IL-4”. 269
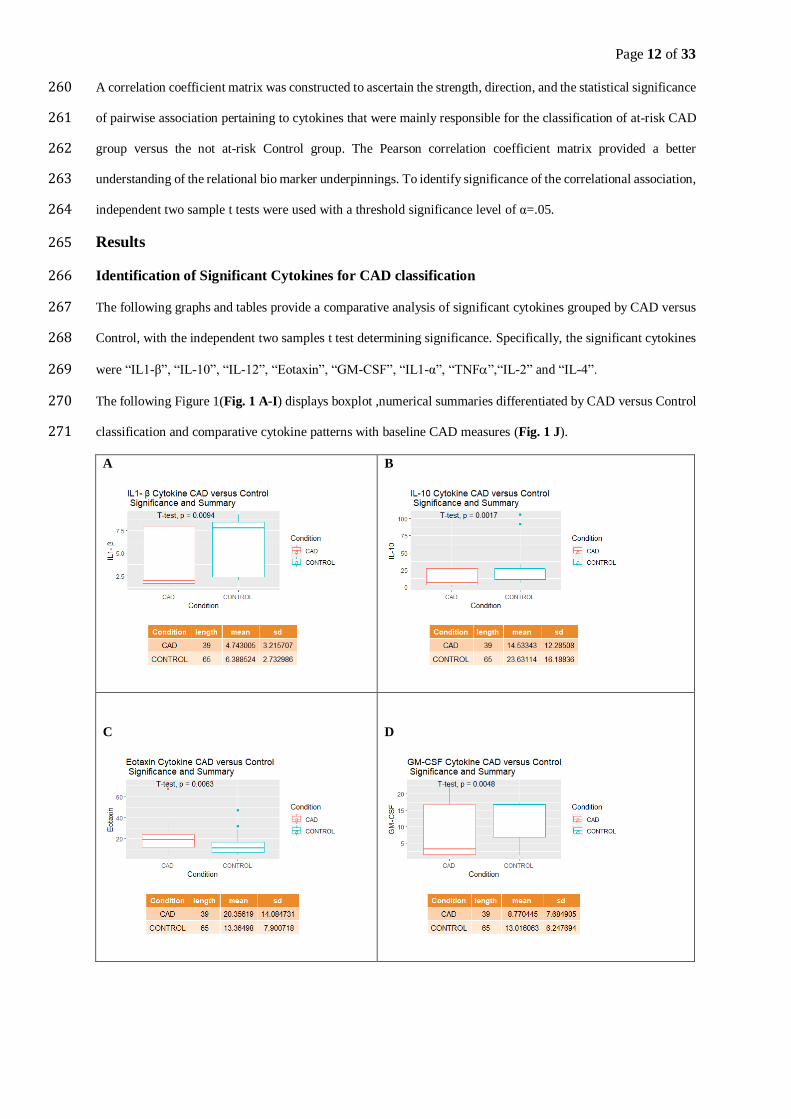
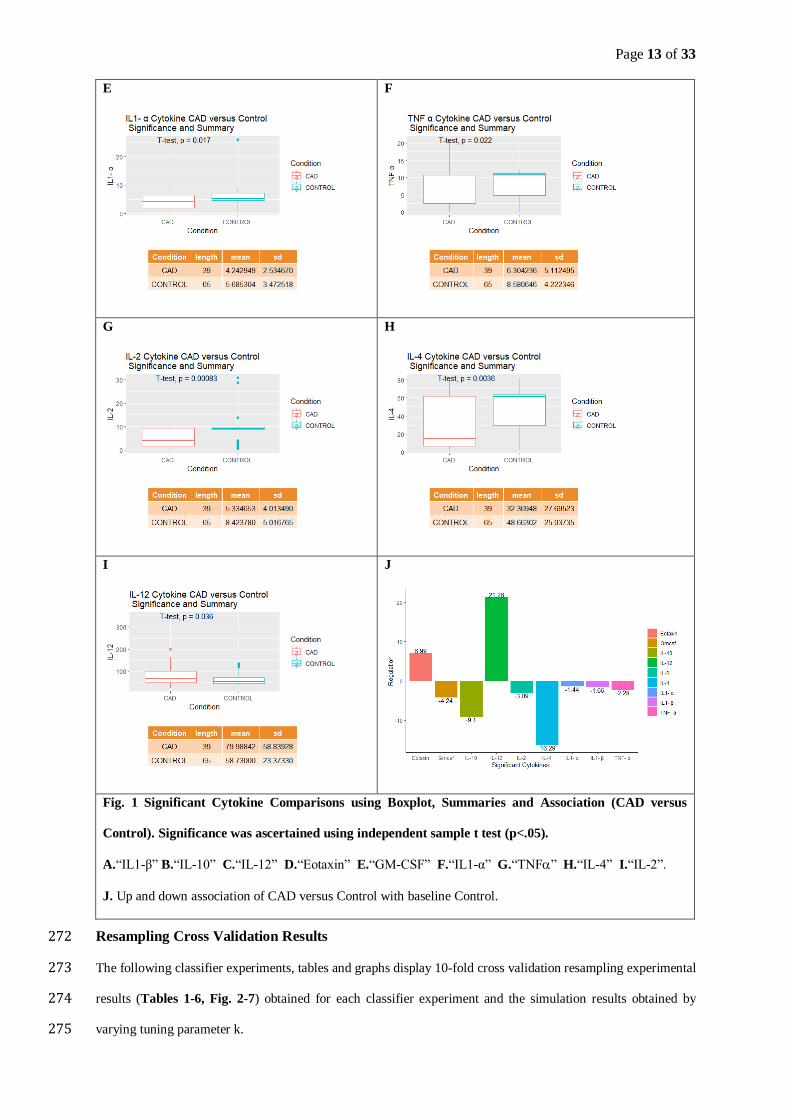
The following Figure 1(Fig. 1 A-I) displays boxplot ,numerical summaries differentiated by CAD versus Control 270
classification and comparative cytokine patterns with baseline CAD measures (Fig. 1 J). 271
A
B
C
D
Page 13 of 33
E
F
G
H
I
J
Fig. 1 Significant Cytokine Comparisons using Boxplot, Summaries and Association (CAD versus
Control). Significance was ascertained using independent sample t test (p<.05).
A.“IL1-β” B.“IL-10” C.“IL-12” D.“Eotaxin” E.“GM-CSF” F.“IL1-α” G.“TNF” H.“IL-4” I.“IL-2”.
J. Up and down association of CAD versus Control with baseline Control.
Resampling Cross Validation Results 272
The following classifier experiments, tables and graphs display 10-fold cross validation resampling experimental 273
results (Tables 1-6, Fig. 2-7) obtained for each classifier experiment and the simulation results obtained by 274
varying tuning parameter k. 275
Page 14 of 33
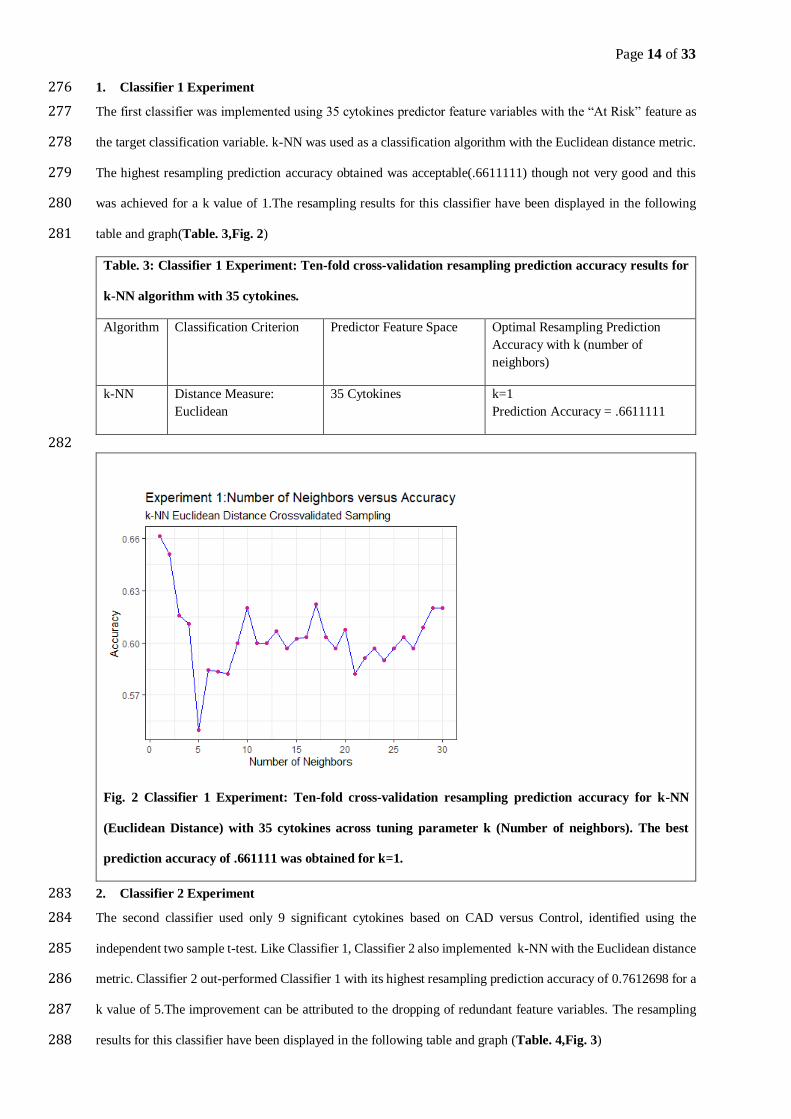
1. Classifier 1 Experiment 276
The first classifier was implemented using 35 cytokines predictor feature variables with the “At Risk” feature as 277
the target classification variable. k-NN was used as a classification algorithm with the Euclidean distance metric. 278
The highest resampling prediction accuracy obtained was acceptable(.6611111) though not very good and this 279
was achieved for a k value of 1.The resampling results for this classifier have been displayed in the following 280
table and graph(Table. 3,Fig. 2) 281
Table. 3: Classifier 1 Experiment: Ten-fold cross-validation resampling prediction accuracy results for
k-NN algorithm with 35 cytokines.
Algorithm Classification Criterion Predictor Feature Space Optimal Resampling Prediction
Accuracy with k (number of
neighbors)
k-NN Distance Measure:
Euclidean
35 Cytokines k=1
Prediction Accuracy = .6611111
282
Fig. 2 Classifier 1 Experiment: Ten-fold cross-validation resampling prediction accuracy for k-NN
(Euclidean Distance) with 35 cytokines across tuning parameter k (Number of neighbors). The best
prediction accuracy of .661111 was obtained for k=1.
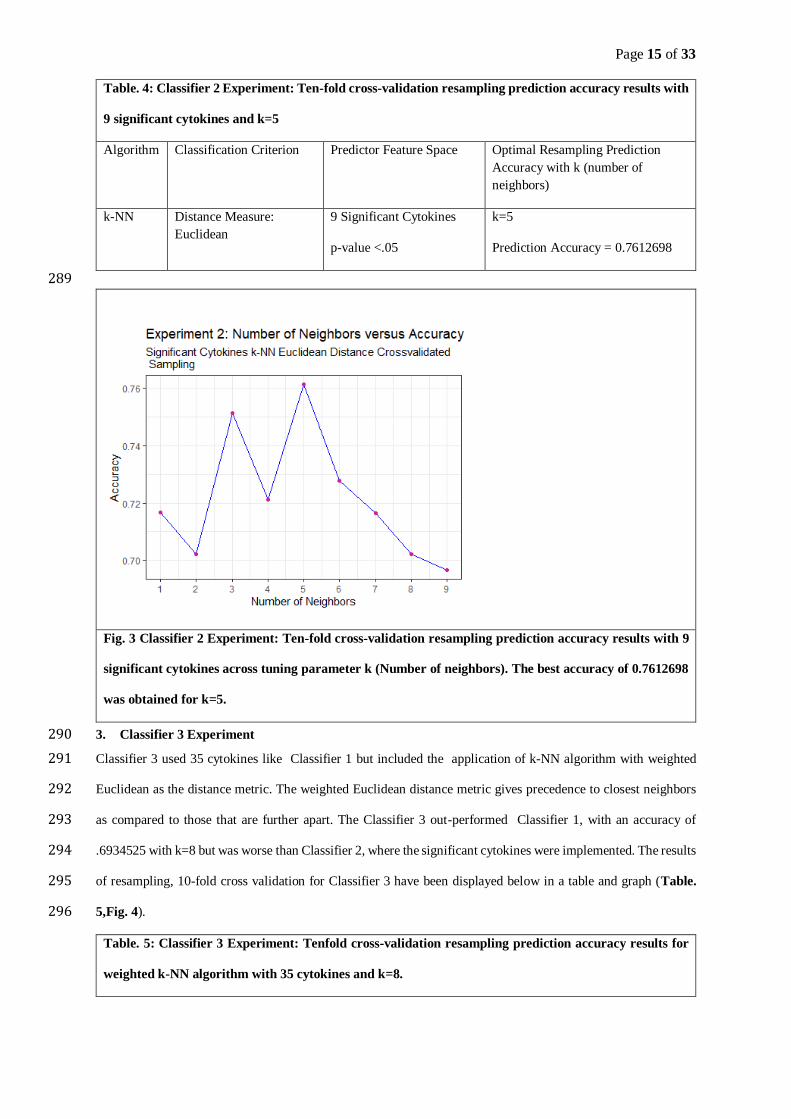
2. Classifier 2 Experiment 283
The second classifier used only 9 significant cytokines based on CAD versus Control, identified using the 284
independent two sample t-test. Like Classifier 1, Classifier 2 also implemented k-NN with the Euclidean distance 285
metric. Classifier 2 out-performed Classifier 1 with its highest resampling prediction accuracy of 0.7612698 for a 286
k value of 5.The improvement can be attributed to the dropping of redundant feature variables. The resampling 287
results for this classifier have been displayed in the following table and graph (Table. 4,Fig. 3) 288
Page 15 of 33
Table. 4: Classifier 2 Experiment: Ten-fold cross-validation resampling prediction accuracy results with
9 significant cytokines and k=5
Algorithm Classification Criterion Predictor Feature Space Optimal Resampling Prediction
Accuracy with k (number of
neighbors)
k-NN Distance Measure:
Euclidean
9 Significant Cytokines
p-value <.05
k=5
Prediction Accuracy = 0.7612698
289
Fig. 3 Classifier 2 Experiment: Ten-fold cross-validation resampling prediction accuracy results with 9
significant cytokines across tuning parameter k (Number of neighbors). The best accuracy of 0.7612698
was obtained for k=5.
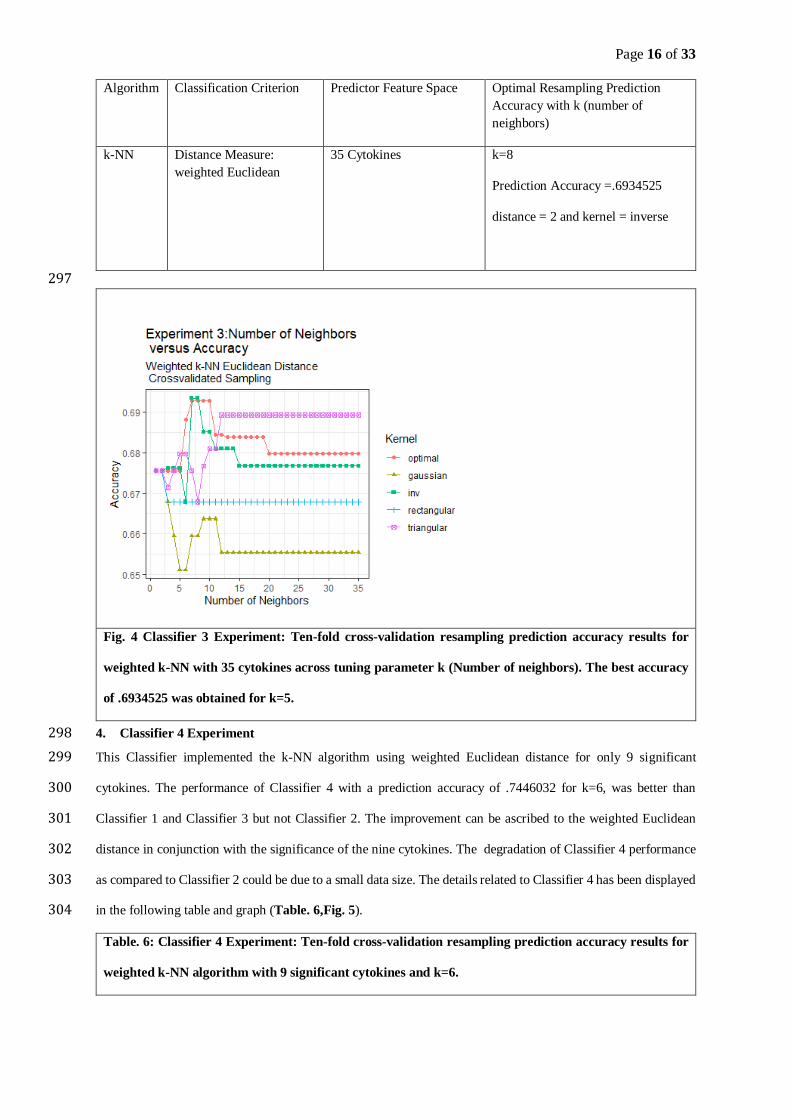
3. Classifier 3 Experiment 290
Classifier 3 used 35 cytokines like Classifier 1 but included the application of k-NN algorithm with weighted 291
Euclidean as the distance metric. The weighted Euclidean distance metric gives precedence to closest neighbors 292
as compared to those that are further apart. The Classifier 3 out-performed Classifier 1, with an accuracy of 293
.6934525 with k=8 but was worse than Classifier 2, where the significant cytokines were implemented. The results 294
of resampling, 10-fold cross validation for Classifier 3 have been displayed below in a table and graph (Table. 295
5,Fig. 4). 296
Table. 5: Classifier 3 Experiment: Tenfold cross-validation resampling prediction accuracy results for
weighted k-NN algorithm with 35 cytokines and k=8.
Page 16 of 33
Algorithm Classification Criterion Predictor Feature Space Optimal Resampling Prediction
Accuracy with k (number of
neighbors)
k-NN Distance Measure:
weighted Euclidean
35 Cytokines k=8
Prediction Accuracy =.6934525
distance = 2 and kernel = inverse
297
Fig. 4 Classifier 3 Experiment: Ten-fold cross-validation resampling prediction accuracy results for
weighted k-NN with 35 cytokines across tuning parameter k (Number of neighbors). The best accuracy
of .6934525 was obtained for k=5.
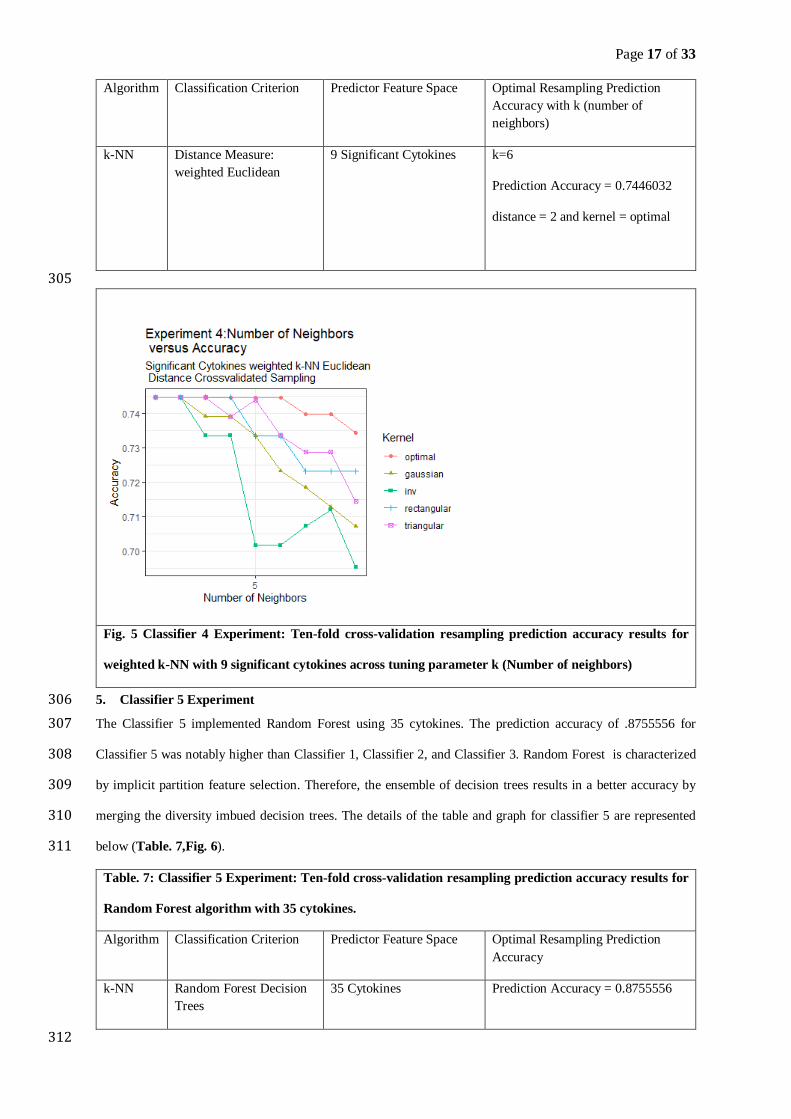
4. Classifier 4 Experiment 298
This Classifier implemented the k-NN algorithm using weighted Euclidean distance for only 9 significant 299
cytokines. The performance of Classifier 4 with a prediction accuracy of .7446032 for k=6, was better than 300
Classifier 1 and Classifier 3 but not Classifier 2. The improvement can be ascribed to the weighted Euclidean 301
distance in conjunction with the significance of the nine cytokines. The degradation of Classifier 4 performance 302
as compared to Classifier 2 could be due to a small data size. The details related to Classifier 4 has been displayed 303
in the following table and graph (Table. 6,Fig. 5). 304
Table. 6: Classifier 4 Experiment: Ten-fold cross-validation resampling prediction accuracy results for
weighted k-NN algorithm with 9 significant cytokines and k=6.
Page 17 of 33
Algorithm Classification Criterion Predictor Feature Space Optimal Resampling Prediction
Accuracy with k (number of
neighbors)
k-NN Distance Measure:
weighted Euclidean
9 Significant Cytokines k=6
Prediction Accuracy = 0.7446032
distance = 2 and kernel = optimal
305
Fig. 5 Classifier 4 Experiment: Ten-fold cross-validation resampling prediction accuracy results for
weighted k-NN with 9 significant cytokines across tuning parameter k (Number of neighbors)
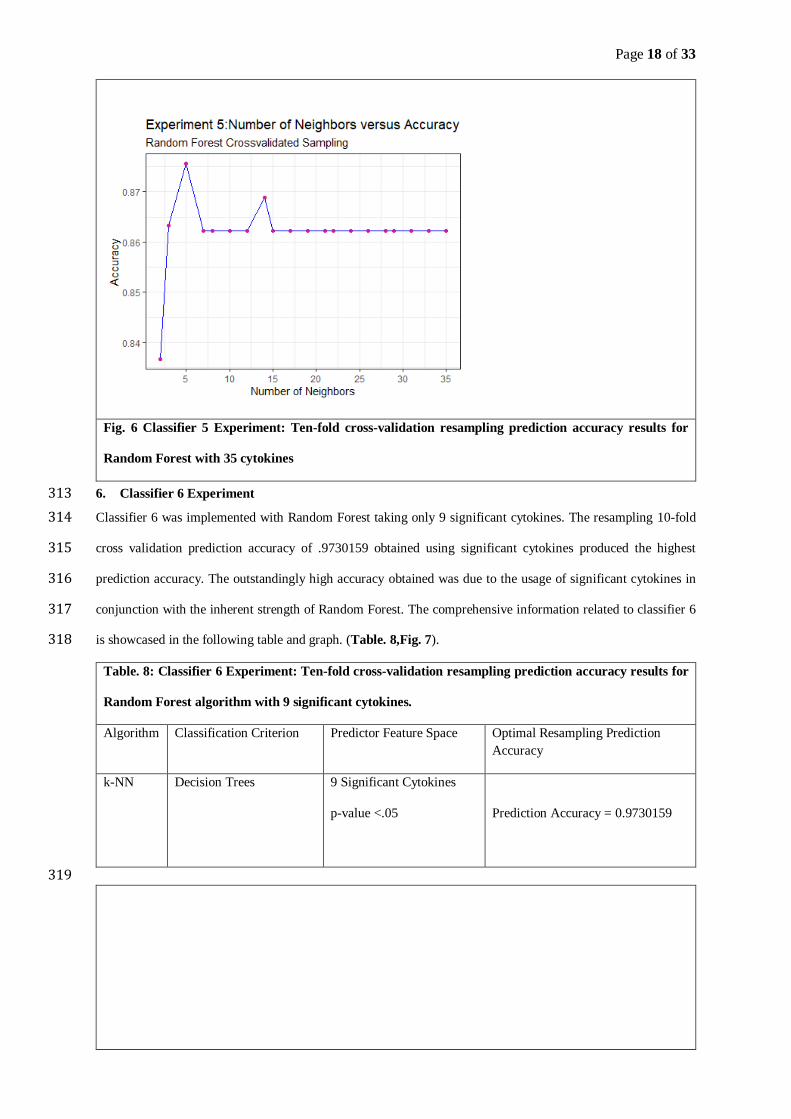
5. Classifier 5 Experiment 306
The Classifier 5 implemented Random Forest using 35 cytokines. The prediction accuracy of .8755556 for 307
Classifier 5 was notably higher than Classifier 1, Classifier 2, and Classifier 3. Random Forest is characterized 308
by implicit partition feature selection. Therefore, the ensemble of decision trees results in a better accuracy by 309
merging the diversity imbued decision trees. The details of the table and graph for classifier 5 are represented 310
below (Table. 7,Fig. 6). 311
Table. 7: Classifier 5 Experiment: Ten-fold cross-validation resampling prediction accuracy results for
Random Forest algorithm with 35 cytokines.
Algorithm Classification Criterion Predictor Feature Space Optimal Resampling Prediction
Accuracy
k-NN Random Forest Decision
Trees
35 Cytokines Prediction Accuracy = 0.8755556
312
Page 18 of 33
Fig. 6 Classifier 5 Experiment: Ten-fold cross-validation resampling prediction accuracy results for
Random Forest with 35 cytokines
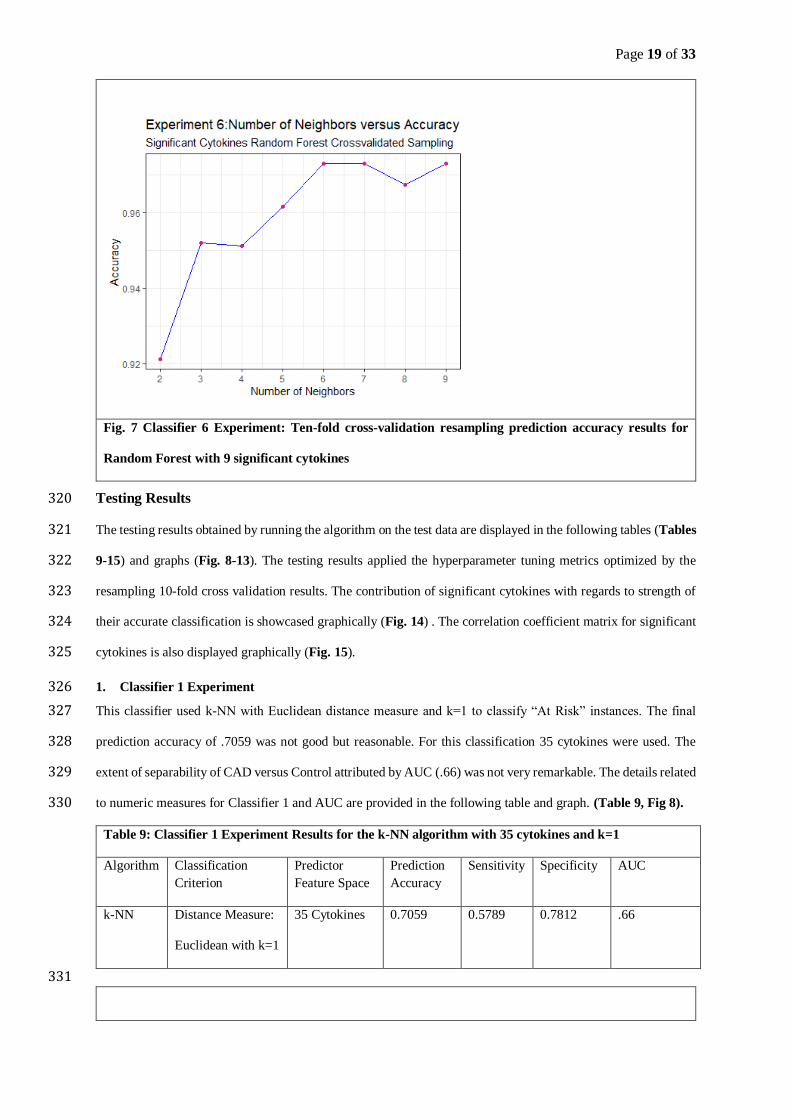
6. Classifier 6 Experiment 313
Classifier 6 was implemented with Random Forest taking only 9 significant cytokines. The resampling 10-fold 314
cross validation prediction accuracy of .9730159 obtained using significant cytokines produced the highest 315
prediction accuracy. The outstandingly high accuracy obtained was due to the usage of significant cytokines in 316
conjunction with the inherent strength of Random Forest. The comprehensive information related to classifier 6 317
is showcased in the following table and graph. (Table. 8,Fig. 7). 318
Table. 8: Classifier 6 Experiment: Ten-fold cross-validation resampling prediction accuracy results for
Random Forest algorithm with 9 significant cytokines.
Algorithm Classification Criterion Predictor Feature Space Optimal Resampling Prediction
Accuracy
k-NN Decision Trees 9 Significant Cytokines
p-value <.05
Prediction Accuracy = 0.9730159
319
Page 19 of 33
Fig. 7 Classifier 6 Experiment: Ten-fold cross-validation resampling prediction accuracy results for
Random Forest with 9 significant cytokines
Testing Results 320
The testing results obtained by running the algorithm on the test data are displayed in the following tables (Tables 321
9-15) and graphs (Fig. 8-13). The testing results applied the hyperparameter tuning metrics optimized by the 322
resampling 10-fold cross validation results. The contribution of significant cytokines with regards to strength of 323
their accurate classification is showcased graphically (Fig. 14) . The correlation coefficient matrix for significant 324
cytokines is also displayed graphically (Fig. 15). 325
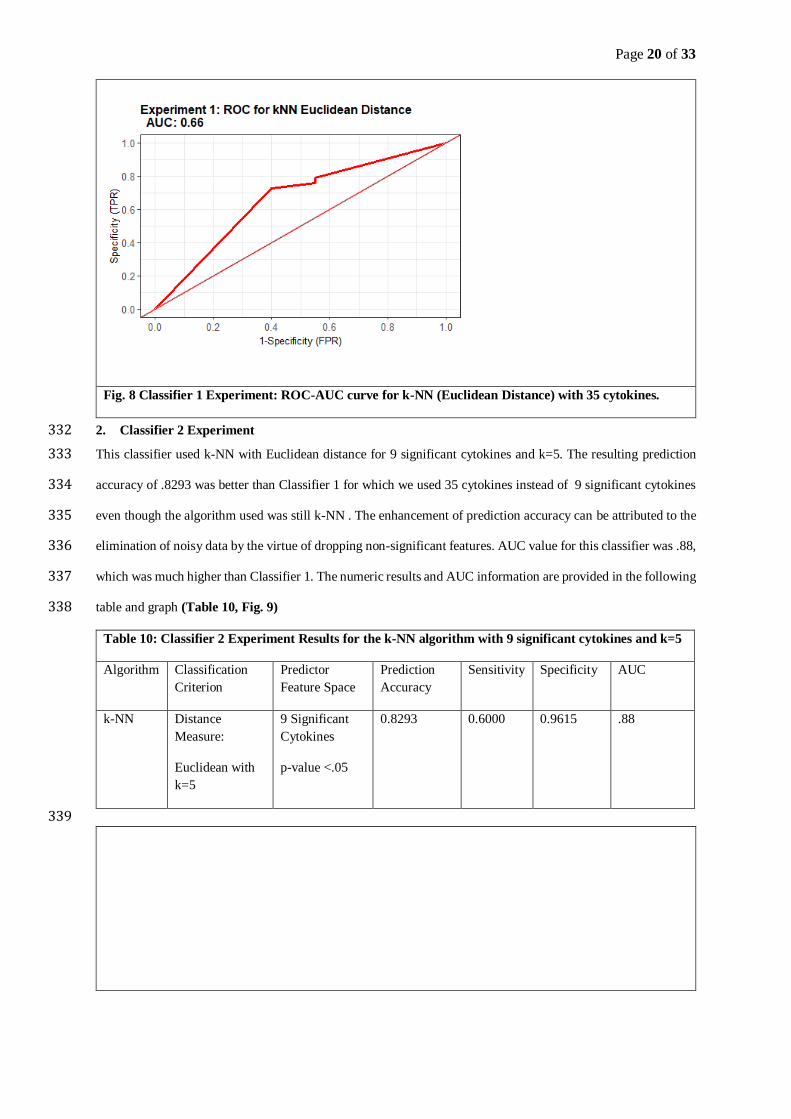
1. Classifier 1 Experiment 326
This classifier used k-NN with Euclidean distance measure and k=1 to classify “At Risk” instances. The final 327
prediction accuracy of .7059 was not good but reasonable. For this classification 35 cytokines were used. The 328
extent of separability of CAD versus Control attributed by AUC (.66) was not very remarkable. The details related 329
to numeric measures for Classifier 1 and AUC are provided in the following table and graph. (Table 9, Fig 8). 330
Table 9: Classifier 1 Experiment Results for the k-NN algorithm with 35 cytokines and k=1
Algorithm Classification
Criterion
Predictor
Feature Space
Prediction
Accuracy
Sensitivity Specificity AUC
k-NN Distance Measure:
Euclidean with k=1
35 Cytokines 0.7059 0.5789 0.7812 .66
331
Page 20 of 33
Fig. 8 Classifier 1 Experiment: ROC-AUC curve for k-NN (Euclidean Distance) with 35 cytokines.
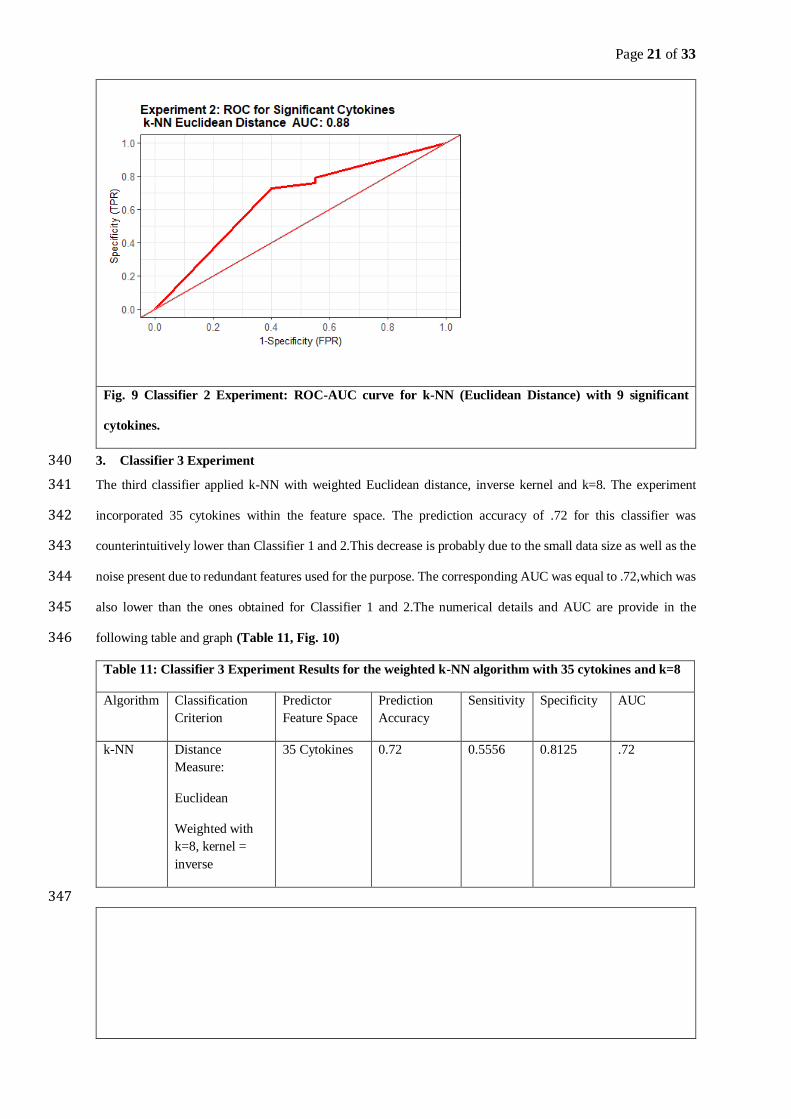
2. Classifier 2 Experiment 332
This classifier used k-NN with Euclidean distance for 9 significant cytokines and k=5. The resulting prediction 333
accuracy of .8293 was better than Classifier 1 for which we used 35 cytokines instead of 9 significant cytokines 334
even though the algorithm used was still k-NN . The enhancement of prediction accuracy can be attributed to the 335
elimination of noisy data by the virtue of dropping non-significant features. AUC value for this classifier was .88, 336
which was much higher than Classifier 1. The numeric results and AUC information are provided in the following 337
table and graph (Table 10, Fig. 9) 338
Table 10: Classifier 2 Experiment Results for the k-NN algorithm with 9 significant cytokines and k=5
Algorithm Classification
Criterion
Predictor
Feature Space
Prediction
Accuracy
Sensitivity Specificity AUC
k-NN Distance
Measure:
Euclidean with
k=5
9 Significant
Cytokines
p-value <.05
0.8293
0.6000 0.9615 .88
339
Page 21 of 33
Fig. 9 Classifier 2 Experiment: ROC-AUC curve for k-NN (Euclidean Distance) with 9 significant
cytokines.
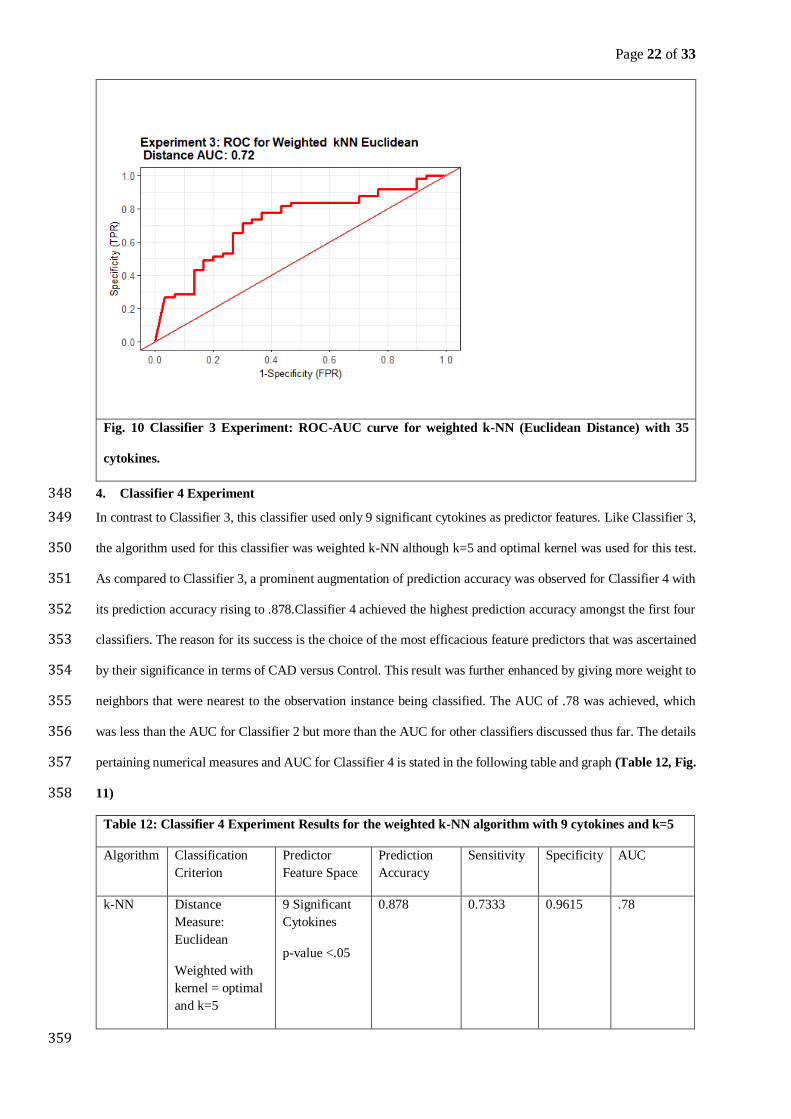
3. Classifier 3 Experiment 340
The third classifier applied k-NN with weighted Euclidean distance, inverse kernel and k=8. The experiment 341
incorporated 35 cytokines within the feature space. The prediction accuracy of .72 for this classifier was 342
counterintuitively lower than Classifier 1 and 2.This decrease is probably due to the small data size as well as the 343
noise present due to redundant features used for the purpose. The corresponding AUC was equal to .72,which was 344
also lower than the ones obtained for Classifier 1 and 2.The numerical details and AUC are provide in the 345
following table and graph (Table 11, Fig. 10) 346
Table 11: Classifier 3 Experiment Results for the weighted k-NN algorithm with 35 cytokines and k=8
Algorithm Classification
Criterion
Predictor
Feature Space
Prediction
Accuracy
Sensitivity Specificity AUC
k-NN Distance
Measure:
Euclidean
Weighted with
k=8, kernel =
inverse
35 Cytokines 0.72 0.5556 0.8125 .72
347
Page 22 of 33
Fig. 10 Classifier 3 Experiment: ROC-AUC curve for weighted k-NN (Euclidean Distance) with 35
cytokines.
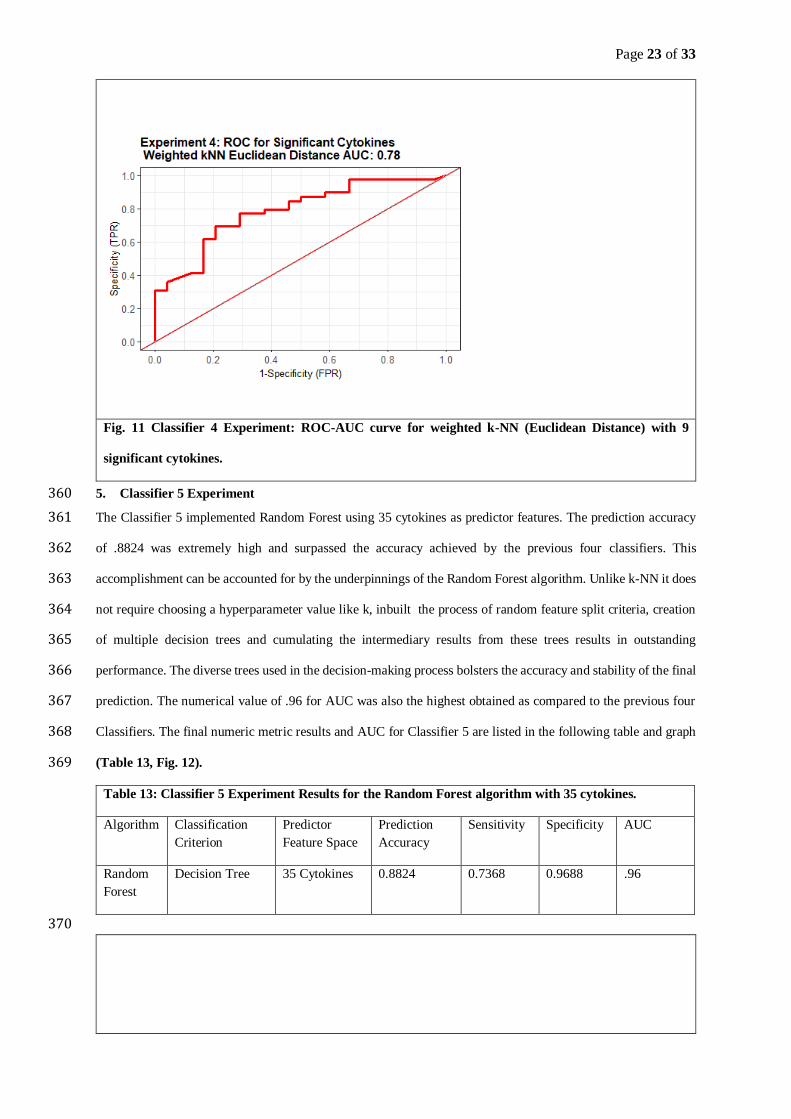
4. Classifier 4 Experiment 348
In contrast to Classifier 3, this classifier used only 9 significant cytokines as predictor features. Like Classifier 3, 349
the algorithm used for this classifier was weighted k-NN although k=5 and optimal kernel was used for this test. 350
As compared to Classifier 3, a prominent augmentation of prediction accuracy was observed for Classifier 4 with 351
its prediction accuracy rising to .878.Classifier 4 achieved the highest prediction accuracy amongst the first four 352
classifiers. The reason for its success is the choice of the most efficacious feature predictors that was ascertained 353
by their significance in terms of CAD versus Control. This result was further enhanced by giving more weight to 354
neighbors that were nearest to the observation instance being classified. The AUC of .78 was achieved, which 355
was less than the AUC for Classifier 2 but more than the AUC for other classifiers discussed thus far. The details 356
pertaining numerical measures and AUC for Classifier 4 is stated in the following table and graph (Table 12, Fig. 357
11) 358
Table 12: Classifier 4 Experiment Results for the weighted k-NN algorithm with 9 cytokines and k=5
Algorithm Classification
Criterion
Predictor
Feature Space
Prediction
Accuracy
Sensitivity Specificity AUC
k-NN Distance
Measure:
Euclidean
Weighted with
kernel = optimal
and k=5
9 Significant
Cytokines
p-value <.05
0.878 0.7333 0.9615 .78
359
Page 23 of 33
Fig. 11 Classifier 4 Experiment: ROC-AUC curve for weighted k-NN (Euclidean Distance) with 9
significant cytokines.
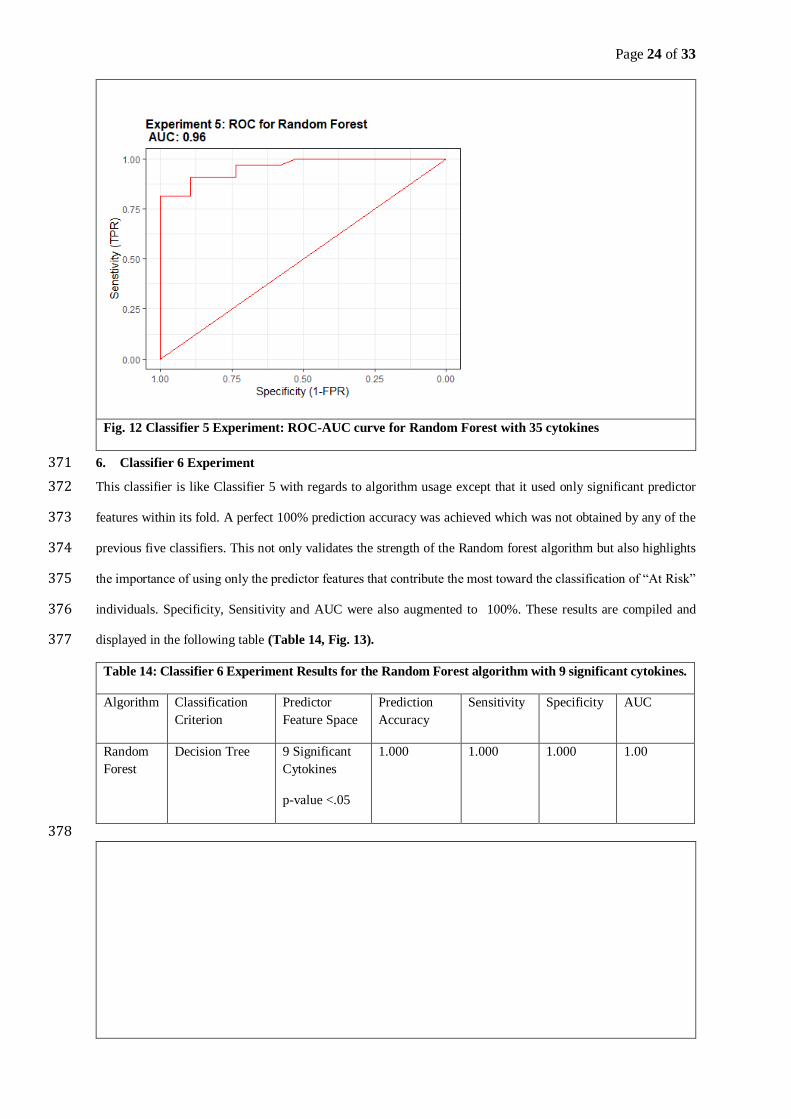
5. Classifier 5 Experiment 360
The Classifier 5 implemented Random Forest using 35 cytokines as predictor features. The prediction accuracy 361
of .8824 was extremely high and surpassed the accuracy achieved by the previous four classifiers. This 362
accomplishment can be accounted for by the underpinnings of the Random Forest algorithm. Unlike k-NN it does 363
not require choosing a hyperparameter value like k, inbuilt the process of random feature split criteria, creation 364
of multiple decision trees and cumulating the intermediary results from these trees results in outstanding 365
performance. The diverse trees used in the decision-making process bolsters the accuracy and stability of the final 366
prediction. The numerical value of .96 for AUC was also the highest obtained as compared to the previous four 367
Classifiers. The final numeric metric results and AUC for Classifier 5 are listed in the following table and graph 368
(Table 13, Fig. 12). 369
Table 13: Classifier 5 Experiment Results for the Random Forest algorithm with 35 cytokines.
Algorithm Classification
Criterion
Predictor
Feature Space
Prediction
Accuracy
Sensitivity Specificity AUC
Random
Forest
Decision Tree 35 Cytokines 0.8824 0.7368 0.9688 .96
370
Page 24 of 33
Fig. 12 Classifier 5 Experiment: ROC-AUC curve for Random Forest with 35 cytokines
6. Classifier 6 Experiment 371
This classifier is like Classifier 5 with regards to algorithm usage except that it used only significant predictor 372
features within its fold. A perfect 100% prediction accuracy was achieved which was not obtained by any of the 373
previous five classifiers. This not only validates the strength of the Random forest algorithm but also highlights 374
the importance of using only the predictor features that contribute the most toward the classification of “At Risk” 375
individuals. Specificity, Sensitivity and AUC were also augmented to 100%. These results are compiled and 376
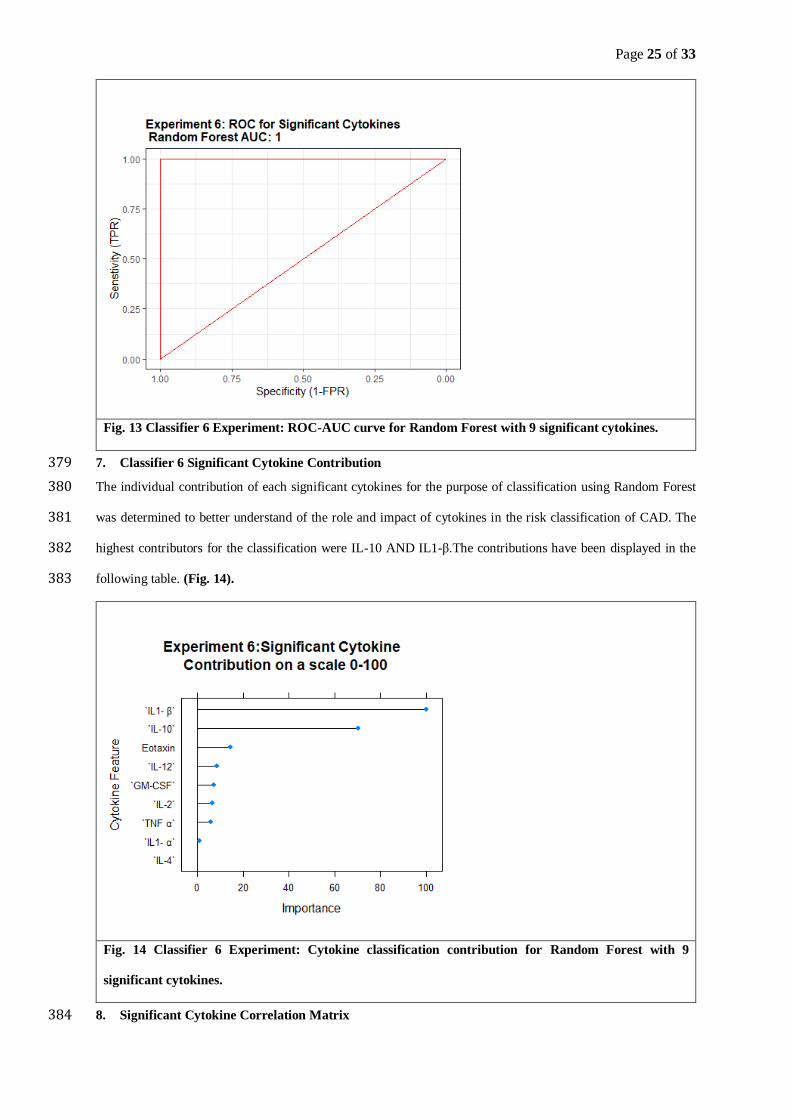
displayed in the following table (Table 14, Fig. 13). 377
Table 14: Classifier 6 Experiment Results for the Random Forest algorithm with 9 significant cytokines.
Algorithm Classification
Criterion
Predictor
Feature Space
Prediction
Accuracy
Sensitivity Specificity AUC
Random
Forest
Decision Tree 9 Significant
Cytokines
p-value <.05
1.000 1.000 1.000 1.00
378
Page 25 of 33
Fig. 13 Classifier 6 Experiment: ROC-AUC curve for Random Forest with 9 significant cytokines.
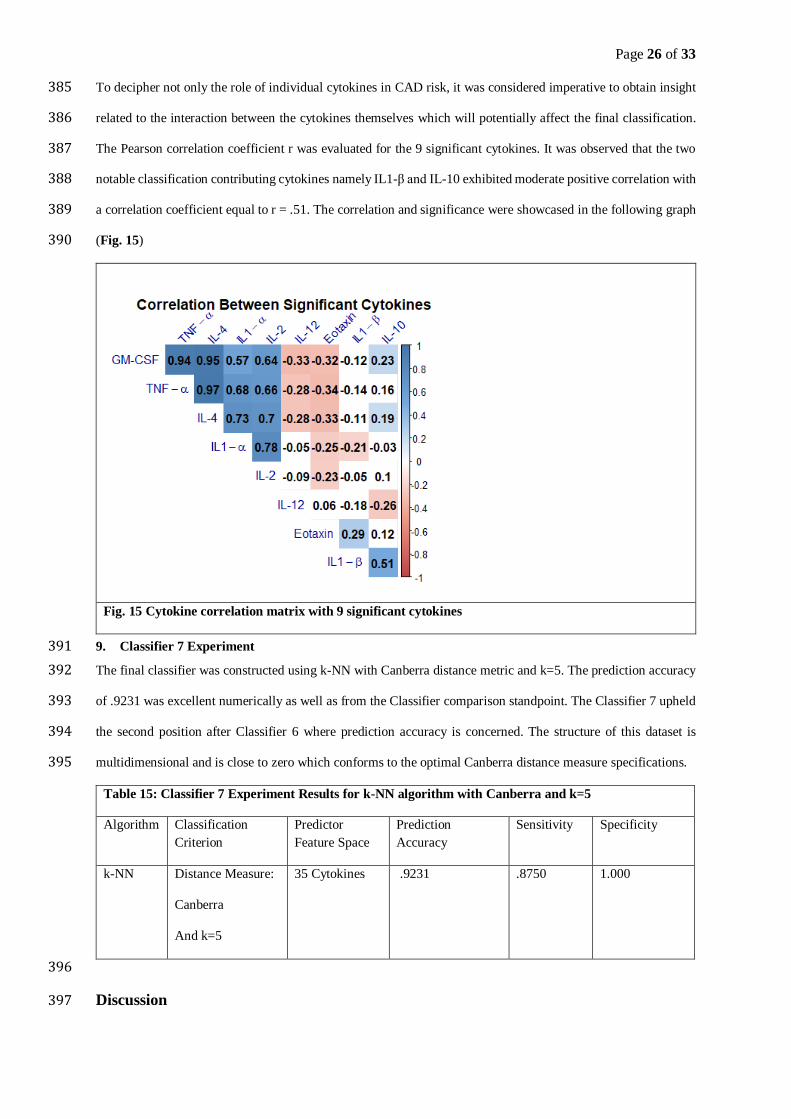
7. Classifier 6 Significant Cytokine Contribution 379
The individual contribution of each significant cytokines for the purpose of classification using Random Forest 380
was determined to better understand of the role and impact of cytokines in the risk classification of CAD. The 381
highest contributors for the classification were IL-10 AND IL1-β.The contributions have been displayed in the 382
following table. (Fig. 14). 383
Fig. 14 Classifier 6 Experiment: Cytokine classification contribution for Random Forest with 9
significant cytokines.
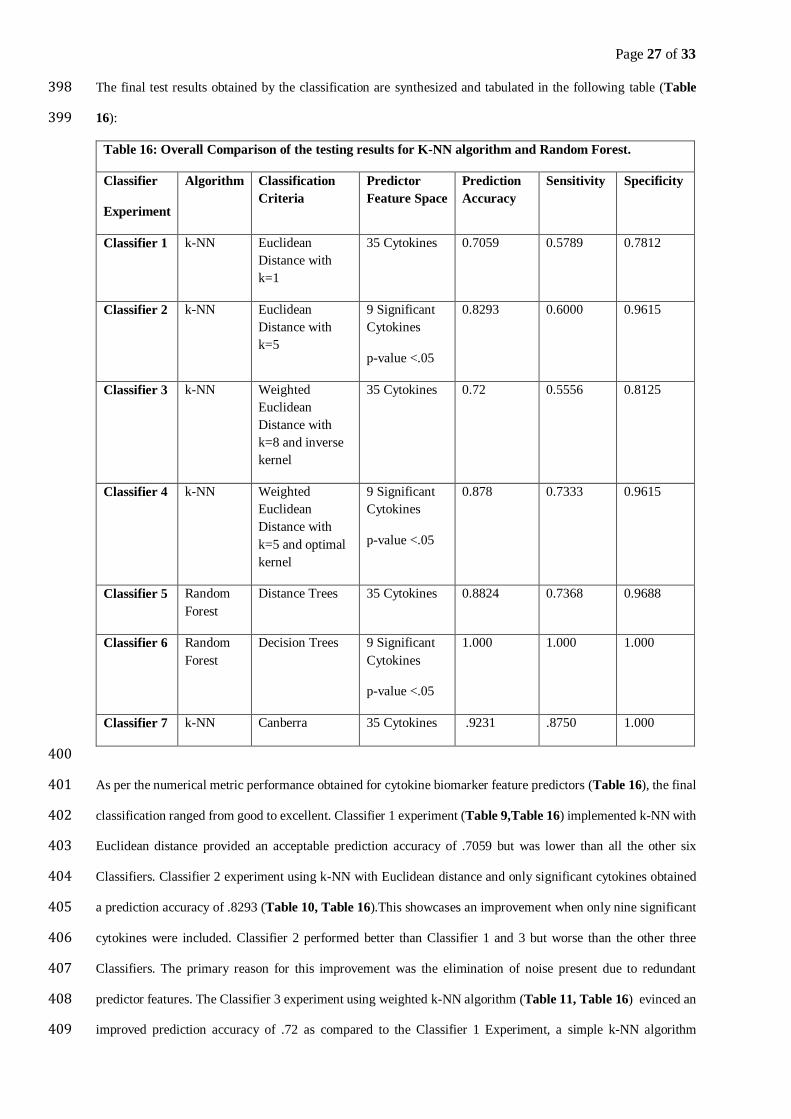
8. Significant Cytokine Correlation Matrix 384
Page 26 of 33
To decipher not only the role of individual cytokines in CAD risk, it was considered imperative to obtain insight 385
related to the interaction between the cytokines themselves which will potentially affect the final classification. 386
The Pearson correlation coefficient r was evaluated for the 9 significant cytokines. It was observed that the two 387
notable classification contributing cytokines namely IL1-β and IL-10 exhibited moderate positive correlation with 388
a correlation coefficient equal to r = .51. The correlation and significance were showcased in the following graph 389
(Fig. 15) 390
Fig. 15 Cytokine correlation matrix with 9 significant cytokines
9. Classifier 7 Experiment 391
The final classifier was constructed using k-NN with Canberra distance metric and k=5. The prediction accuracy 392
of .9231 was excellent numerically as well as from the Classifier comparison standpoint. The Classifier 7 upheld 393
the second position after Classifier 6 where prediction accuracy is concerned. The structure of this dataset is 394
multidimensional and is close to zero which conforms to the optimal Canberra distance measure specifications. 395
Table 15: Classifier 7 Experiment Results for k-NN algorithm with Canberra and k=5
Algorithm Classification
Criterion
Predictor
Feature Space
Prediction
Accuracy
Sensitivity Specificity
k-NN Distance Measure:
Canberra
And k=5
35 Cytokines .9231 .8750 1.000
396
Discussion 397
Page 27 of 33
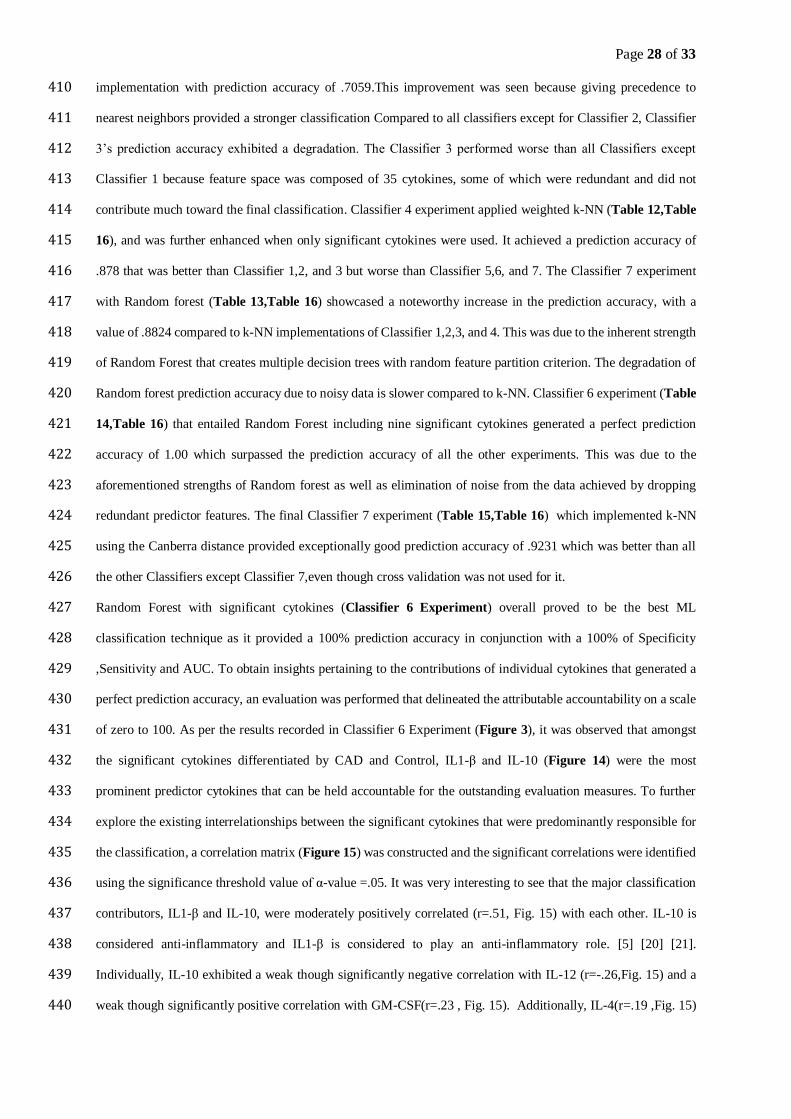
The final test results obtained by the classification are synthesized and tabulated in the following table (Table 398
16): 399
Table 16: Overall Comparison of the testing results for K-NN algorithm and Random Forest.
Classifier
Experiment
Algorithm Classification
Criteria
Predictor
Feature Space
Prediction
Accuracy
Sensitivity Specificity
Classifier 1 k-NN Euclidean
Distance with
k=1
35 Cytokines 0.7059 0.5789 0.7812
Classifier 2 k-NN Euclidean
Distance with
k=5
9 Significant
Cytokines
p-value <.05
0.8293
0.6000 0.9615
Classifier 3 k-NN Weighted
Euclidean
Distance with
k=8 and inverse
kernel
35 Cytokines 0.72 0.5556 0.8125
Classifier 4 k-NN Weighted
Euclidean
Distance with
k=5 and optimal
kernel
9 Significant
Cytokines
p-value <.05
0.878 0.7333 0.9615
Classifier 5 Random
Forest
Distance Trees 35 Cytokines 0.8824 0.7368 0.9688
Classifier 6 Random
Forest
Decision Trees 9 Significant
Cytokines
p-value <.05
1.000 1.000 1.000
Classifier 7 k-NN Canberra 35 Cytokines .9231 .8750 1.000
400
As per the numerical metric performance obtained for cytokine biomarker feature predictors (Table 16), the final 401
classification ranged from good to excellent. Classifier 1 experiment (Table 9,Table 16) implemented k-NN with 402
Euclidean distance provided an acceptable prediction accuracy of .7059 but was lower than all the other six 403
Classifiers. Classifier 2 experiment using k-NN with Euclidean distance and only significant cytokines obtained 404
a prediction accuracy of .8293 (Table 10, Table 16).This showcases an improvement when only nine significant 405
cytokines were included. Classifier 2 performed better than Classifier 1 and 3 but worse than the other three 406
Classifiers. The primary reason for this improvement was the elimination of noise present due to redundant 407
predictor features. The Classifier 3 experiment using weighted k-NN algorithm (Table 11, Table 16) evinced an 408
improved prediction accuracy of .72 as compared to the Classifier 1 Experiment, a simple k-NN algorithm 409
Page 28 of 33
implementation with prediction accuracy of .7059.This improvement was seen because giving precedence to 410
nearest neighbors provided a stronger classification Compared to all classifiers except for Classifier 2, Classifier 411
3’s prediction accuracy exhibited a degradation. The Classifier 3 performed worse than all Classifiers except 412
Classifier 1 because feature space was composed of 35 cytokines, some of which were redundant and did not 413
contribute much toward the final classification. Classifier 4 experiment applied weighted k-NN (Table 12,Table 414
16), and was further enhanced when only significant cytokines were used. It achieved a prediction accuracy of 415
.878 that was better than Classifier 1,2, and 3 but worse than Classifier 5,6, and 7. The Classifier 7 experiment 416
with Random forest (Table 13,Table 16) showcased a noteworthy increase in the prediction accuracy, with a 417
value of .8824 compared to k-NN implementations of Classifier 1,2,3, and 4. This was due to the inherent strength 418
of Random Forest that creates multiple decision trees with random feature partition criterion. The degradation of 419
Random forest prediction accuracy due to noisy data is slower compared to k-NN. Classifier 6 experiment (Table 420
14,Table 16) that entailed Random Forest including nine significant cytokines generated a perfect prediction 421
accuracy of 1.00 which surpassed the prediction accuracy of all the other experiments. This was due to the 422
aforementioned strengths of Random forest as well as elimination of noise from the data achieved by dropping 423
redundant predictor features. The final Classifier 7 experiment (Table 15,Table 16) which implemented k-NN 424
using the Canberra distance provided exceptionally good prediction accuracy of .9231 which was better than all 425
the other Classifiers except Classifier 7,even though cross validation was not used for it. 426
Random Forest with significant cytokines (Classifier 6 Experiment) overall proved to be the best ML 427
classification technique as it provided a 100% prediction accuracy in conjunction with a 100% of Specificity 428
,Sensitivity and AUC. To obtain insights pertaining to the contributions of individual cytokines that generated a 429
perfect prediction accuracy, an evaluation was performed that delineated the attributable accountability on a scale 430
of zero to 100. As per the results recorded in Classifier 6 Experiment (Figure 3), it was observed that amongst 431
the significant cytokines differentiated by CAD and Control, IL1-β and IL-10 (Figure 14) were the most 432
prominent predictor cytokines that can be held accountable for the outstanding evaluation measures. To further 433
explore the existing interrelationships between the significant cytokines that were predominantly responsible for 434
the classification, a correlation matrix (Figure 15) was constructed and the significant correlations were identified 435
using the significance threshold value of α-value =.05. It was very interesting to see that the major classification 436
contributors, IL1-β and IL-10, were moderately positively correlated (r=.51, Fig. 15) with each other. IL-10 is 437
considered anti-inflammatory and IL1-β is considered to play an anti-inflammatory role. [5] [20] [21]. 438
Individually, IL-10 exhibited a weak though significantly negative correlation with IL-12 (r=-.26,Fig. 15) and a 439
weak though significantly positive correlation with GM-CSF(r=.23 , Fig. 15). Additionally, IL-4(r=.19 ,Fig. 15) 440
Page 29 of 33
. IL1-β showed a weak though significantly positive correlation (r=.29,Fig. 15) with Eotaxin and a weak, though 441
significant negative correlation with IL1-α(r=-.21,Fig. 15). 442
Conclusions 443
This research uniquely implements the usage of cytokine plasma biomarkers to differentiate CAD from Control 444
cases. Additionally, it emphasizes the exploratory paradigm of multiple classifier experiments that show improved 445
prediction accuracy across different models. The diverse k-NN distance measures were compared in terms of 446
efficacy as well as juxtaposed relative to the performance of Random Forest algorithm. Overall, the use of 447
significant cytokines improves the prediction accuracy across all algorithmic experiments since this distinction 448
eliminates noisy data and identifies the key biomarkers used for the final classification. The insignificant cytokines 449
degraded the performance of k-NN which is sensitive to noise though Random Forest was minimally affected. As 450
compared to prior research studies [6], [9] that used Random Forest with cytokines to differentiate disease groups 451
from control groups, our study exhibited better prediction accuracy(100%) and AUC measures. The improved 452
accuracy is attributable to the preselection of cytokines that were significant across CAD versus Control as well 453
as the use of resampling cross validation. 454
The current research prediction accuracy for noisy data obtained using different k-NN experimental setups was 455
better than the methodology employed in the diabetes case study [10] . The Random Forest implementation 456
specifically with significant cytokines provided 100% prediction accuracy outperforming the previous research 457
studies [22]. Finally, our observations implement the Canberra similarity distance metric in the context of the k-458
NN algorithm, a perspective rarely used in prior research. It also demonstrates a better prediction accuracy than 459
even Random Forest with cross validation. The Canberra distance used in this research study outperformed 460
numerous experimental models for this study in conjunction with previous studies using k-NN with other distance 461
measures [10] [12]. The statistical measures such as correlation coefficient and t tests help identify the complex 462
interactions of the cytokines and narrow the cytokines that are significant in the classification of CAD versus 463
Control. 464
The main challenge in deciding upon Machine Learning is the trade-off between interpretability and predictive 465
accuracy. Overall, both k-NN and Random Forest gave reasonably good results. Therefore, the algorithm choice 466
depends on contrasting factors such as simple versus complex algorithm, easy to implement versus difficult to 467
implement, and almost perfect accuracy versus reasonable accuracy. Both k-NN and Random Forest balance the 468
trade off with regards to interpretability, but Random Forest provided superior prediction accuracy metrics. 469
In this age of innovation and all-pervasive machine learning systems, it is important to leverage the abstraction, 470
generalization, optimization, and computational power of the versatile Machine Learning algorithms that can be 471
used across a wide spectrum of domain areas. From the computational standpoint, the distance measures like 472
Page 30 of 33
Canberra, Cosine, and Correlation can be explored for k-NN, optimized by parameter fine-tuning, and widely 473
proven resampling techniques like Bootstrap and cross-validation. 474
Contemporary research indicates that numerous biological factors contribute to risk of CAD including individual 475
molecular species of lipoproteins, oxidative stress, and genetic determinants of inflammation and coagulopathy, 476
among others. The analytical mathematical techniques emerging from this research will permit the analysis of a 477
much broader array of factors, including their mutual interaction in the appreciation of risk of CAD. The inclusion 478
of a broad array of cytokines will contribute a new dimension to this analysis that can lead to improved risk 479
prediction and novel therapeutic interventions. 480
Ethics approval and consent to participate 481
This study was approved by the UCSF Institutional Review Board Committee on Human Research and conducted 482
in accordance with the principles of the Declaration of Helsinki, and all subjects provided written informed 483
consent prior to participation. 484
Consent for publication 485
Not applicable 486
Availability of data and materials 487
The data used for this research comprises confidential patient health information. The data obtained from the Kane 488
laboratory and Genomic Resource in Cardiovascular and Metabolic Disease at UCSF are HIPPA protected and 489
cannot be released publicly. The data, without personal identification, are delineated within the manuscript and 490
we are prepared to answer any questions that researchers might have regarding the data usage for the experimental 491
framework. 492
Abbreviations 493
AUC-ROC: Area Under the Curve-Receiver Operating Characteristics 494
CAD: Coronary Artery Disease 495
FNR: False Negative Rate 496
FP: False Positive 497
k-NN: K Nearest Neighbor 498
ML: Machine Learning 499
TN: True Negative 500
TP: True Positive 501
TPR: True Positive Rate 502
Competing interests 503
Page 31 of 33
The authors report no conflicts of interest. 504
Funding 505
This research was supported by the NIH under Ruth L. Kirschstein National Research Service Award 506
2T32HL007731-26 from the Department of Health and Human Services Public Health Services (KTC). 507
Additional support was provided by the Read Foundation Charitable Trust and the Campini Foundation (JPK). 508
Authors' contributions 509
SEEMA conceived the data mining discovery plan, implemented the Machine learning algorithm, and wrote the 510
paper. PANKAJ provided valuable advice with regards to Statistical and Machine Learning technical details. 511
KATE conceptualized, supervised, and performed lab experiments, and provided the relevant data details. JAMES 512
conducted the lab experiments and helped coordinate the research collaboration. EVELINE, MARY, and JOHN 513
collected the clinical data and provided expertise from the biomedical perspective to direct the experimental 514
research framework that resulted in extracting the final insights. 515
All authors helped with the analysis and preparation of the Manuscript. They have read and approved the final 516
manuscript. 517
Acknowledgements 518
Not applicable. 519
References 520
[1] “Cardiovascular Diseases (CVDs).” World Health Organization, World Health Organization,
www.who.int/news-room/fact-sheets/detail/cardiovascular-diseases-(cvds).".
[2] "Namara, Kevin Mc, et al. “Cardiovascular Disease as a Leading Cause of Death: How Are
Pharmacists Getting Involved?” Integrated Pharmacy Research and Practice, Volume 8,
2019, pp. 1–11., doi:10.2147/iprp.s133088.".
[3] "Hastie, Trevor, et al. The Elements of Statistical Learning: Data Mining, Inference, and
Prediction. Springer, 2017.".
[4] "Zhang, Jun-Ming, and Jianxiong An. “Cytokines, Inflammation, and Pain.” International
Anesthesiology Clinics, vol. 45, no. 2, 2007, pp. 27–37.,
doi:10.1097/aia.0b013e318034194e.".
[5] "Dinarello, Charles A. “Historical Insights into Cytokines.” European Journal of
Immunology, U.S. National Library of Medicine, Nov. 2007,
www.ncbi.nlm.nih.gov/pmc/articles/PMC3140102/.".
[6] "Yu, Linghua, et al. “Inflammatory Profiles Revealed the Dysregulation of Cytokines in
Adult Patients of HFMD.” International Journal of Infectious Diseases, vol. 79, 2019, pp.
12–20., doi:10.1016/j.ijid.2018.11.001.".
Page 32 of 33
[7] "Thompson, Peter L., and S. Mark Nidorf. “Anti-Inflammatory Therapy with Canakinumab
for Atherosclerotic Disease: Lessons from the CANTOS Trial.” Journal of Thoracic Disease,
vol. 10, no. 2, 2018, pp. 695–698., doi:10.21037/jtd.2018.01.119.".
[8] "Creasy, Kate Townsend, et al. “Abstract 20918: Cytokines Involved in Arterial Wall
Inflammation Are Transported by High Density Lipoprotein Particles.” Circulation, 9 June
2018, ahajournals.org/doi/10.1161/circ.136.suppl_1.20918.".
[9] "Struck, Nicole S, et al. “Cytokine Profile Distinguishes Children With Plasmodium
Falciparum Malaria From Those With Bacterial Blood Stream Infections.” The Journal of
Infectious Diseases, vol. 221, no. 7, 2019, pp. 1098–1106., doi:10.1093/infdis/jiz587.".
[10] "Kandhasamy, J. Pradeep, and S. Balamurali. “Performance Analysis of Classifier Models to
Predict Diabetes Mellitus.” Procedia Computer Science, vol. 47, 2015, pp. 45–51.,
doi:10.1016/j.procs.2015.03.182.".
[11] "Jabbar, M. Akhil, et al. “Classification of Heart Disease Using K- Nearest Neighbor and
Genetic Algorithm.” Procedia Technology, vol. 10, 2013, pp. 85–94.,
doi:10.1016/j.protcy.2013.12.340.".
[12] "Enriko, I Ketut & Suryanegara, Muhammad & Gunawan, Dinda. (2016). Heart disease
prediction system using k-Nearest neighbor algorithm with simplified patient's health
parameters. 8. 59-65.".
[13] "Faizal, Edi, and Hamdani Hamdani. “Weighted Minkowski Similarity Method with CBR for
Diagnosing Cardiovascular Disease.” International Journal of Advanced Computer Science
and Applications, vol. 9, no. 12, 2018, doi:10.14569/ijacsa.2018.091244.".
[14] "Saini, Indu, et al. “QRS Detection Using K-Nearest Neighbor Algorithm (KNN) and
Evaluation on Standard ECG Databases.” Journal of Advanced Research, vol. 4, no. 4, 2013,
pp. 331–344., doi:10.1016/j.jare.2012.05.007.".
[15] "Stone, M. “Cross-Validatory Choice and Assessment of Statistical Predictions.” Journal of
the Royal Statistical Society: Series B (Methodological), vol. 36, no. 2, 1974, pp. 111–133.,
doi:10.1111/j.2517-6161.1974.tb00994.x.".
[16] "Fix, E. and Hodges, J.L. (1951). Discriminatory analysis. Nonparametric discrimination;
consistency properties. Technical Report 4, USAF School of Aviation Medicine, Randolph
Field, TX, USA, 1951.".
[17] "Kuhn, M. (2008). Building Predictive Models in R Using the caret Package. Journal of
Statistical Software, 28(5), 1 - 26. doi:http://dx.doi.org/10.18637/jss.v028.i05".
[18] "Wickham H (2016). ggplot2: Elegant Graphics for Data Analysis. Springer-Verlag New
York. ISBN 978-3-319-24277-4, https://ggplot2.tidyverse.org.".
[19] "Taiyun Wei and Viliam Simko (2017). R package "corrplot": Visualization of a Correlation
Matrix (Version 0.84). Available from https://github.com/taiyun/corrplot".
Page 33 of 33
[20] "Dinarello, Charles A. “Overview of the IL-1 Family in Innate Inflammation and Acquired
Immunity.” Immunological Reviews, U.S. National Library of Medicine, Jan. 2018,
www.ncbi.nlm.nih.gov/pmc/articles/PMC5756628/.".
[21] "Iyer, Shankar Subramanian, and Gehong Cheng. “Role of Interleukin 10 Transcriptional
Regulation in Inflammation and Autoimmune Disease.” Critical Reviews in Immunology,
U.S. National Library of Medicine, 2012, www.ncbi.nlm.nih.gov/pmc/articles/PMC341".
[22] "Suvarna, Malini, and Mr.venkategowda N. “Performance Measure and Efficiency of
Chemical Skin Burn Classification Using KNN Method.” Procedia Computer Science, vol. 70,
2015, pp. 48–54., doi:10.1016/j.procs.2015.10.028.".
521
********************** 522