Embed Size (px)
Citation preview
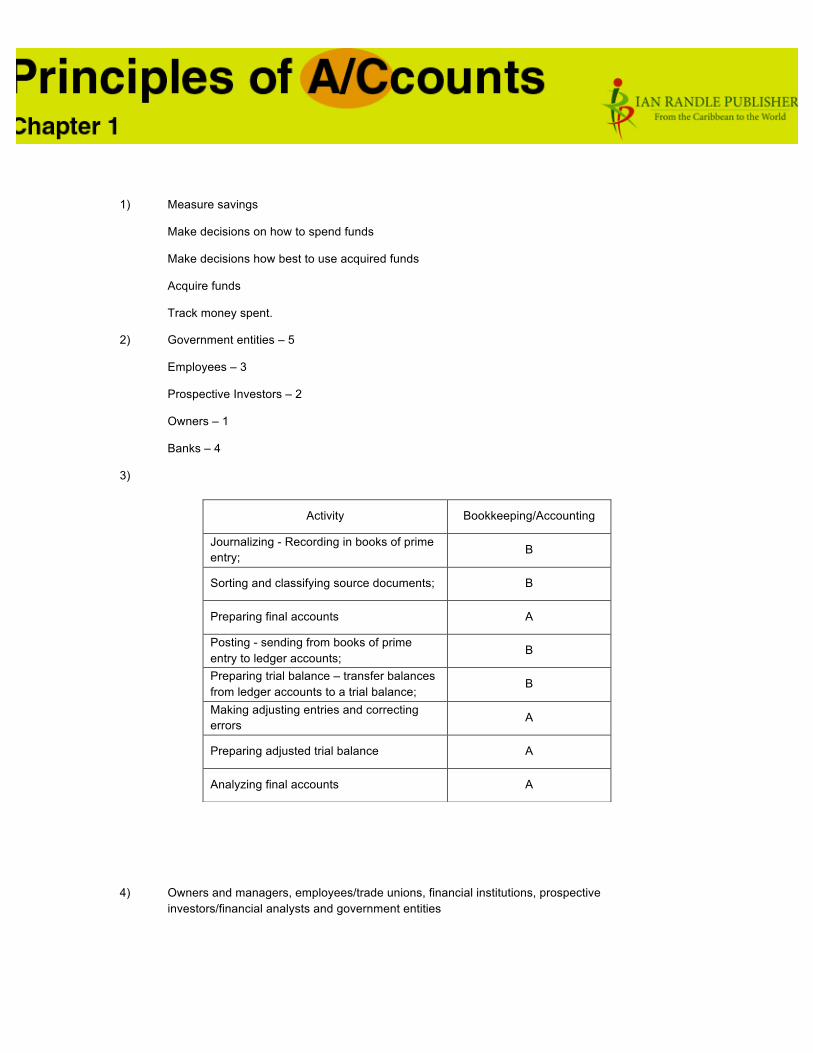
1) Measure savings
Make decisions on how to spend funds
Make decisions how best to use acquired funds
Acquire funds
Track money spent.
2) Government entities – 5
Employees – 3
Prospective Investors – 2
Owners – 1
Banks – 4
3)
4) Owners and managers, employees/trade unions, financial institutions, prospective investors/financial analysts and government entities
Activity Bookkeeping/Accounting
Journalizing - Recording in books of prime entry;
B
Sorting and classifying source documents; B
Preparing final accounts A
Posting - sending from books of prime entry to ledger accounts;
B
Preparing trial balance – transfer balances from ledger accounts to a trial balance;
B
Making adjusting entries and correcting errors
A
Preparing adjusted trial balance A
Analyzing final accounts A

5)
Prepare the Trial Balance 4
Prepare the Trading and Profit & Loss Account
5
Journalise 2
Analyse Source Documents 1
Prepare the Balance Sheet
6
Post to the Ledger 3
Multiple Choice
1. C 2. A 3. A 4. A 5. B
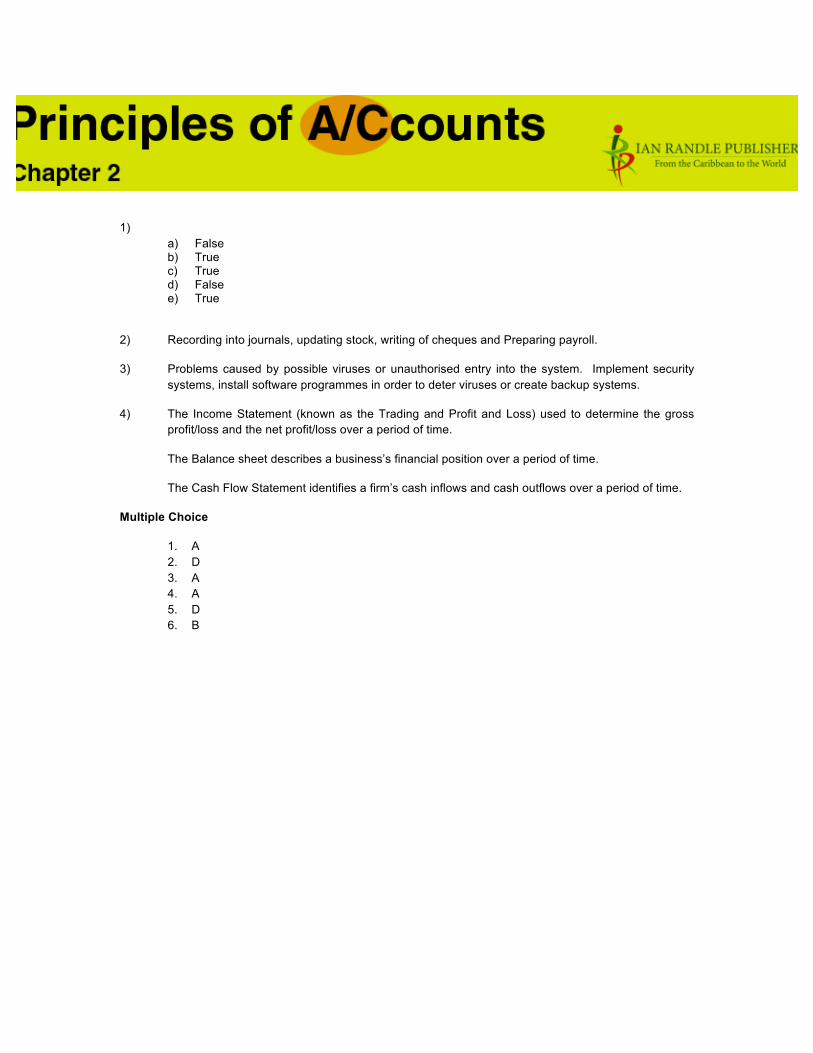
1) a) False b) True c) True d) False e) True
2) Recording into journals, updating stock, writing of cheques and Preparing payroll.
3) Problems caused by possible viruses or unauthorised entry into the system. Implement security systems, install software programmes in order to deter viruses or create backup systems.
4) The Income Statement (known as the Trading and Profit and Loss) used to determine the gross profit/loss and the net profit/loss over a period of time.
The Balance sheet describes a business’s financial position over a period of time.
The Cash Flow Statement identifies a firm’s cash inflows and cash outflows over a period of time.
Multiple Choice
1. A 2. D 3. A 4. A 5. D 6. B

1)
(a) $330 000 (b) $200 000 (c) $600 000 (d) $100 000 (e) $50 000
2) Answers are to be guided by the teacher. 3)
Note: To find the capital the accounting equation formula used is: ASSETS – LIABILITIES which is 30 800 – 7 000 = 23 800.
N. Philip Balance Sheet
As at March 31, 20—
Fixed Assets Office machinery Motor vehicles Furniture and fittings
5 000 10 000
3 000
18 000
Current assets Stock Debtors Cash in hand
6 000 6 000
800
Capital 12 800 30 800 23 800
Current liabilities Creditors Bank loan
2 000 5 000
7 000 30 800
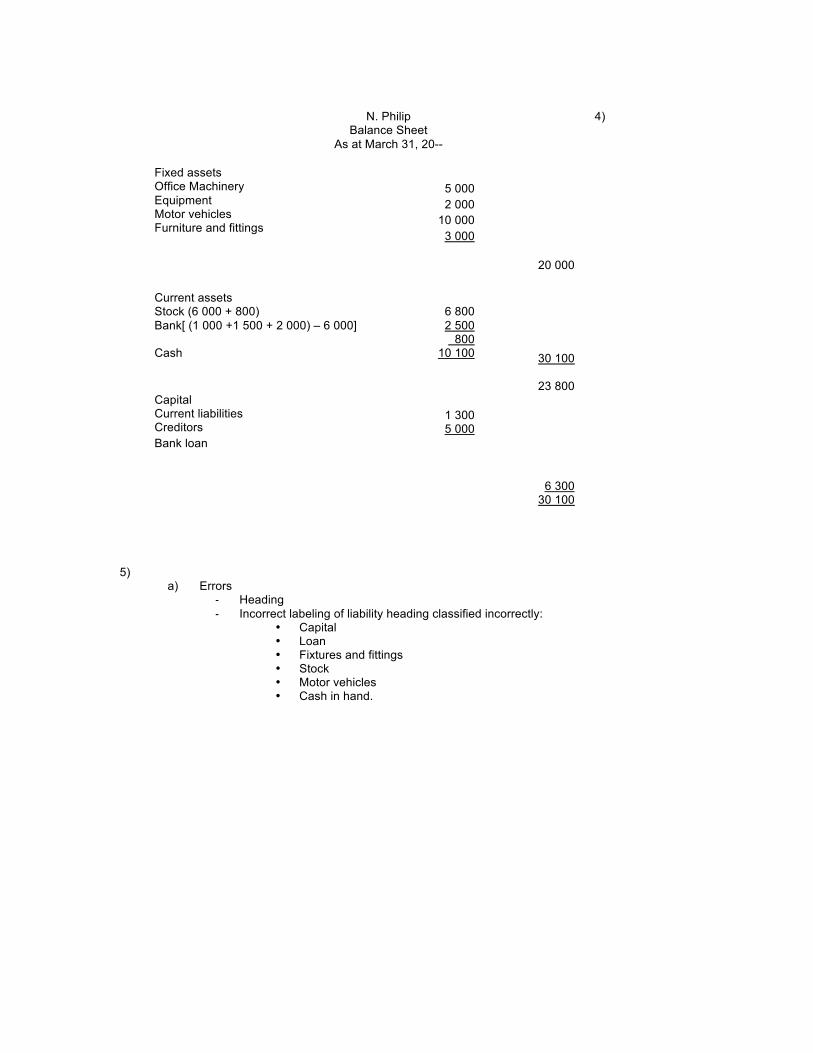
4)
5)
a) Errors - Heading - Incorrect labeling of liability heading classified incorrectly:
• Capital • Loan • Fixtures and fittings • Stock • Motor vehicles • Cash in hand.
N. Philip Balance Sheet
As at March 31, 20--
Fixed assets Office Machinery Equipment Motor vehicles Furniture and fittings
5 000 2 000
10 000 3 000
20 000
Current assets Stock (6 000 + 800) Bank[ (1 000 +1 500 + 2 000) – 6 000] Cash
6 800 2 500 800
10 100
30 100
23 800 Capital Current liabilities Creditors Bank loan
1 300 5 000
6 300
30 100
b)
Multiple Choice
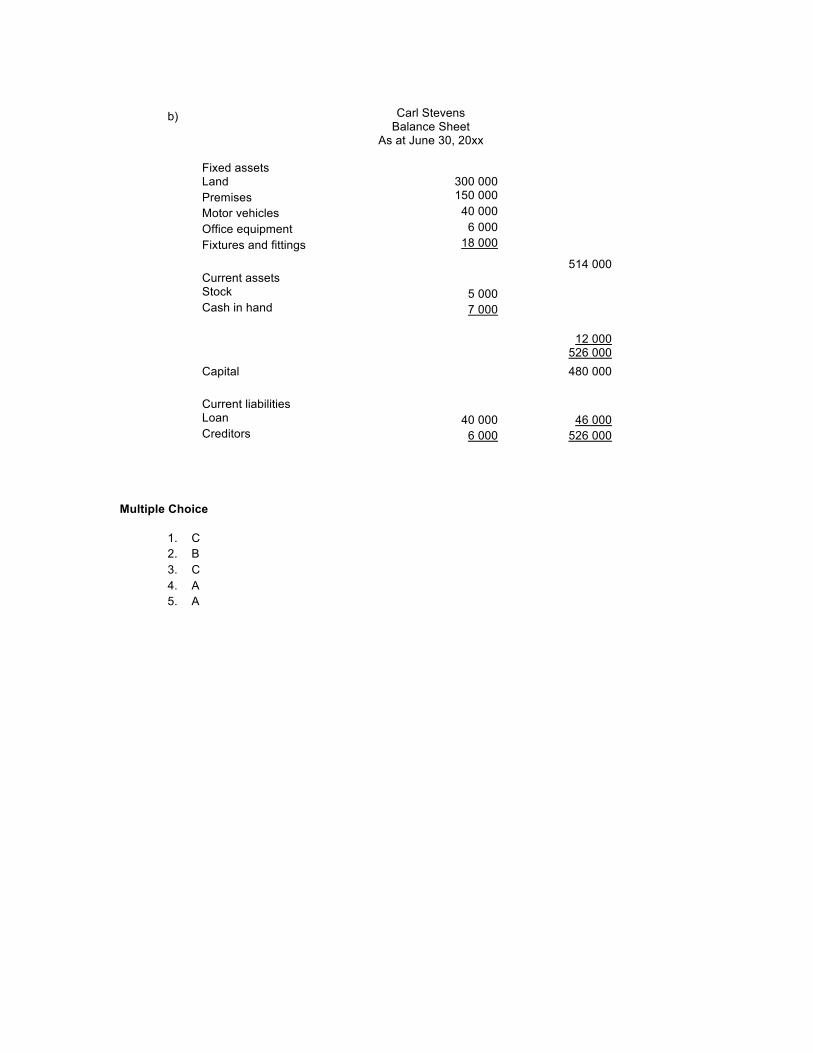
1. C 2. B 3. C 4. A 5. A
Carl Stevens Balance Sheet
As at June 30, 20xx
Fixed assets Land Premises Motor vehicles Office equipment Fixtures and fittings
300 000 150 000
40 000 6 000
18 000
514 000 Current assets Stock Cash in hand
5 000 7 000
12 000 526 000
Capital 480 000
Current liabilities Loan Creditors
40 000
6 000
46 000
526 000
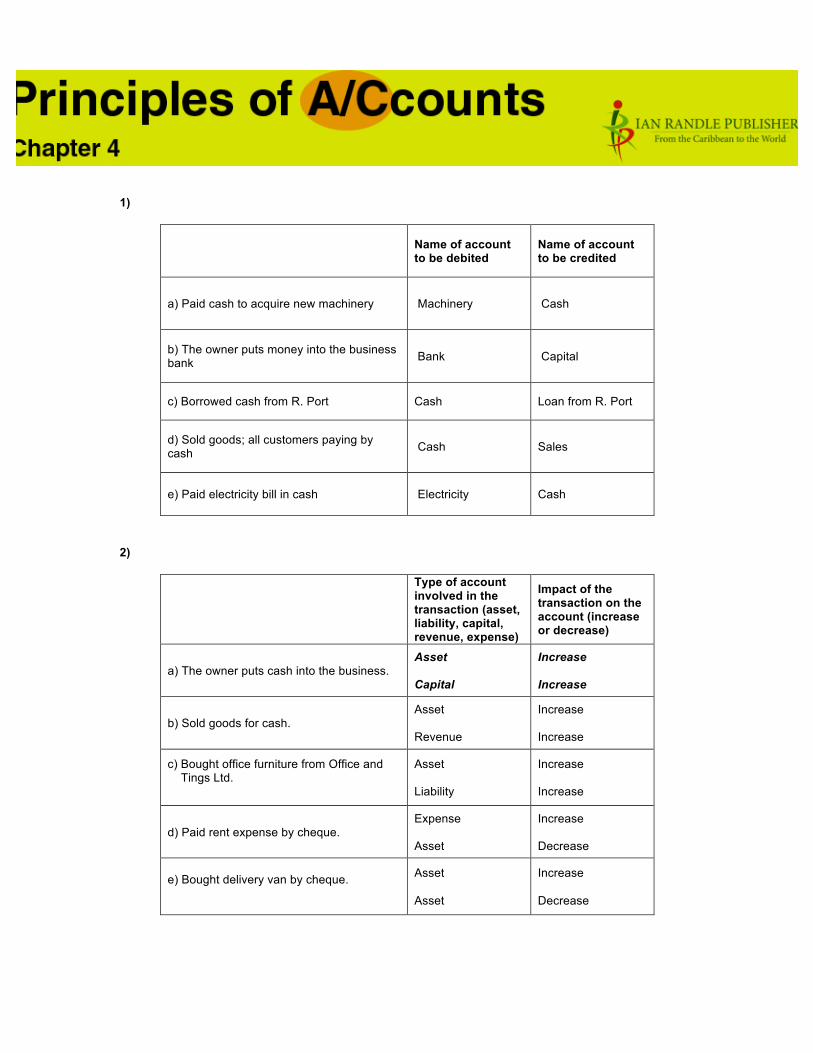
1)
Name of account to be debited
Name of account to be credited
a) Paid cash to acquire new machinery Machinery Cash
b) The owner puts money into the business bank Bank Capital
c) Borrowed cash from R. Port Cash Loan from R. Port
d) Sold goods; all customers paying by cash Cash Sales
e) Paid electricity bill in cash Electricity Cash
2)
Type of account involved in the transaction (asset, liability, capital, revenue, expense)
Impact of the transaction on the account (increase or decrease)
a) The owner puts cash into the business. Asset Capital
Increase Increase
b) Sold goods for cash. Asset Revenue
Increase Increase
c) Bought office furniture from Office and Tings Ltd.
Asset Liability
Increase Increase
d) Paid rent expense by cheque. Expense Asset
Increase Decrease
e) Bought delivery van by cheque.
Asset Asset
Increase Decrease
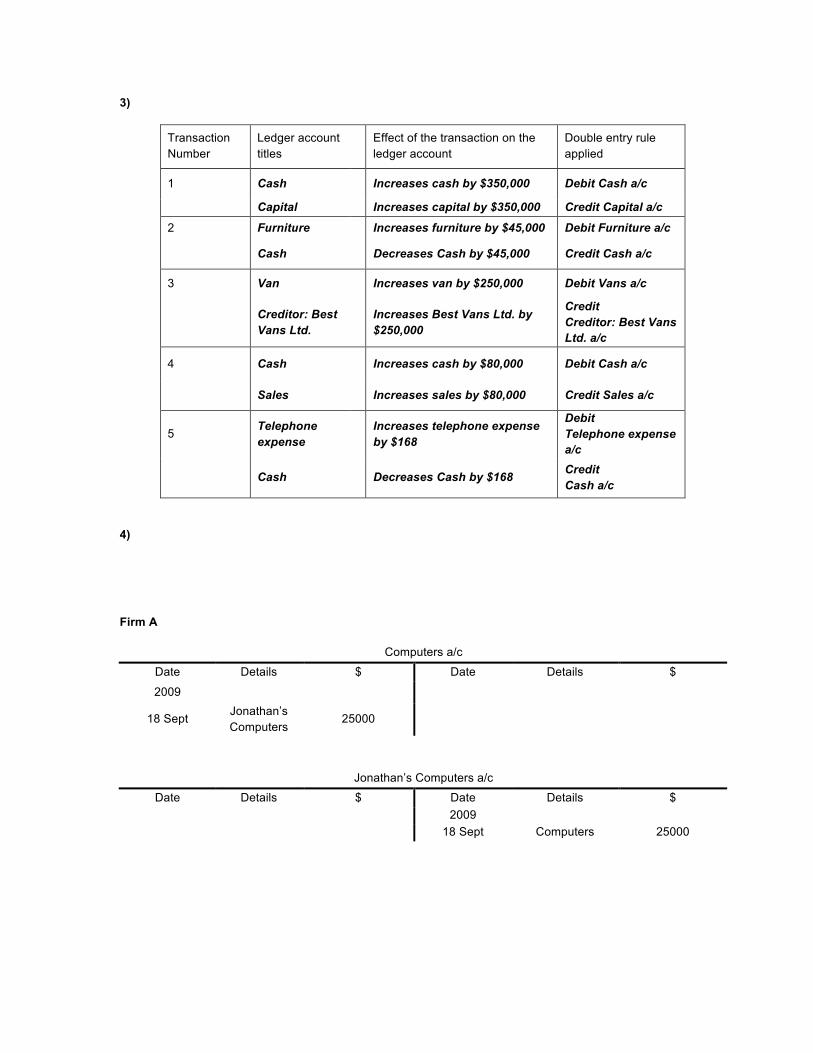
3)
Transaction Number
Ledger account titles
Effect of the transaction on the ledger account
Double entry rule applied
1 Cash Increases cash by $350,000 Debit Cash a/c
Capital Increases capital by $350,000 Credit Capital a/c
2 Furniture Increases furniture by $45,000 Debit Furniture a/c
Cash Decreases Cash by $45,000 Credit Cash a/c
3 Van Increases van by $250,000 Debit Vans a/c
Creditor: Best Vans Ltd.
Increases Best Vans Ltd. by $250,000
Credit Creditor: Best Vans Ltd. a/c
4 Cash Increases cash by $80,000 Debit Cash a/c
Sales Increases sales by $80,000 Credit Sales a/c
5 Telephone expense
Increases telephone expense by $168
Debit Telephone expense a/c
Cash Decreases Cash by $168 Credit Cash a/c
4)
Firm A
Computers a/c
Date Details $ Date Details $
2009
18 Sept Jonathan’s Computers
25000
Jonathan’s Computers a/c
Date Details $ Date Details $ 2009 18 Sept Computers 25000
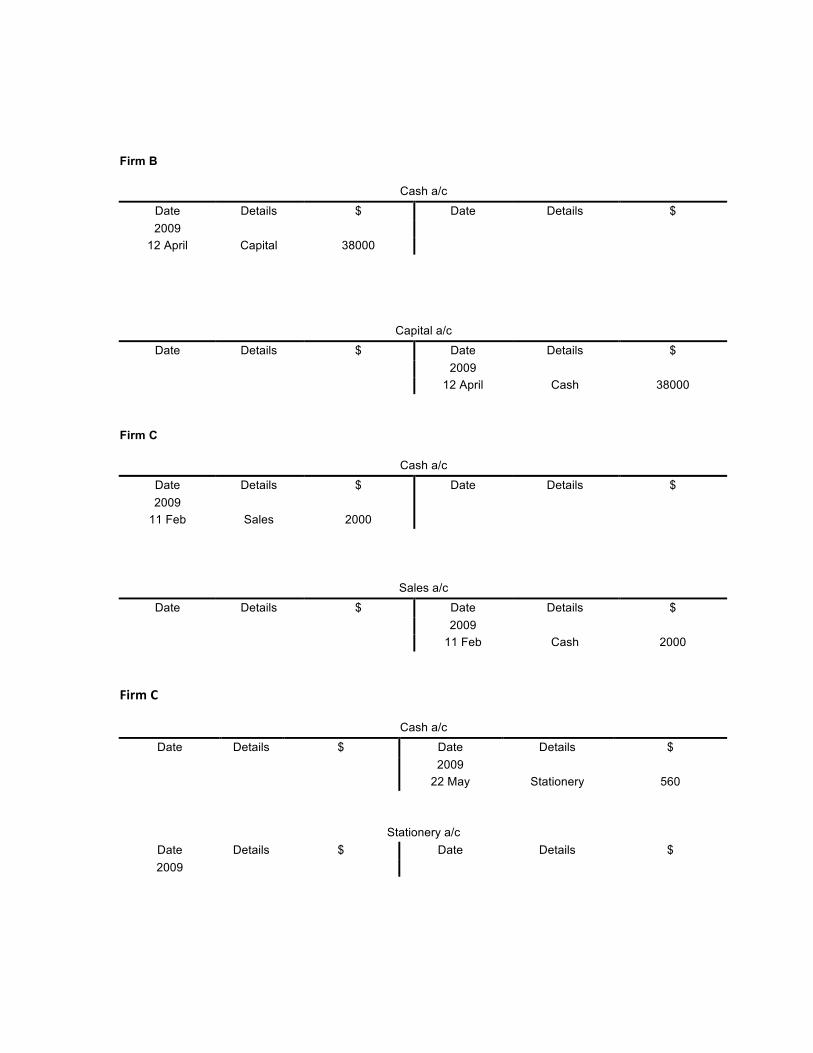
Firm B
Cash a/c
Date Details $ Date Details $ 2009
12 April Capital 38000
Capital a/c
Date Details $ Date Details $ 2009 12 April Cash 38000
Firm C
Cash a/c
Date Details $ Date Details $ 2009
11 Feb Sales 2000
Sales a/c
Date Details $ Date Details $ 2009 11 Feb Cash 2000
Firm C
Cash a/c
Date Details $ Date Details $ 2009 22 May Stationery 560
Stationery a/c Date Details $ Date Details $ 2009
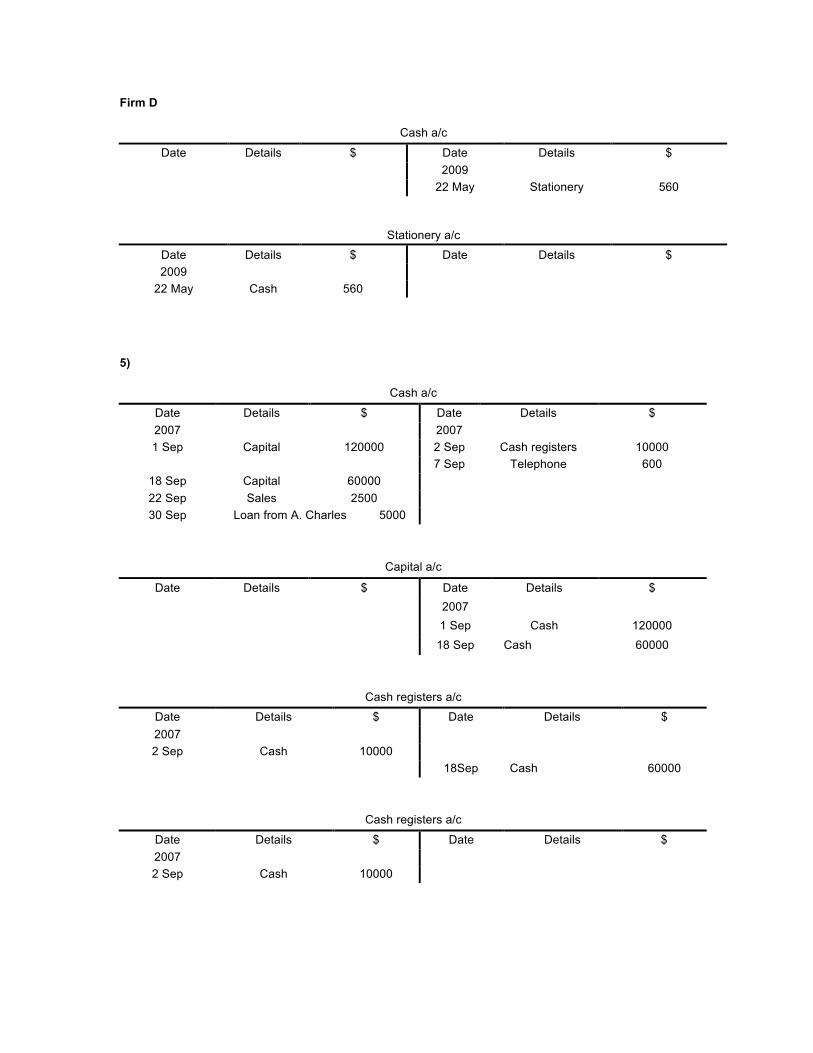
Firm D
Cash a/c
Date Details $ Date Details $ 2009 22 May Stationery 560
Stationery a/c
Date Details $ Date Details $ 2009
22 May Cash 560
5)
Cash a/c
Date Details $ Date Details $ 2007 2007 1 Sep Capital 120000 2 Sep Cash registers 10000
7 Sep Telephone 600 18 Sep Capital 60000 22 Sep Sales 2500 30 Sep Loan from A. Charles 5000
Capital a/c
Date Details $ Date Details $ 2007 1 Sep Cash 120000 18 Sep Cash 60000
Cash registers a/c
Date Details $ Date Details $ 2007 2 Sep Cash 10000
18Sep Cash 60000
Cash registers a/c
Date Details $ Date Details $ 2007 2 Sep Cash 10000
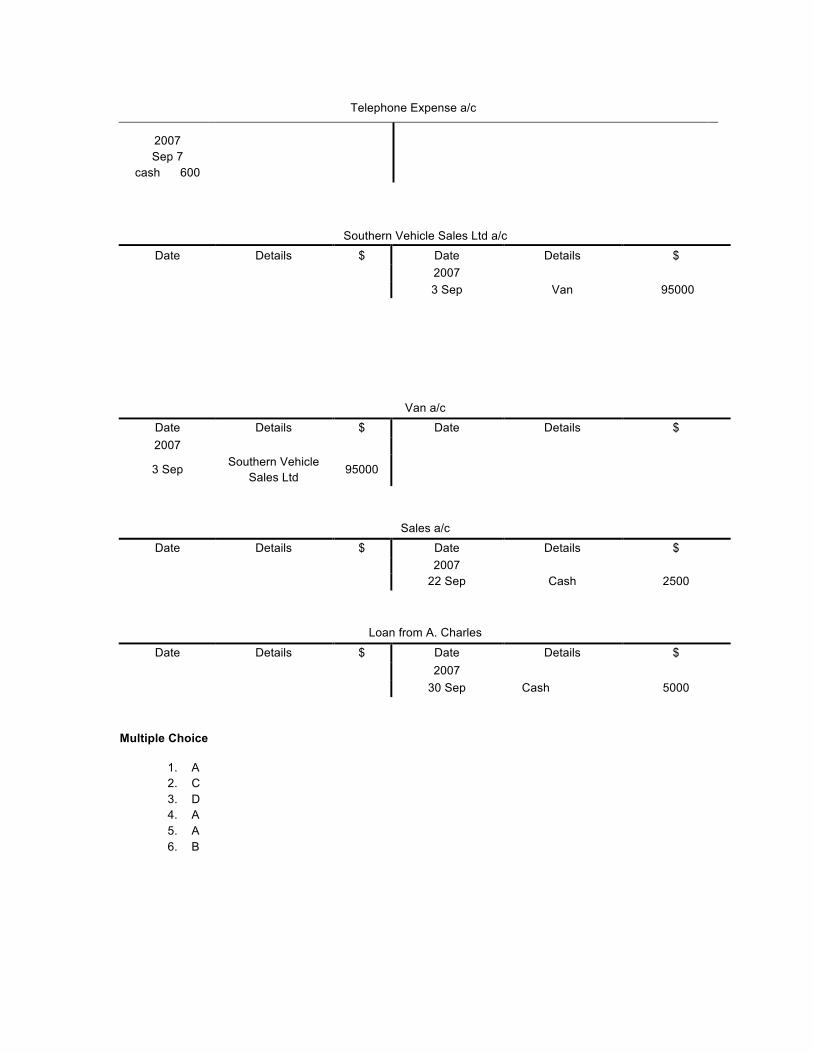
Telephone Expense a/c
2007 Sep 7
cash 600
Southern Vehicle Sales Ltd a/c
Date Details $ Date Details $ 2007 3 Sep Van 95000
Van a/c
Date Details $ Date Details $ 2007
3 Sep Southern Vehicle Sales Ltd
95000
Sales a/c
Date Details $ Date Details $ 2007 22 Sep Cash 2500
Loan from A. Charles
Date Details $ Date Details $ 2007 30 Sep Cash 5000
Multiple Choice
1. A 2. C 3. D 4. A 5. A 6. B
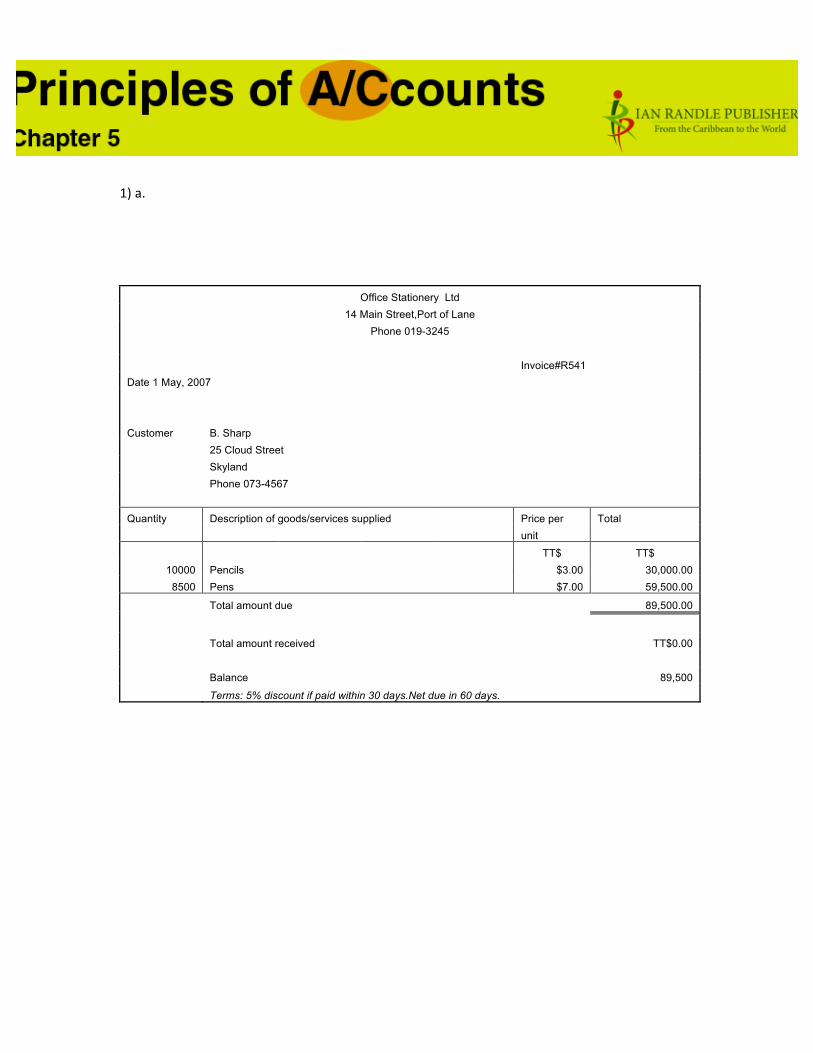
1) a.
Office Stationery Ltd 14 Main Street,Port of Lane
Phone 019-3245 Invoice#R541 Date 1 May, 2007 Customer B. Sharp 25 Cloud Street Skyland Phone 073-4567
Quantity Description of goods/services supplied Price per Total unit
TT$ TT$ 10000 Pencils $3.00 30,000.00
8500 Pens $7.00 59,500.00
Total amount due 89,500.00
Total amount received TT$0.00 Balance 89,500
Terms: 5% discount if paid within 30 days.Net due in 60 days.
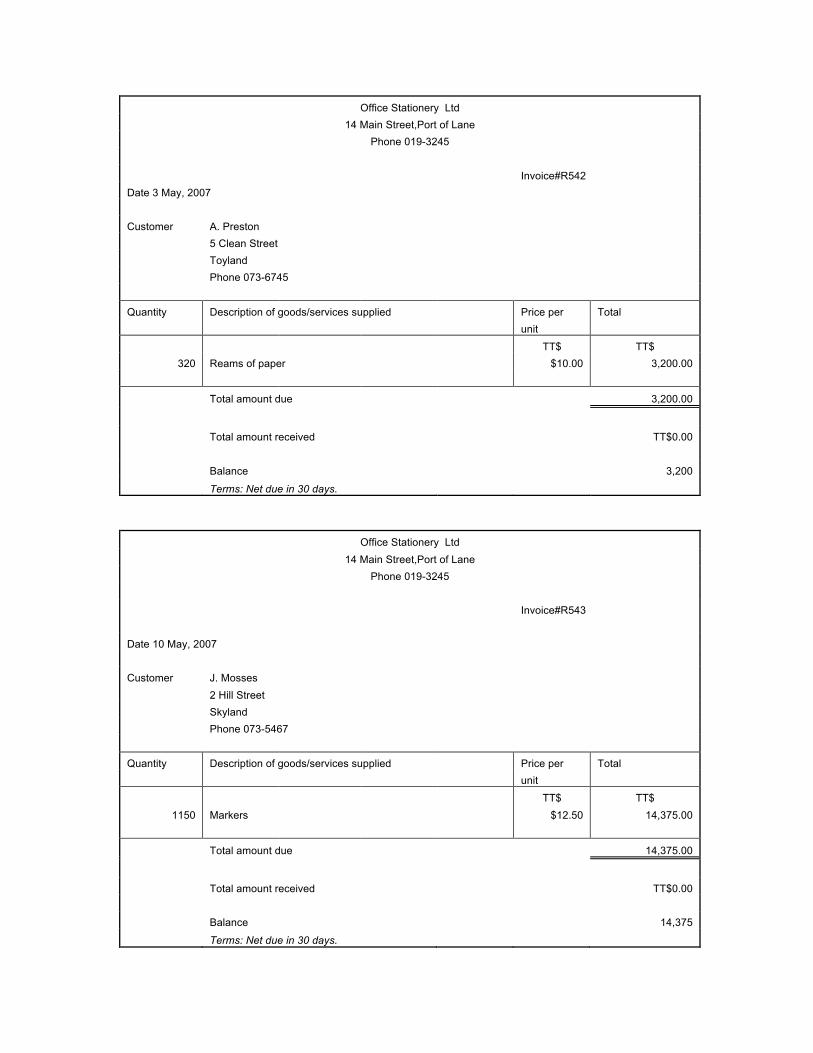
Office Stationery Ltd 14 Main Street,Port of Lane
Phone 019-3245 Invoice#R542 Date 3 May, 2007 Customer A. Preston 5 Clean Street Toyland Phone 073-6745
Quantity Description of goods/services supplied Price per Total unit
TT$ TT$ 320 Reams of paper $10.00 3,200.00
Total amount due 3,200.00
Total amount received TT$0.00 Balance 3,200
Terms: Net due in 30 days.
Office Stationery Ltd 14 Main Street,Port of Lane
Phone 019-3245 Invoice#R543 Date 10 May, 2007 Customer J. Mosses 2 Hill Street Skyland Phone 073-5467
Quantity Description of goods/services supplied Price per Total unit
TT$ TT$ 1150 Markers $12.50 14,375.00
Total amount due 14,375.00
Total amount received TT$0.00 Balance 14,375
Terms: Net due in 30 days.
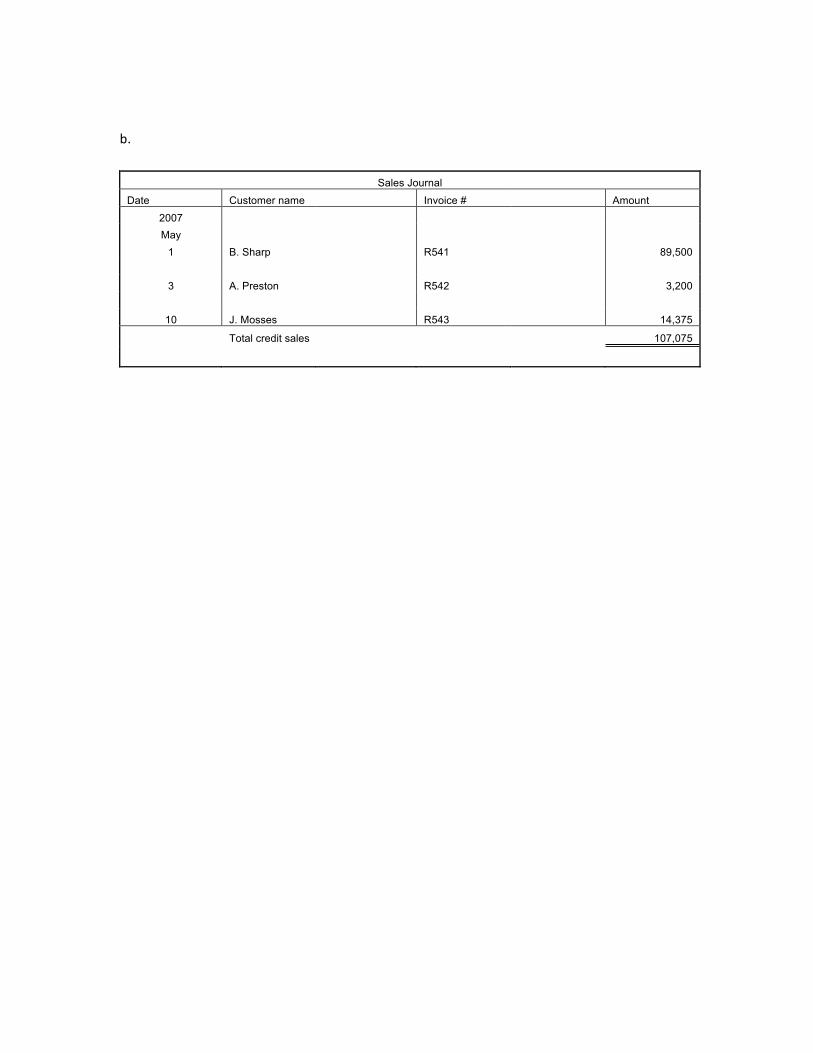
b.
Sales Journal
Date Customer name Invoice # Amount
2007 May
1 B. Sharp R541 89,500 3 A. Preston R542 3,200
10 J. Mosses R543 14,375
Total credit sales 107,075
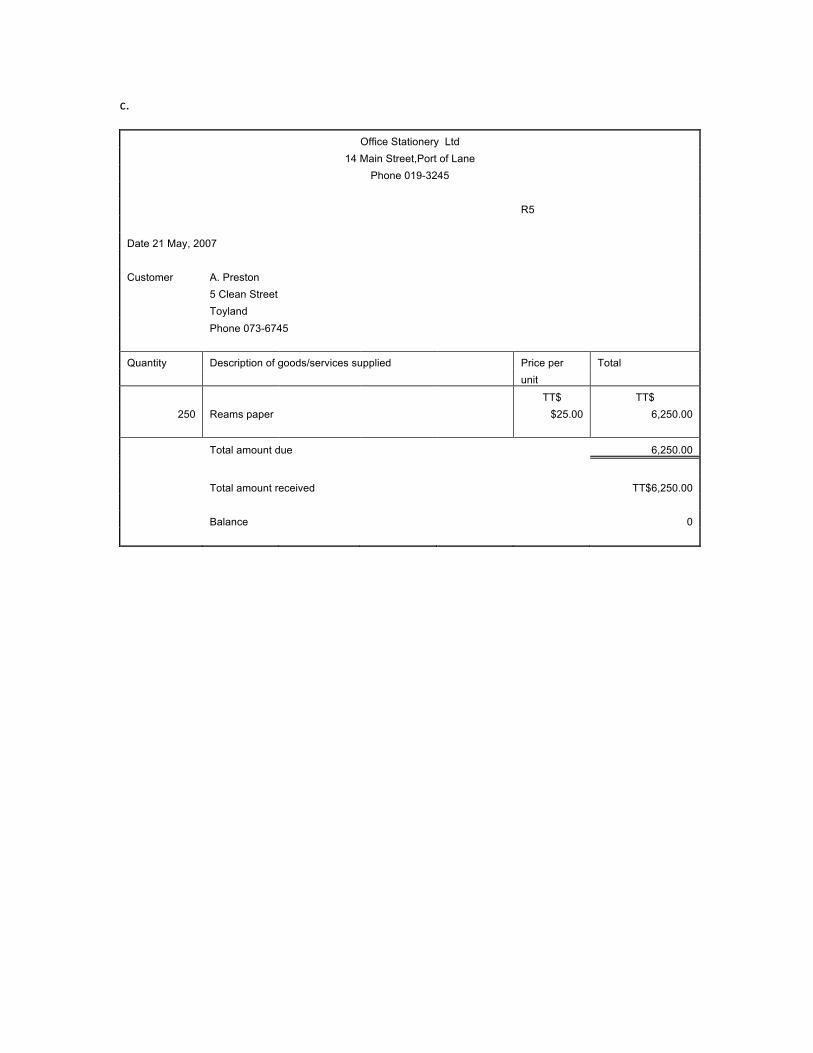
c.
Office Stationery Ltd 14 Main Street,Port of Lane
Phone 019-3245 R5 Date 21 May, 2007 Customer A. Preston 5 Clean Street Toyland Phone 073-6745
Quantity Description of goods/services supplied Price per Total unit
TT$ TT$ 250 Reams paper $25.00 6,250.00
Total amount due 6,250.00
Total amount received TT$6,250.00 Balance 0
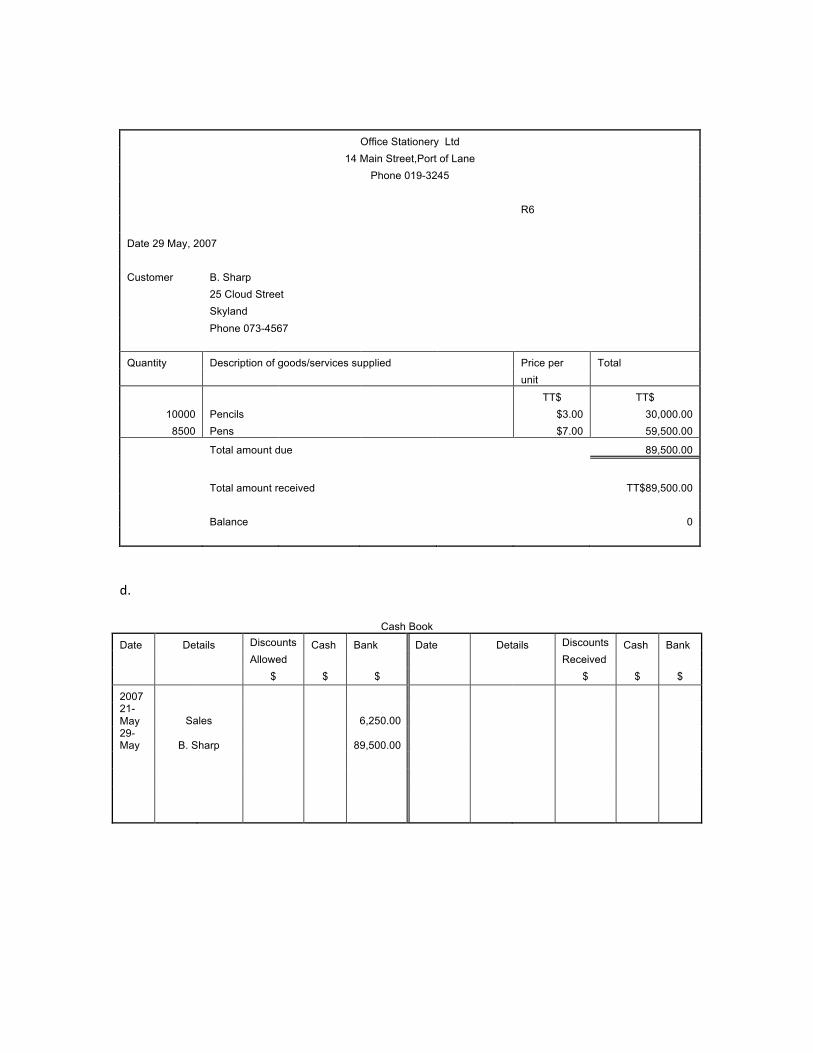
Office Stationery Ltd 14 Main Street,Port of Lane
Phone 019-3245 R6 Date 29 May, 2007 Customer B. Sharp 25 Cloud Street Skyland Phone 073-4567
Quantity Description of goods/services supplied Price per Total unit
TT$ TT$ 10000 Pencils $3.00 30,000.00
8500 Pens $7.00 59,500.00
Total amount due 89,500.00
Total amount received TT$89,500.00 Balance 0
d.
Cash Book
Date Details Discounts Cash Bank Date Details Discounts Cash Bank Allowed Received $ $ $ $ $ $
2007 21-May Sales 6,250.00 29-May B. Sharp 89,500.00
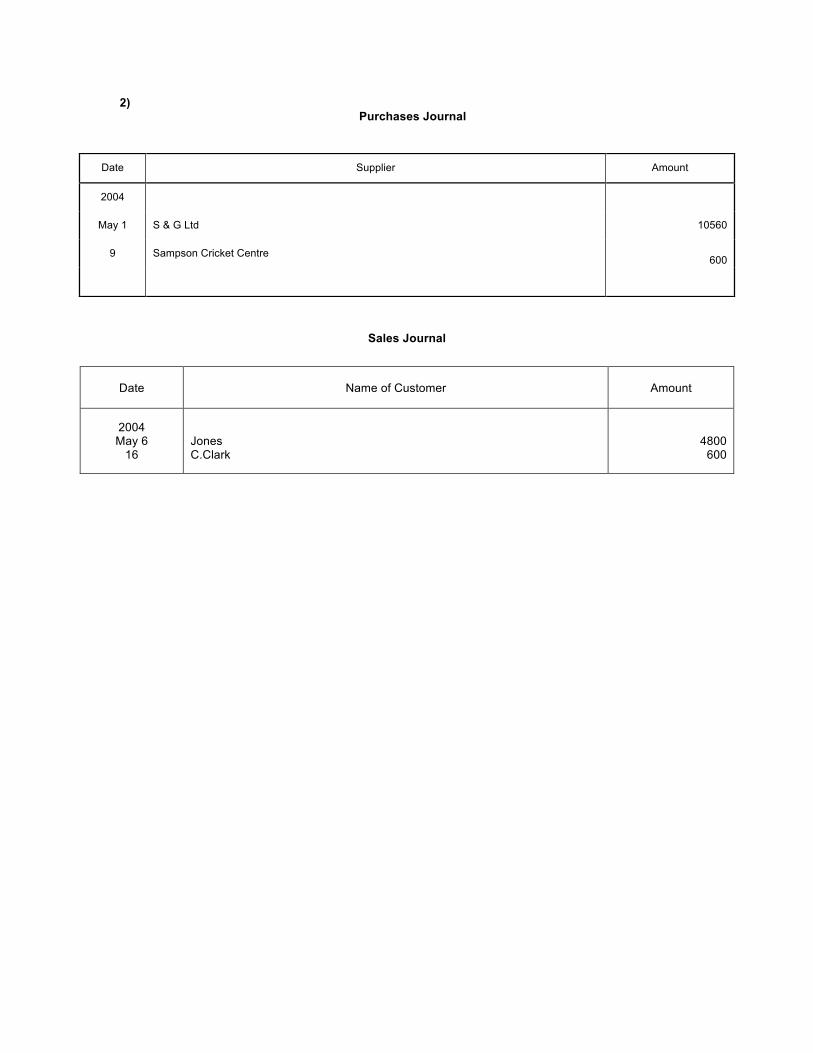
2) Purchases Journal
Sales Journal
Date Supplier Amount
2004
May 1 S & G Ltd 10560
9 Sampson Cricket Centre
600
Date Name of Customer Amount
2004 May 6
16
Jones C.Clark
4800
600
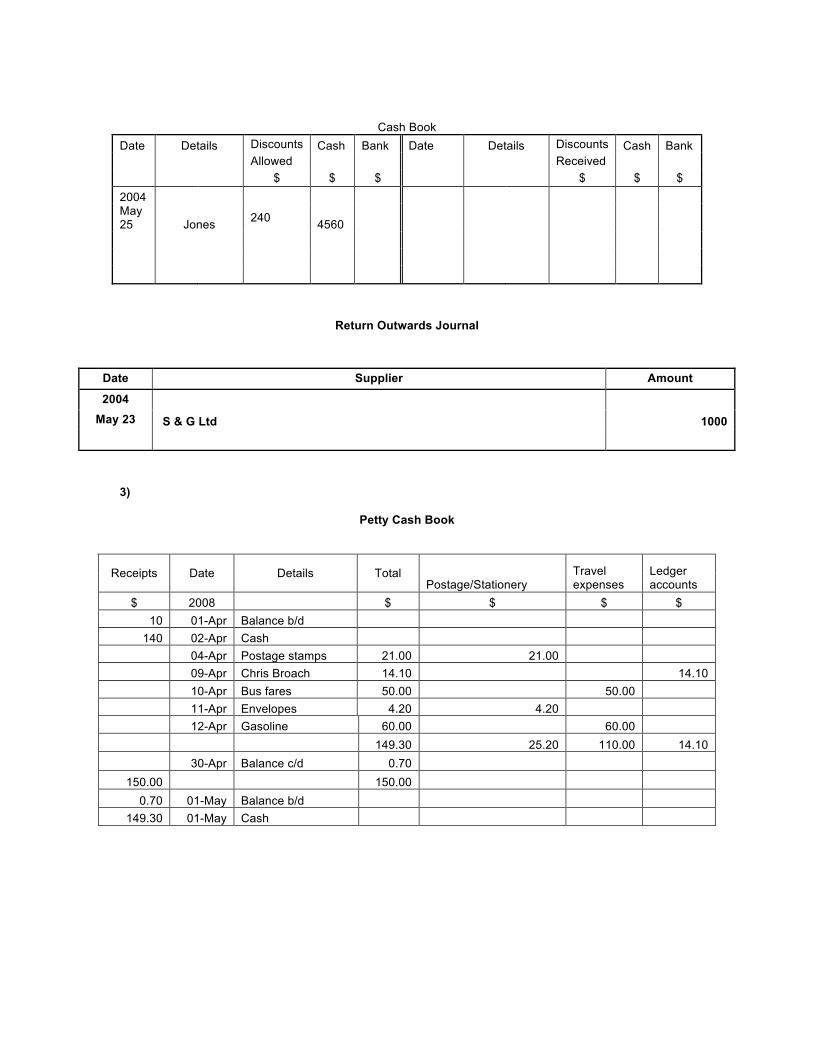
Cash Book Date Details Discounts Cash Bank Date Details Discounts Cash Bank Allowed Received $ $ $ $ $ $ 2004 May 25 Jones 240 4560
Return Outwards Journal
3)
Petty Cash Book
Receipts Date Details Total Postage/Stationery
Travel expenses
Ledger accounts
$ 2008 $ $ $ $ 10 01-Apr Balance b/d
140 02-Apr Cash 04-Apr Postage stamps 21.00 21.00 09-Apr Chris Broach 14.10 14.10 10-Apr Bus fares 50.00 50.00 11-Apr Envelopes 4.20 4.20 12-Apr Gasoline 60.00 60.00 149.30 25.20 110.00 14.10 30-Apr Balance c/d 0.70
150.00 150.00 0.70 01-May Balance b/d
149.30 01-May Cash
Date Supplier Amount
2004 May 23 S & G Ltd 1000
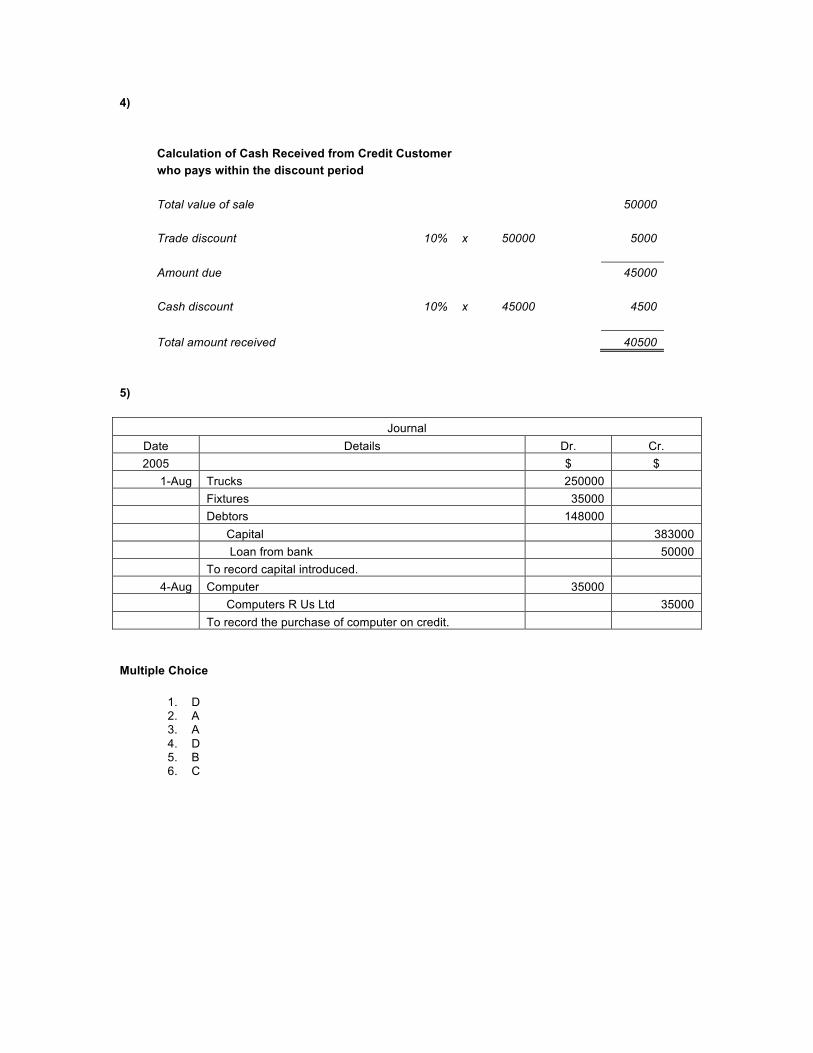
4)
Calculation of Cash Received from Credit Customer who pays within the discount period Total value of sale 50000 Trade discount 10% x 50000 5000 Amount due 45000 Cash discount 10% x 45000 4500 Total amount received 40500
5)
Journal Date Details Dr. Cr. 2005 $ $
1-Aug Trucks 250000 Fixtures 35000 Debtors 148000
Capital 383000 Loan from bank 50000 To record capital introduced.
4-Aug Computer 35000 Computers R Us Ltd 35000 To record the purchase of computer on credit.
Multiple Choice
1. D 2. A 3. A 4. D 5. B 6. C
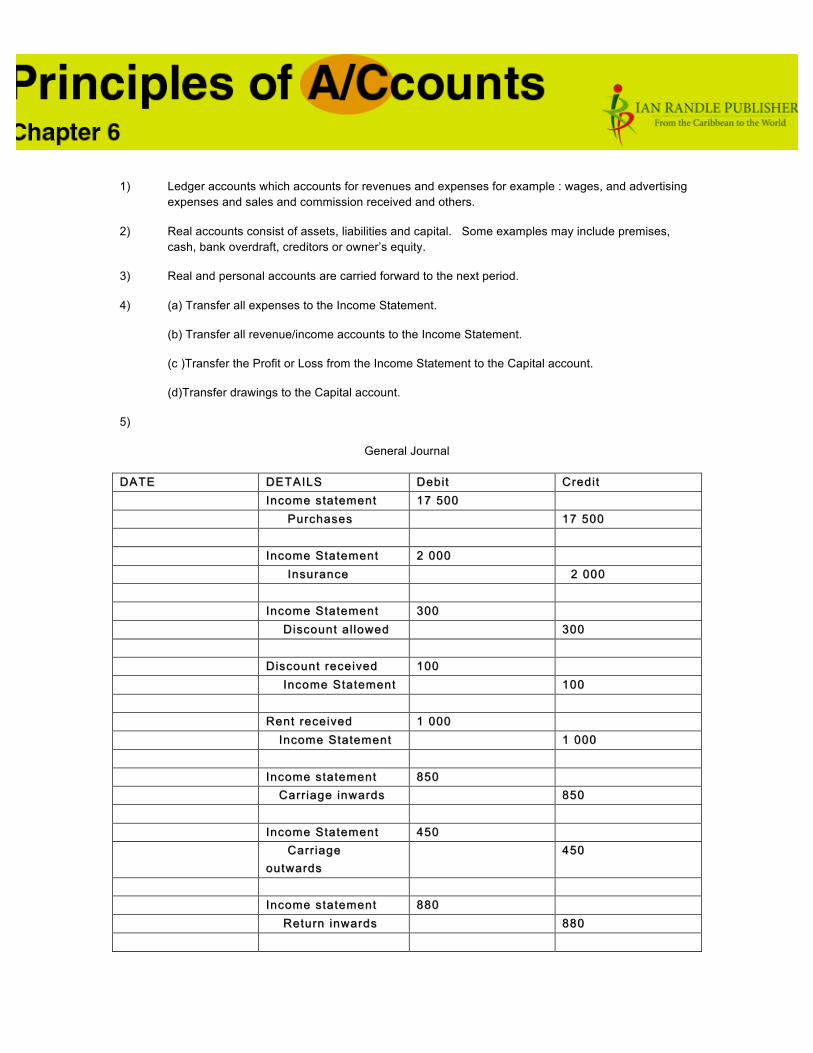
1) Ledger accounts which accounts for revenues and expenses for example : wages, and advertising expenses and sales and commission received and others.
2) Real accounts consist of assets, liabilities and capital. Some examples may include premises, cash, bank overdraft, creditors or owner’s equity.
3) Real and personal accounts are carried forward to the next period.
4) (a) Transfer all expenses to the Income Statement.
(b) Transfer all revenue/income accounts to the Income Statement.
(c )Transfer the Profit or Loss from the Income Statement to the Capital account.
(d)Transfer drawings to the Capital account.
5)
General Journal
DATEDATE DETAILSDETAILS DebitDebit CreditCredit Income statementIncome statement 17 50017 500 Purchases Purchases 17 50017 500 Income StatementIncome Statement 2 0002 000 Insurance Insurance 2 000 2 000 Income StatementIncome Statement 300300 Discount al lowed Discount al lowed 300300 Discount receivedDiscount received 100100 Incom Income Statemente Statement 100100 Rent receivedRent received 1 0001 000 Income Statement Income Statement 1 0001 000 Income statementIncome statement 850850 Carriage inwards Carriage inwards 850850 Income StatementIncome Statement 450450 Carriage Carriage
outwardsoutwards 450450
Income statement Income statement 880880 Return inwards Return inwards 880880
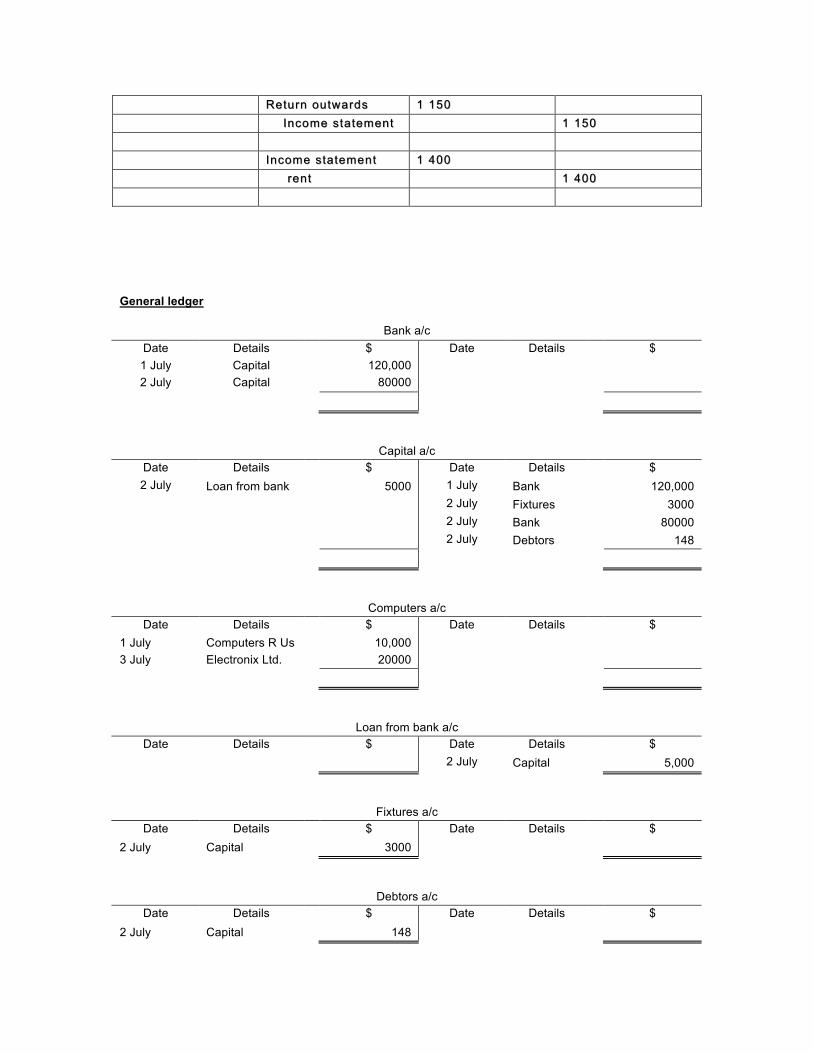
RetuRetu rn outwardsrn outwards 1 1501 150 Income statement Income statement 1 1501 150 Income statementIncome statement 1 4001 400 rent rent 1 4001 400
General ledger
Bank a/c Date Details $ Date Details $ 1 July Capital 120,000 2 July Capital 80000
Capital a/c Date Details $ Date Details $ 2 July Loan from bank 5000 1 July Bank 120,000
2 July Fixtures 3000 2 July Bank 80000 2 July Debtors 148
Computers a/c Date Details $ Date Details $
1 July Computers R Us 10,000 3 July Electronix Ltd. 20000
Loan from bank a/c Date Details $ Date Details $
2 July Capital 5,000
Fixtures a/c Date Details $ Date Details $
2 July Capital 3000
Debtors a/c Date Details $ Date Details $
2 July Capital 148
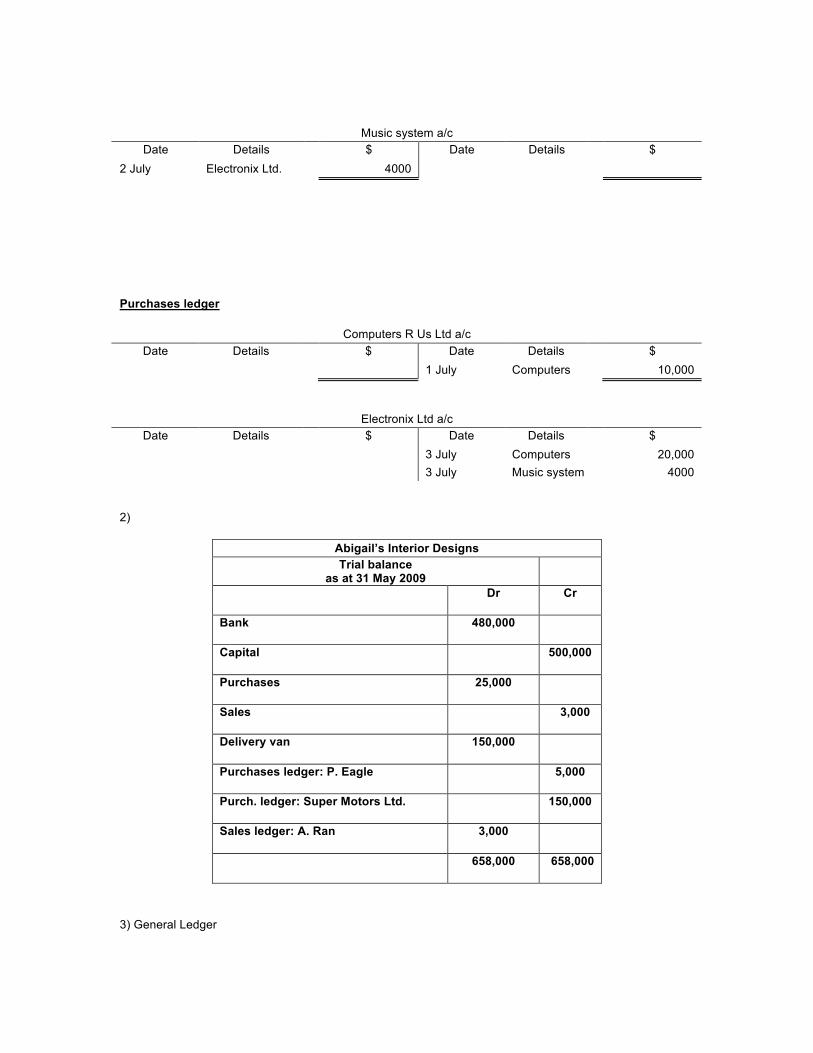
Music system a/c Date Details $ Date Details $
2 July Electronix Ltd. 4000
Purchases ledger
Computers R Us Ltd a/c Date Details $ Date Details $
1 July Computers 10,000
Electronix Ltd a/c Date Details $ Date Details $
3 July Computers 20,000 3 July Music system 4000
2)
Abigail’s Interior Designs Trial balance
as at 31 May 2009 Dr Cr
Bank 480,000
Capital 500,000
Purchases 25,000
Sales 3,000
Delivery van 150,000
Purchases ledger: P. Eagle 5,000
Purch. ledger: Super Motors Ltd. 150,000
Sales ledger: A. Ran 3,000
658,000 658,000
3) General Ledger

Postage/Stationery Date Details $ Date Details $ 2008
30-Apr Petty cash 45.20
Travel expenses Date Details $ Date Details $ 2008
30-Apr Petty cash 85.00
Purchases Ledger
Chris Broach Date Details $ Date Details $ 2008
30 Apr Petty cash 25.10
4.
Sales Journal
DATE CUSTOMER AMOUNT
2008 May 1
3
10
T. James
S. Games
K. Dart
TOTAL CREDIT SALES
5 000
2 000
1 500
$8 500
Sales Ledger
T. James a/c
2008 $ May 1 Sales 5 000
S. Games a/c
2008 $ May 3 Sales 2 000
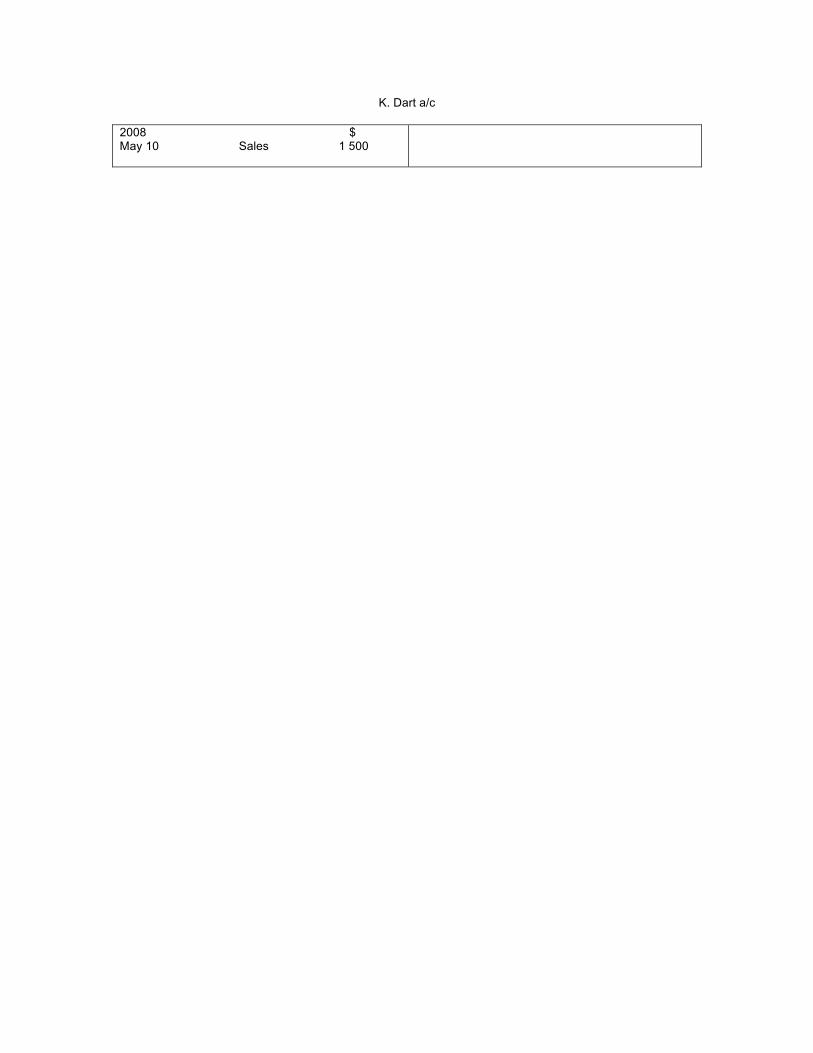
K. Dart a/c
2008 $ May 10 Sales 1 500
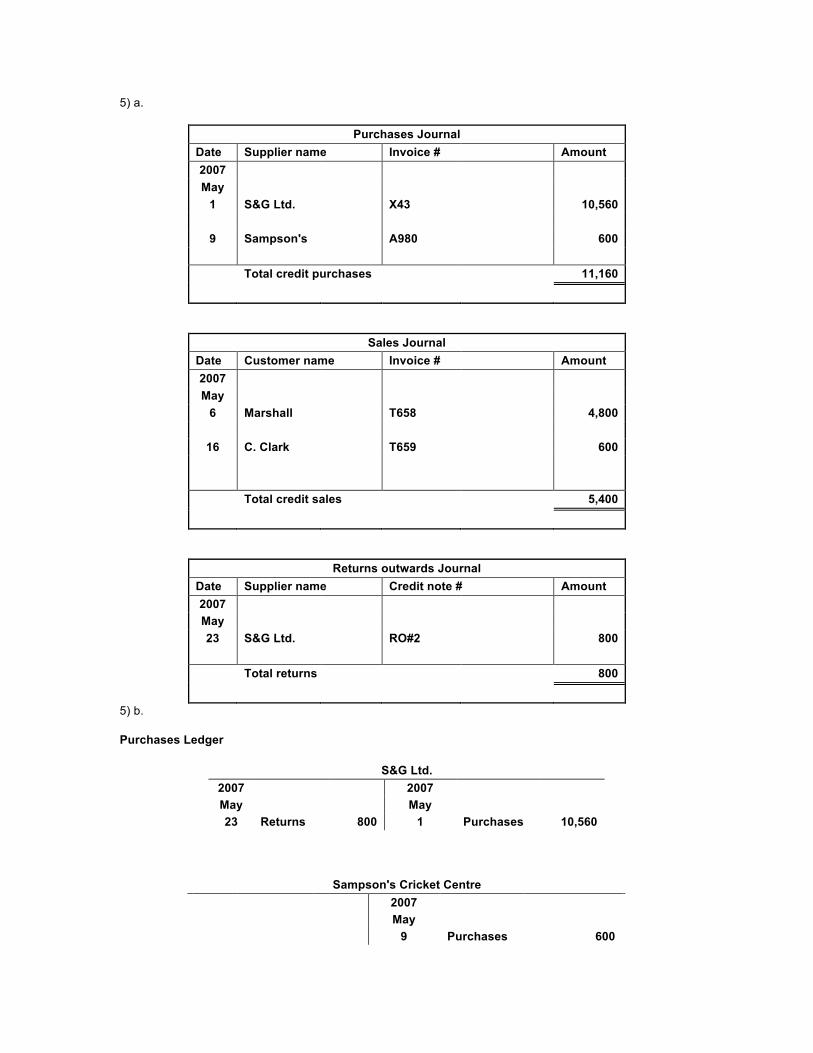
5) a.
Purchases Journal Date Supplier name Invoice # Amount 2007 May
1 S&G Ltd. X43 10,560 9 Sampson's A980 600 Total credit purchases 11,160
Sales Journal Date Customer name Invoice # Amount 2007 May
6 Marshall T658 4,800
16 C. Clark T659 600 Total credit sales 5,400
Returns outwards Journal Date Supplier name Credit note # Amount 2007 May 23 S&G Ltd. RO#2 800 Total returns 800
5) b.
Purchases Ledger
S&G Ltd. 2007 2007 May May 23 Returns 800 1 Purchases 10,560
Sampson's Cricket Centre 2007 May 9 Purchases 600
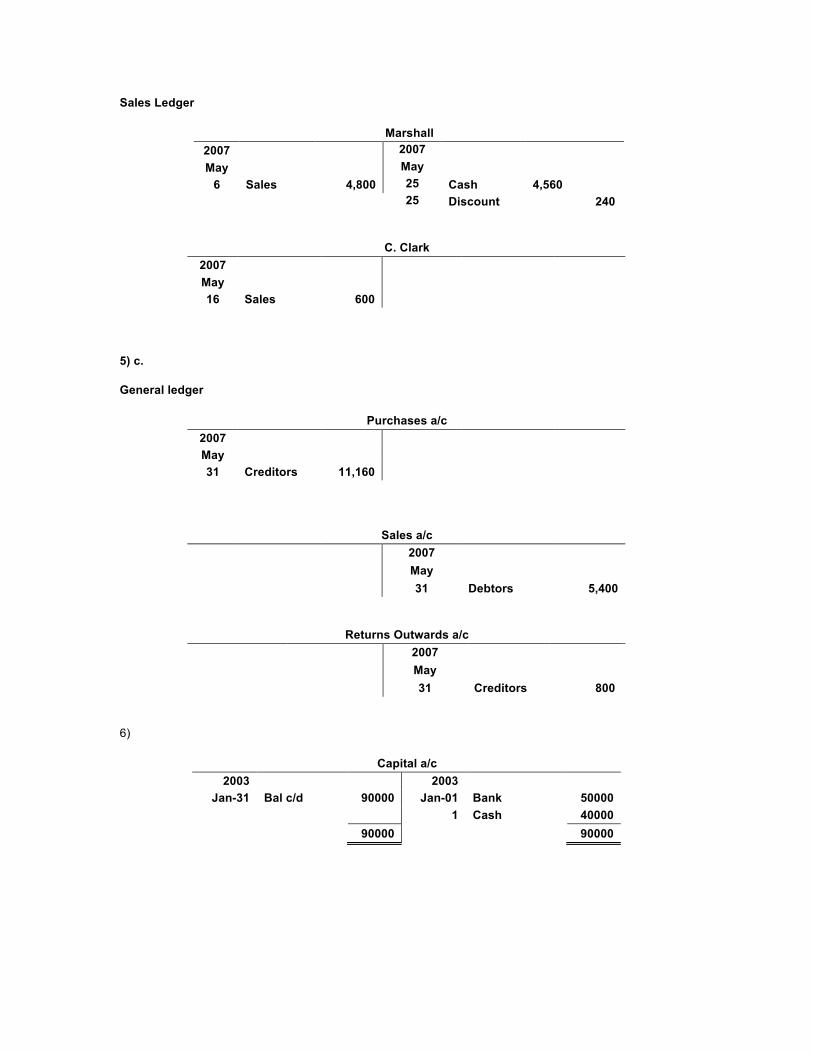
Sales Ledger
Marshall 2007 2007 May May
6 Sales 4,800 25 Cash 4,560 25 Discount 240
C. Clark 2007 May 16 Sales 600
5) c.
General ledger
Purchases a/c 2007 May 31 Creditors 11,160
Sales a/c 2007 May 31 Debtors 5,400
Returns Outwards a/c 2007 May 31 Creditors 800
6)
Capital a/c 2003 2003
Jan-31 Bal c/d 90000 Jan-01 Bank 50000 1 Cash 40000 90000 90000
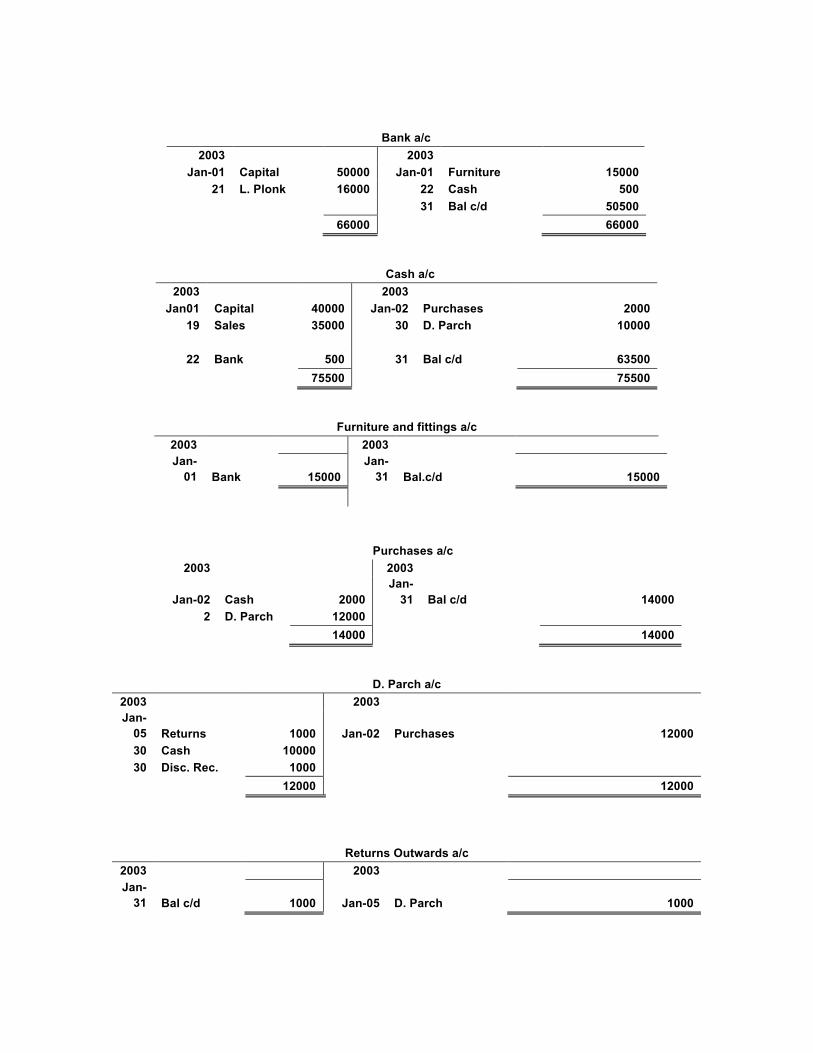
Bank a/c 2003 2003
Jan-01 Capital 50000 Jan-01 Furniture 15000 21 L. Plonk 16000 22 Cash 500
31 Bal c/d 50500 66000 66000
Cash a/c 2003 2003
Jan01 Capital 40000 Jan-02 Purchases 2000 19 Sales 35000 30 D. Parch 10000
22 Bank 500 31 Bal c/d 63500
75500 75500
Furniture and fittings a/c 2003 2003 Jan-
01 Bank 15000 Jan-
31 Bal.c/d 15000
Purchases a/c 2003 2003
Jan-02 Cash 2000 Jan-
31 Bal c/d 14000 2 D. Parch 12000
14000 14000
D. Parch a/c 2003 2003 Jan-
05 Returns 1000 Jan-02 Purchases 12000 30 Cash 10000 30 Disc. Rec. 1000
12000 12000
Returns Outwards a/c 2003 2003 Jan-
31 Bal c/d 1000 Jan-05 D. Parch 1000
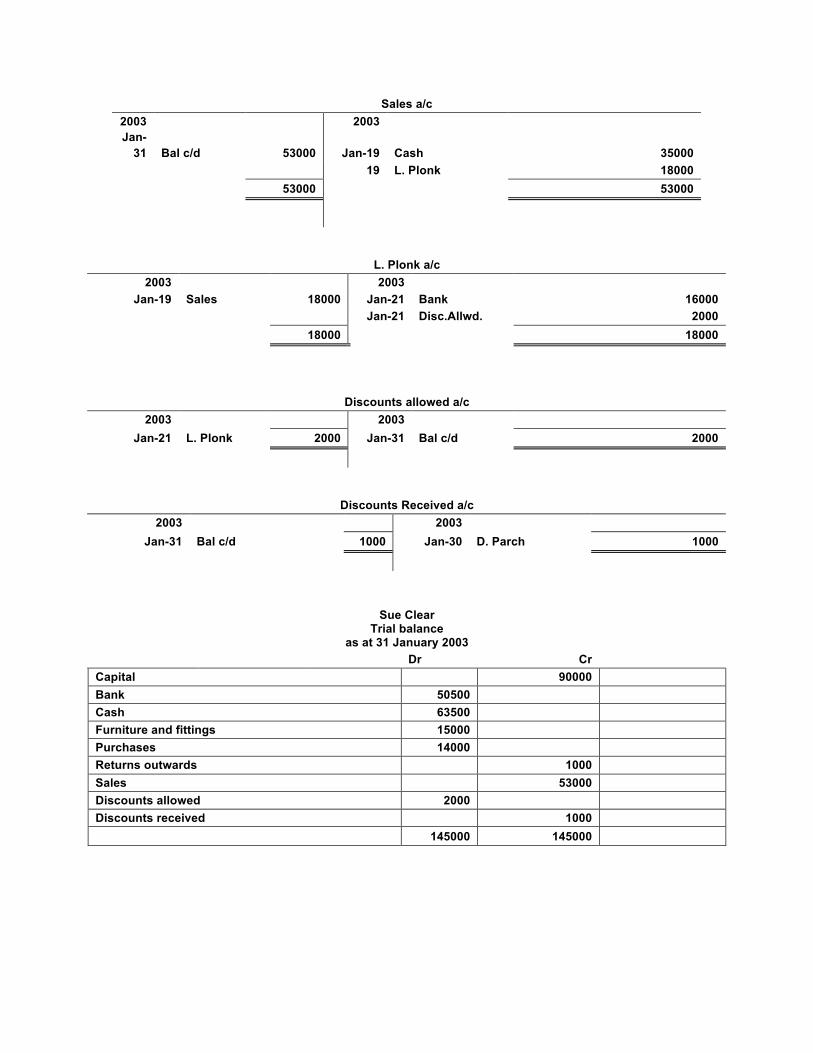
Sales a/c 2003 2003 Jan-
31 Bal c/d 53000 Jan-19 Cash 35000 19 L. Plonk 18000 53000 53000
L. Plonk a/c 2003 2003
Jan-19 Sales 18000 Jan-21 Bank 16000 Jan-21 Disc.Allwd. 2000 18000 18000
Discounts allowed a/c 2003 2003
Jan-21 L. Plonk 2000 Jan-31 Bal c/d 2000
Discounts Received a/c 2003 2003
Jan-31 Bal c/d 1000 Jan-30 D. Parch 1000
Sue Clear Trial balance
as at 31 January 2003 Dr Cr Capital 90000 Bank 50500 Cash 63500 Furniture and fittings 15000 Purchases 14000 Returns outwards 1000 Sales 53000 Discounts allowed 2000 Discounts received 1000 145000 145000

Multiple Choice
1. B 2. C 3. A 4. A 5. B 6. A
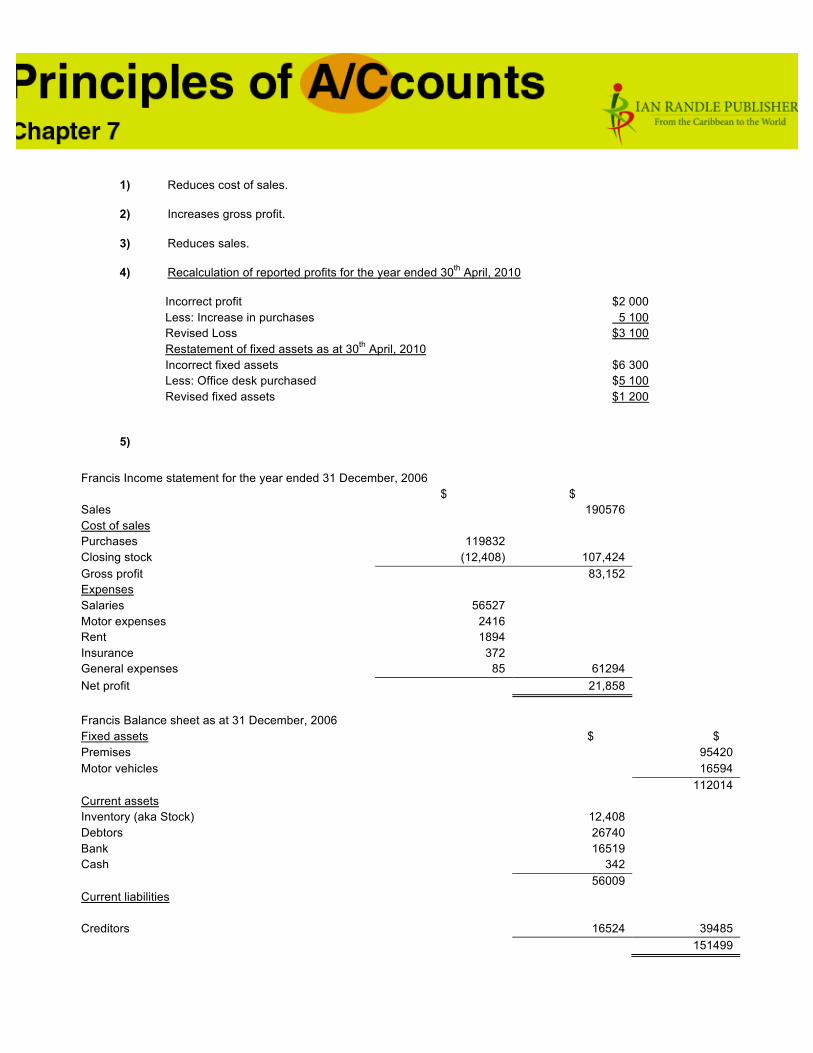
1) Reduces cost of sales.
2) Increases gross profit.
3) Reduces sales.
4) Recalculation of reported profits for the year ended 30th April, 2010
Incorrect profit $2 000 Less: Increase in purchases 5 100 Revised Loss $3 100 Restatement of fixed assets as at 30th April, 2010 Incorrect fixed assets $6 300 Less: Office desk purchased $5 100 Revised fixed assets $1 200
5)
Francis Income statement for the year ended 31 December, 2006 $ $ Sales 190576 Cost of sales Purchases 119832 Closing stock (12,408) 107,424 Gross profit 83,152 Expenses Salaries 56527 Motor expenses 2416 Rent 1894 Insurance 372 General expenses 85 61294 Net profit 21,858 Francis Balance sheet as at 31 December, 2006 Fixed assets $ $ Premises 95420 Motor vehicles 16594 112014 Current assets Inventory (aka Stock) 12,408 Debtors 26740 Bank 16519 Cash 342 56009 Current liabilities
Creditors 16524
39485 151499
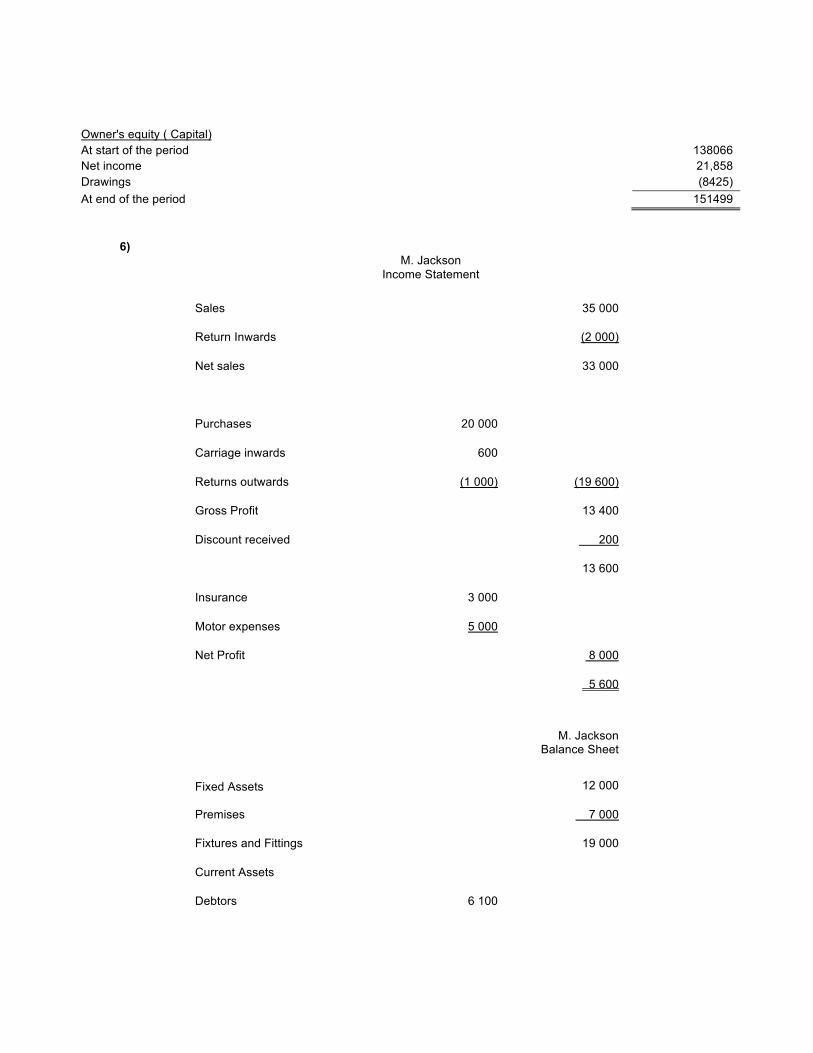
Owner's equity ( Capital) At start of the period 138066 Net income 21,858 Drawings (8425) At end of the period 151499
6) M. Jackson
Income Statement
Sales 35 000
Return Inwards (2 000)
Net sales 33 000
Purchases 20 000
Carriage inwards 600
Returns outwards (1 000) (19 600)
Gross Profit 13 400
Discount received 200
13 600
Insurance 3 000
Motor expenses 5 000
Net Profit 8 000
5 600
M. Jackson Balance Sheet
Fixed Assets 12 000
Premises 7 000
Fixtures and Fittings 19 000
Current Assets
Debtors 6 100
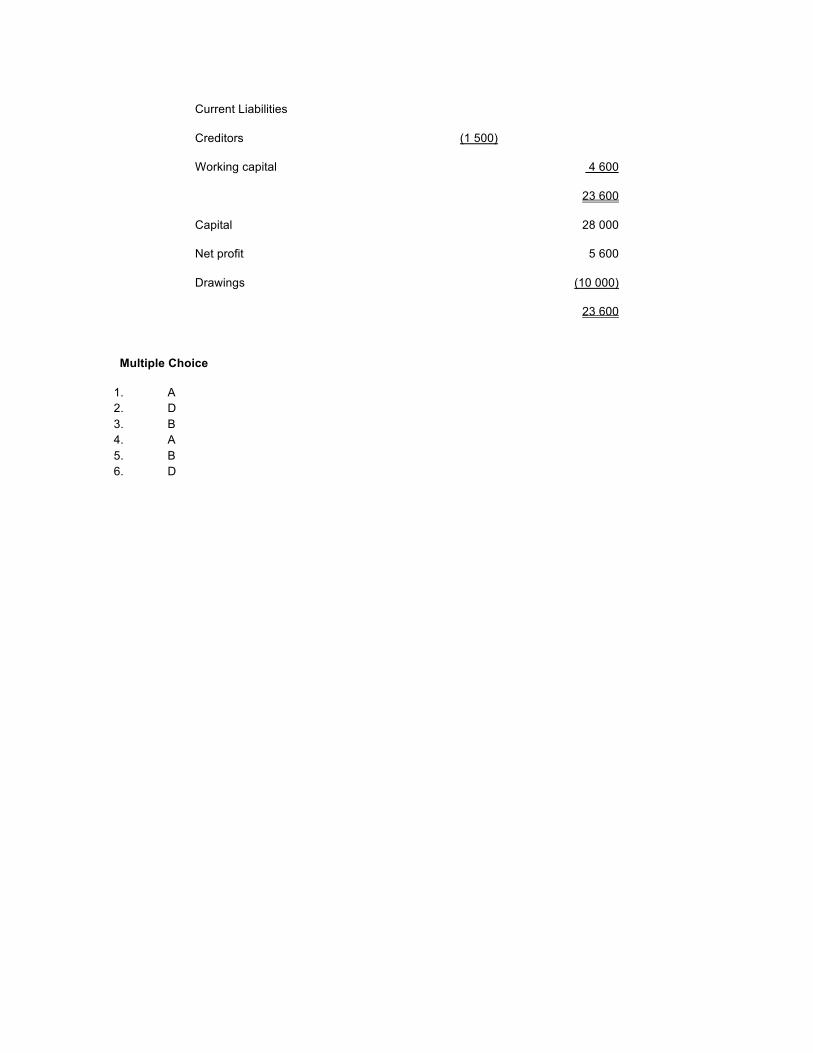
Current Liabilities
Creditors (1 500)
Working capital 4 600
23 600
Capital 28 000
Net profit 5 600
Drawings (10 000)
23 600
Multiple Choice
1. A 2. D 3. B 4. A 5. B 6. D
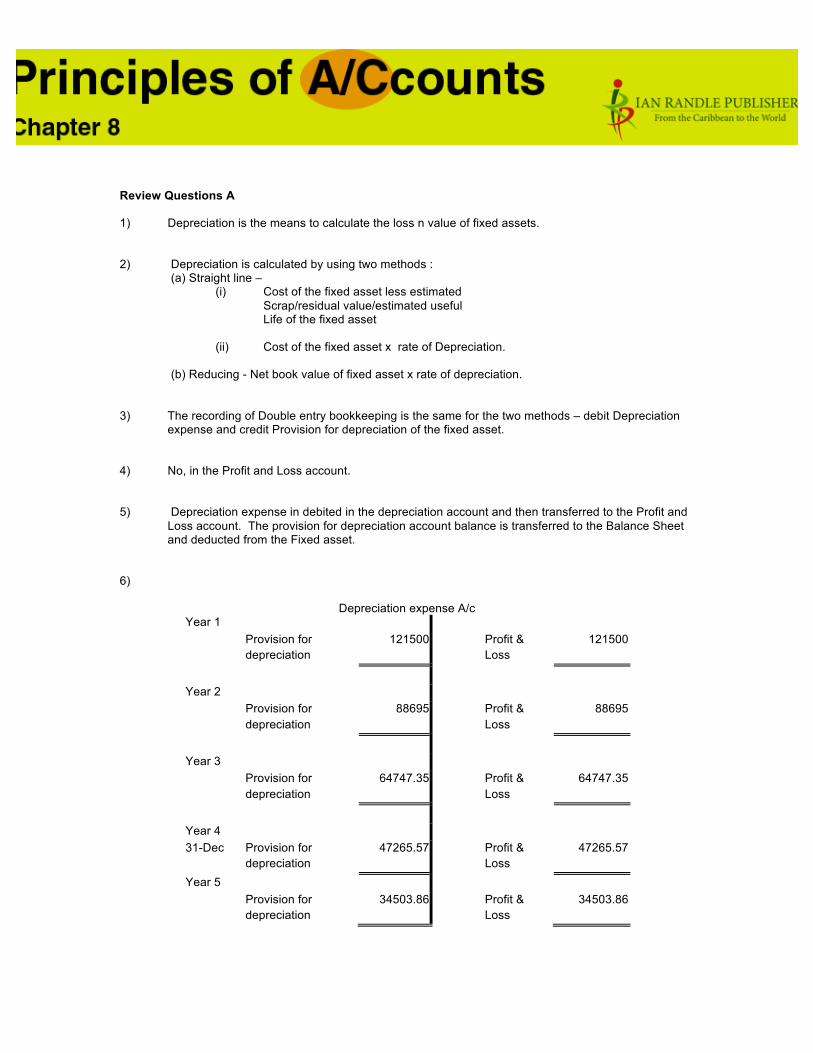
Review Questions A 1) Depreciation is the means to calculate the loss n value of fixed assets. 2) Depreciation is calculated by using two methods :
(a) Straight line – (i) Cost of the fixed asset less estimated
Scrap/residual value/estimated useful Life of the fixed asset
(ii) Cost of the fixed asset x rate of Depreciation. (b) Reducing - Net book value of fixed asset x rate of depreciation. 3) The recording of Double entry bookkeeping is the same for the two methods – debit Depreciation
expense and credit Provision for depreciation of the fixed asset. 4) No, in the Profit and Loss account. 5) Depreciation expense in debited in the depreciation account and then transferred to the Profit and
Loss account. The provision for depreciation account balance is transferred to the Balance Sheet and deducted from the Fixed asset.
6)
Depreciation expense A/c Year 1 Provision for
depreciation 121500 Profit &
Loss 121500
Year 2 Provision for
depreciation 88695 Profit &
Loss 88695
Year 3 Provision for
depreciation 64747.35 Profit &
Loss 64747.35
Year 4 31-Dec Provision for
depreciation 47265.57 Profit &
Loss 47265.57
Year 5 Provision for
depreciation 34503.86 Profit &
Loss 34503.86
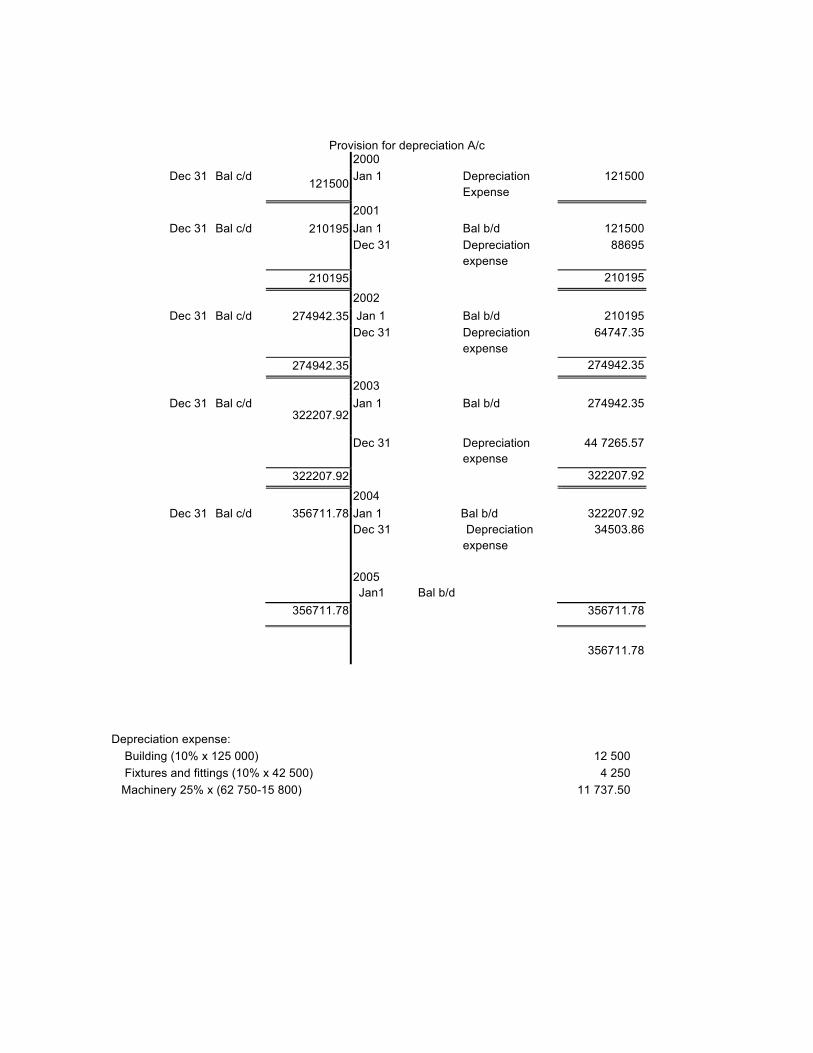
Provision for depreciation A/c
2000 Dec 31 Bal c/d 121500 Jan 1 Depreciation
Expense 121500
2001 Dec 31 Bal c/d 210195 Jan 1 Bal b/d 121500
Dec 31 Depreciation expense
88695
210195 210195
2002 Dec 31 Bal c/d 274942.35 Jan 1 Bal b/d 210195
Dec 31 Depreciation expense
64747.35
274942.35 274942.35
2003 Dec 31 Bal c/d
322207.92 Jan 1 Bal b/d 274942.35
Dec 31 Depreciation expense
44 7265.57
322207.92 322207.92
2004 356711.78
322207.92
34503.86
356711.78 356711.78
Dec 31 Bal c/d
Jan 1 Dec 31 2005 Jan1 Bal b/d
Bal b/d Depreciation expense
356711.78
Depreciation expense: Building (10% x 125 000) 12 500 Fixtures and fittings (10% x 42 500) 4 250 Machinery 25% x (62 750-15 800) 11 737.50
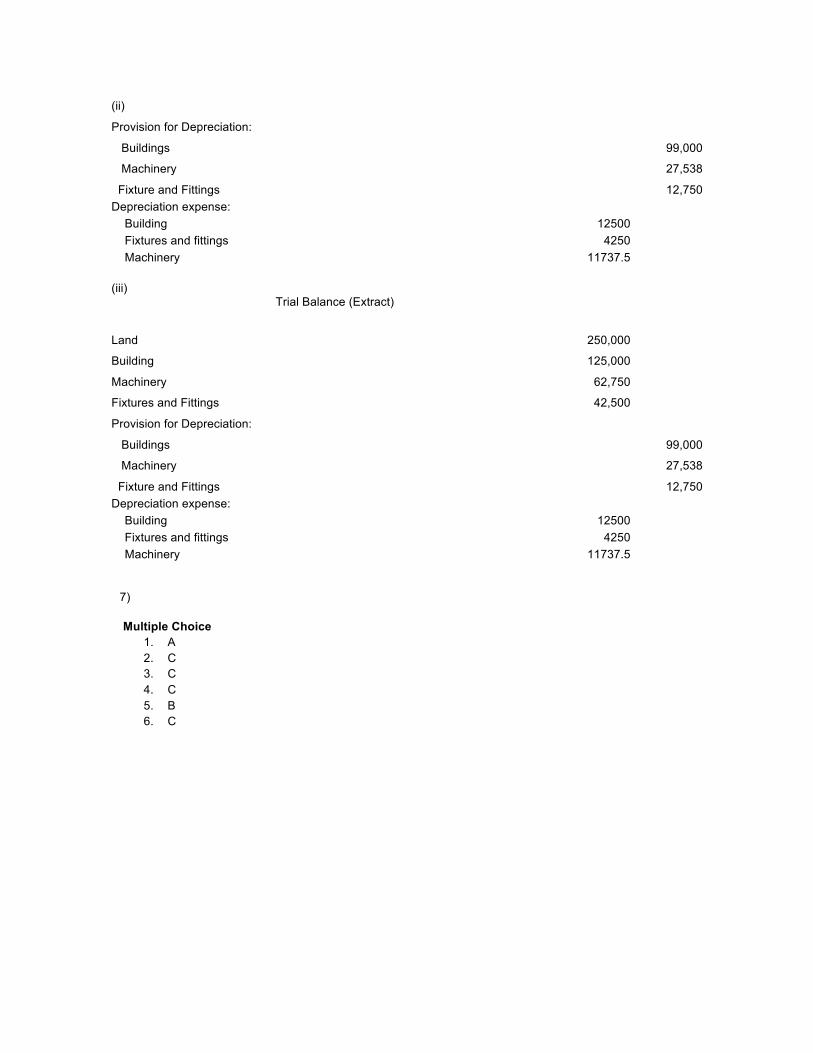
7)
Multiple Choice 1. A 2. C 3. C 4. C 5. B 6. C
(ii)
Provision for Depreciation:
Buildings 99,000
Machinery 27,538
Fixture and Fittings 12,750 Depreciation expense: Building 12500 Fixtures and fittings 4250 Machinery 11737.5 (iii)
Trial Balance (Extract)
Land 250,000
Building 125,000
Machinery 62,750
Fixtures and Fittings 42,500
Provision for Depreciation:
Buildings 99,000
Machinery 27,538
Fixture and Fittings 12,750 Depreciation expense: Building 12500 Fixtures and fittings 4250 Machinery 11737.5
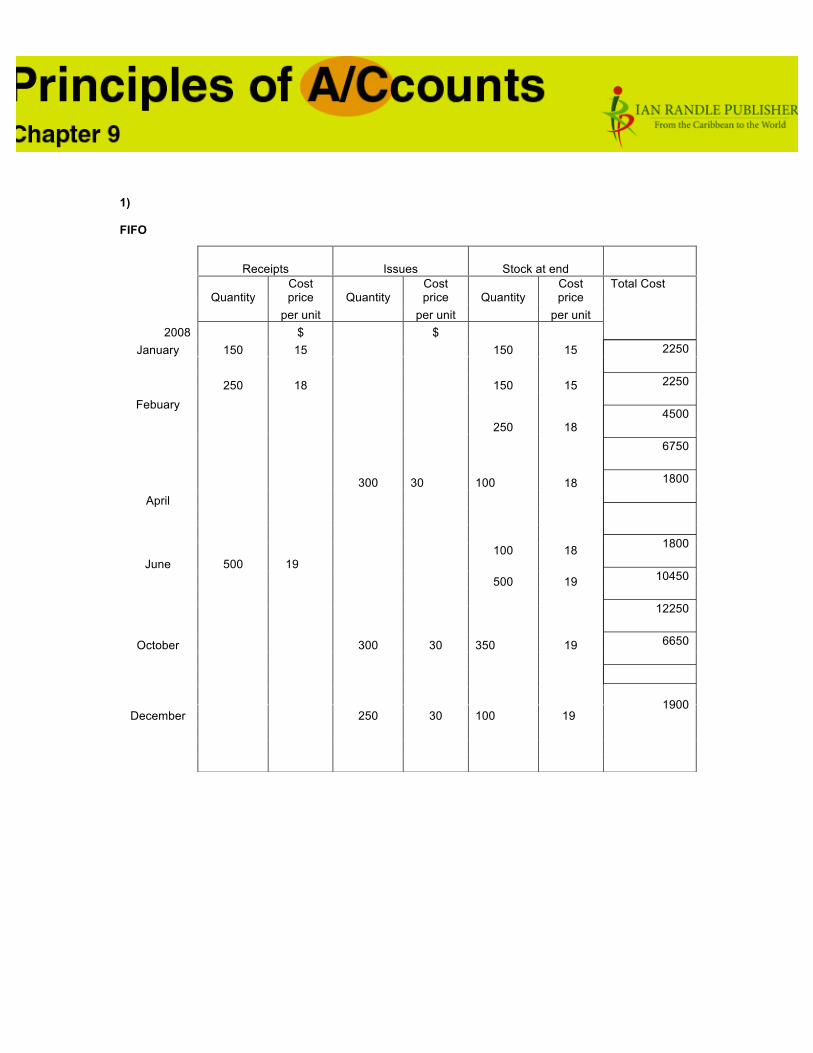
1) FIFO
Receipts Issues Stock at end
Quantity Cost price Quantity
Cost price Quantity
Cost price
per unit per unit per unit 2008 $ $
Total Cost
January 150 15 150 15
250 18 150 15 Febuary
250 18
300 30 100
18 April
June 500 19 100
18
500 19
October 300 30 350 19
December 250 30 100 19
2250
2250
4500
6750
1800
1800
10450
12250
6650
1900
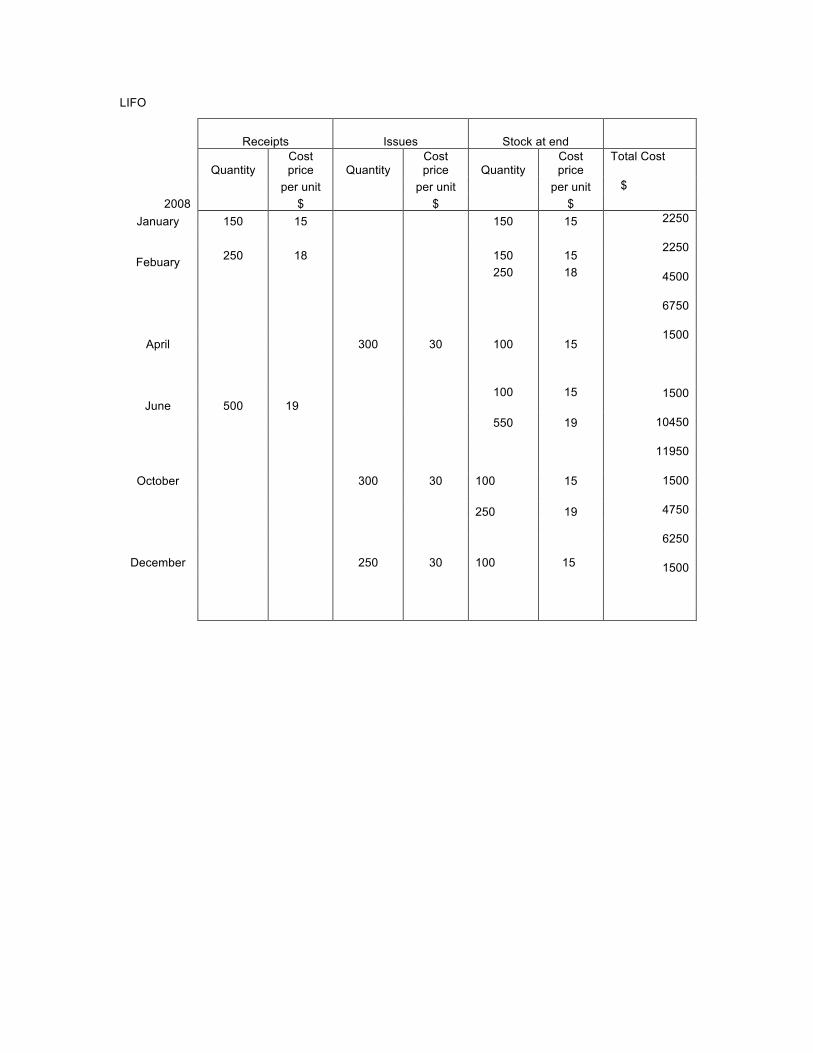
LIFO
Receipts Issues Stock at end
Quantity Cost price Quantity
Cost price Quantity
Cost price
per unit per unit per unit 2008 $ $ $
Total Cost
$
January 150 15 150 15
250 18 150 15 Febuary 250 18
April 300 30 100 15
June 500 19 100
15
550 19
October
300
30
100
15
250 19
December 250 30 100 15
2250
2250
4500
6750
1500
1500
10450
11950
1500
4750
6250
1500
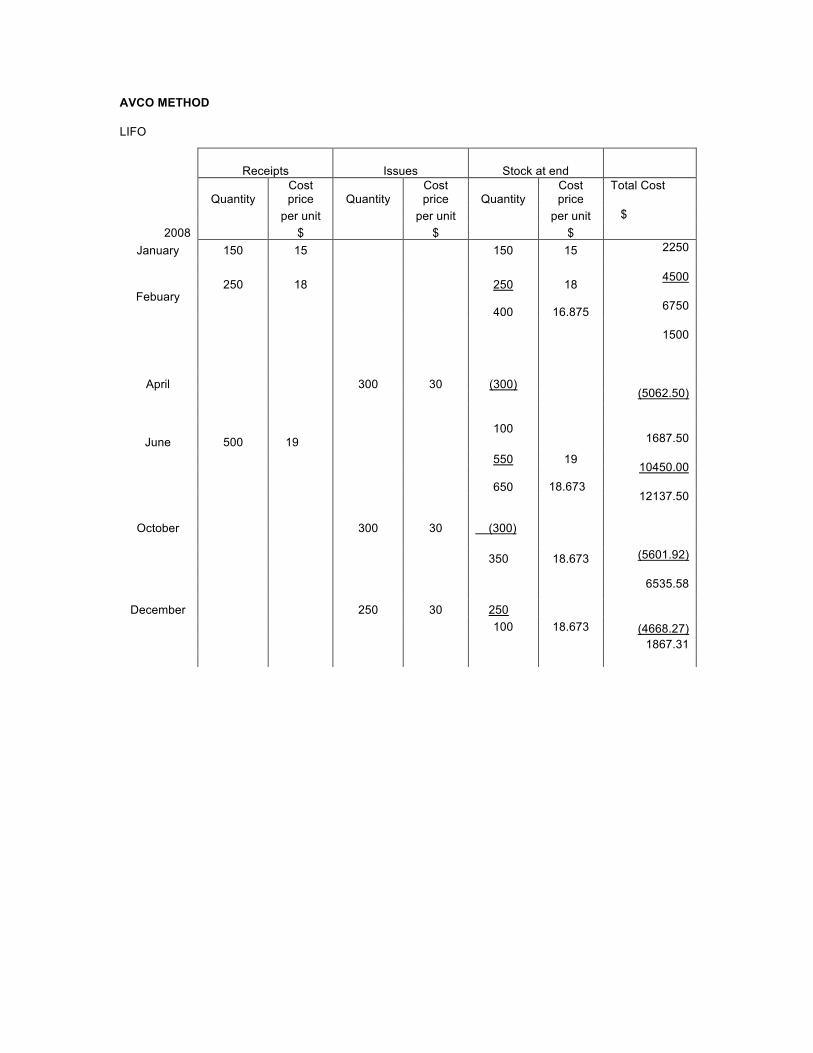
AVCO METHOD
LIFO
Receipts Issues Stock at end
Quantity Cost price Quantity
Cost price Quantity
Cost price
per unit per unit per unit 2008 $ $ $
Total Cost
$
January 150 15 150 15
250 18 250 18 Febuary
400
16.875
April 300 30 (300)
June 500 19 100
550 19
650 18.673
October
300
30
(300)
350 18.673
December 250 30 250 100 18.673
2250
4500
6750
1500
(5062.50)
1687.50
10450.00
12137.50
(5601.92)
6535.58
(4668.27) 1867.31
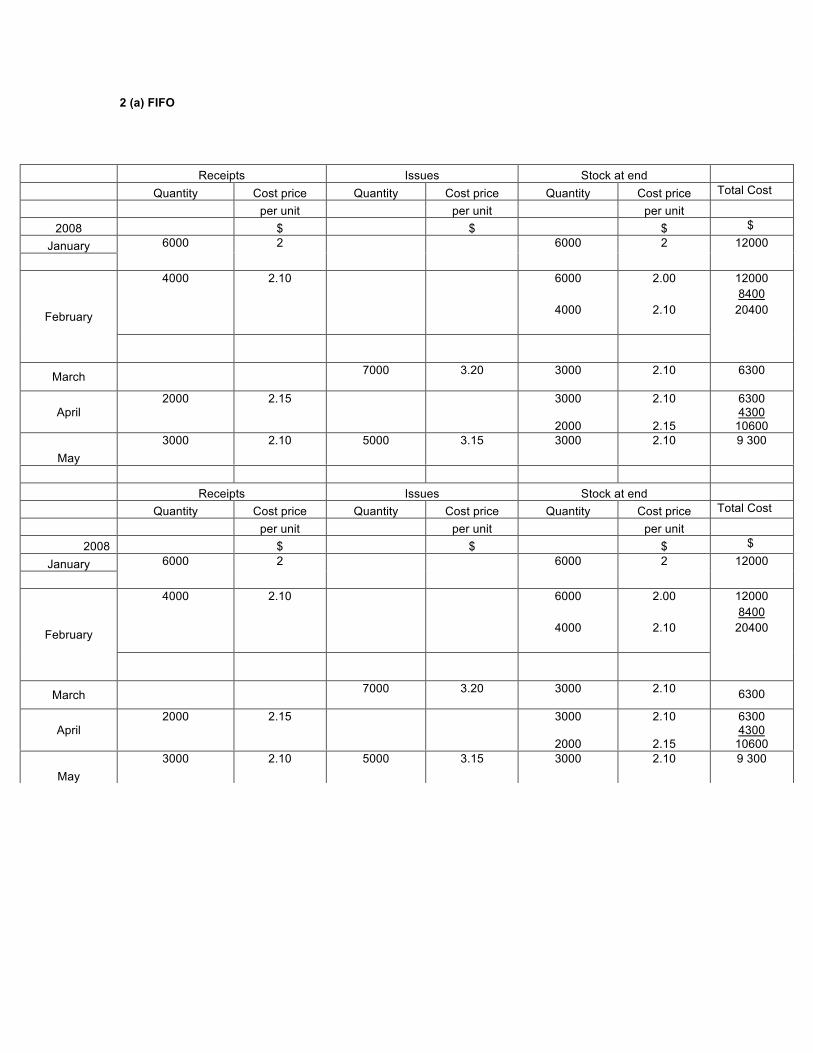
2 (a) FIFO
Receipts Issues Stock at end
Quantity Cost price Quantity Cost price Quantity Cost price Total Cost
per unit per unit per unit
2008 $ $ $ $
January
6000 2 6000 2 12000
4000 2.10 6000
4000
2.00
2.10
February
12000 8400
20400
March 7000 3.20 3000 2.10
6300
April 2000 2.15 3000
2000
2.10
2.15
6300 4300
10600
May 3000 2.10 5000 3.15 3000
2.10
9 300
Receipts Issues Stock at end
Quantity Cost price Quantity Cost price Quantity Cost price Total Cost
per unit per unit per unit
2008 $ $ $ $
January
6000 2 6000 2 12000
4000 2.10 6000
4000
2.00
2.10 February
12000 8400
20400
March 7000 3.20 3000 2.10
6300
April 2000 2.15 3000
2000
2.10
2.15
6300 4300
10600
May 3000 2.10 5000 3.15 3000
2.10
9 300
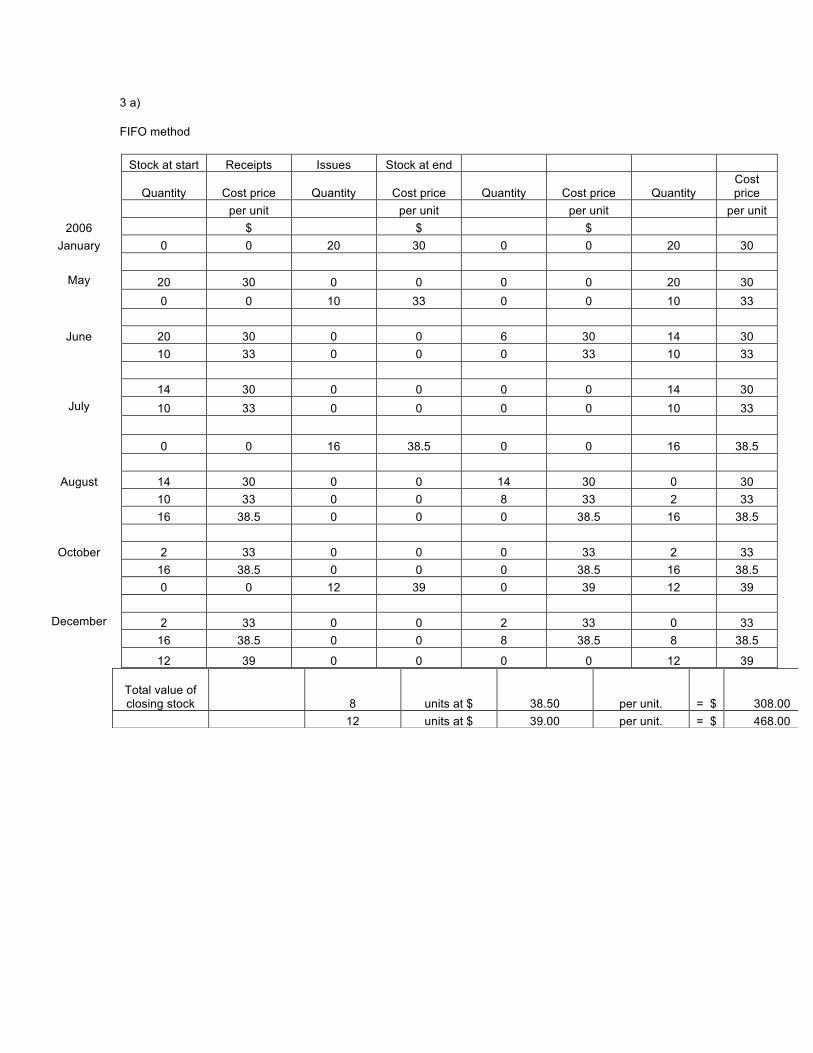
3 a)
FIFO method
Stock at start Receipts Issues Stock at end
Quantity Cost price Quantity Cost price Quantity Cost price Quantity Cost price
per unit per unit per unit per unit 2006 $ $ $
January 0 0 20 30 0 0 20 30
May 20 30 0 0 0 0 20 30 0 0 10 33 0 0 10 33
June 20 30 0 0 6 30 14 30
10 33 0 0 0 33 10 33 14 30 0 0 0 0 14 30
July 10 33 0 0 0 0 10 33 0 0 16 38.5 0 0 16 38.5
August 14 30 0 0 14 30 0 30
10 33 0 0 8 33 2 33 16 38.5 0 0 0 38.5 16 38.5
October 2 33 0 0 0 33 2 33 16 38.5 0 0 0 38.5 16 38.5 0 0 12 39 0 39 12 39
December 2 33 0 0 2 33 0 33 16 38.5 0 0 8 38.5 8 38.5 12 39 0 0 0 0 12 39
Total value of closing stock 8 units at $ 38.50 per unit. = $ 308.00
12 units at $ 39.00 per unit. = $ 468.00
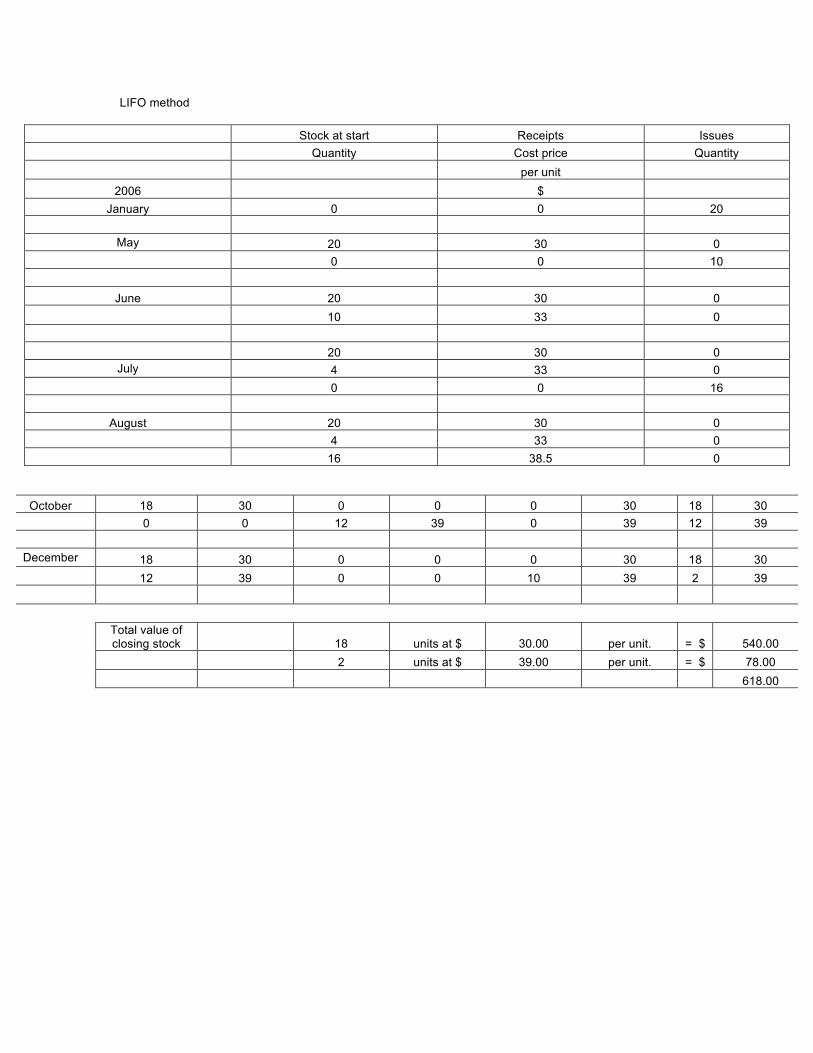
LIFO method
Stock at start Receipts Issues Quantity Cost price Quantity per unit
2006 $ January 0 0 20
May 20 30 0
0 0 10
June 20 30 0 10 33 0 20 30 0
July 4 33 0 0 0 16
August 20 30 0
4 33 0 16 38.5 0
October 18 30 0 0 0 30 18 30 0 0 12 39 0 39 12 39
December 18 30 0 0 0 30 18 30 12 39 0 0 10 39 2 39
Total value of closing stock 18 units at $ 30.00 per unit. = $ 540.00
2 units at $ 39.00 per unit. = $ 78.00 618.00
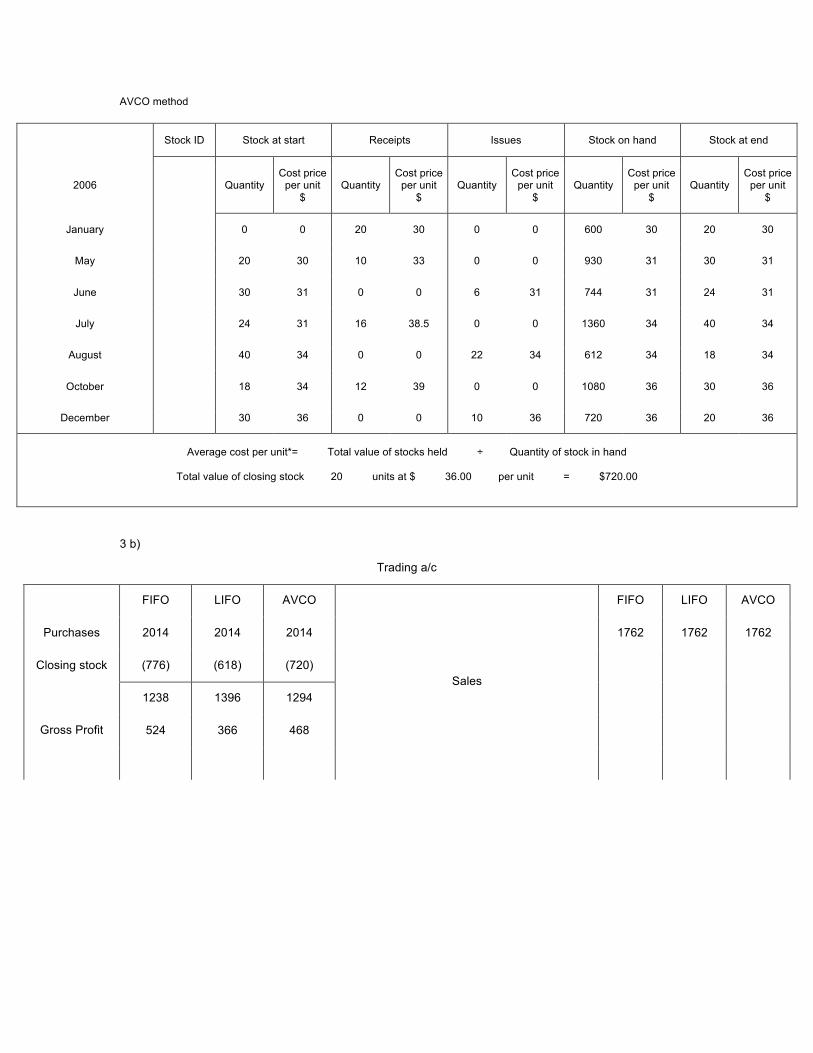
AVCO method
Stock ID Stock at start Receipts Issues Stock on hand Stock at end
2006 Quantity Cost price
per unit $
Quantity Cost price
per unit $
Quantity Cost price
per unit $
Quantity Cost price
per unit $
Quantity Cost price
per unit $
January 0 0 20 30 0 0 600 30 20 30
May 20 30 10 33 0 0 930 31 30 31
June 30 31 0 0 6 31 744 31 24 31
July 24 31 16 38.5 0 0 1360 34 40 34
August 40 34 0 0 22 34 612 34 18 34
October 18 34 12 39 0 0 1080 36 30 36
December 30 36 0 0 10 36 720 36 20 36
Average cost per unit*= Total value of stocks held ÷ Quantity of stock in hand
Total value of closing stock 20 units at $ 36.00 per unit = $720.00
3 b)
Trading a/c
FIFO LIFO AVCO FIFO LIFO AVCO
Purchases 2014 2014 2014 1762 1762 1762
Closing stock (776) (618) (720)
1238 1396 1294
524 366 468 Gross Profit
Sales
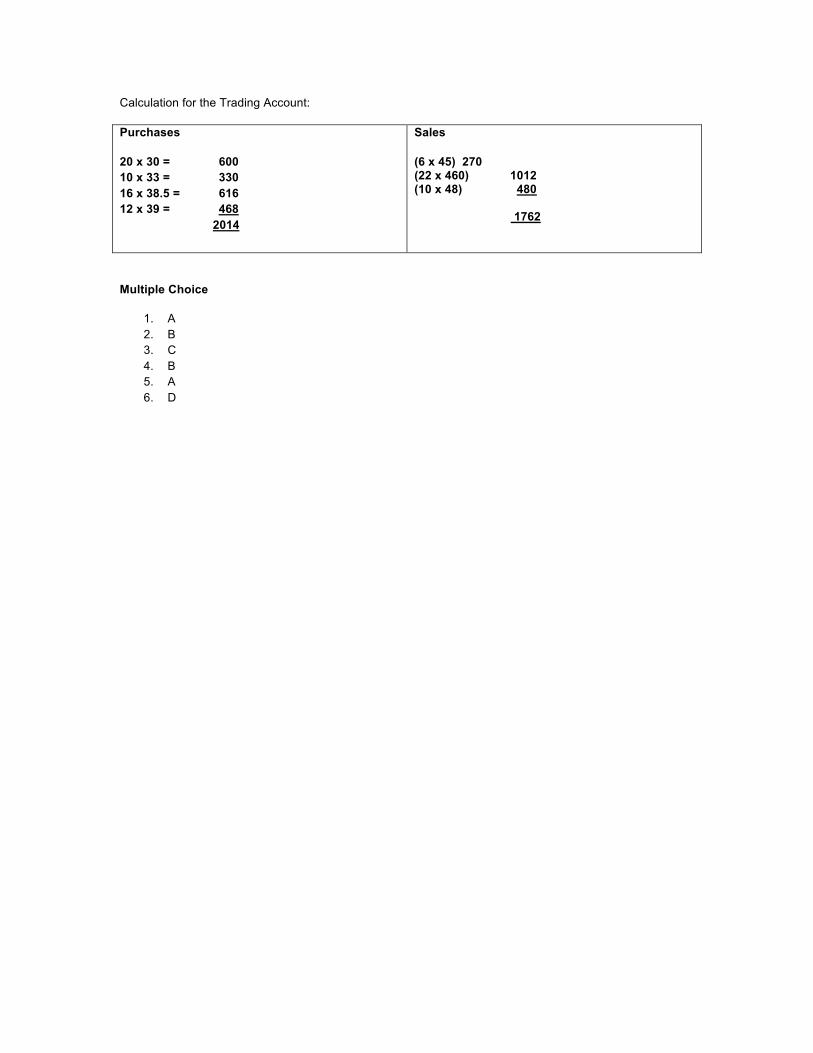
Calculation for the Trading Account:
Purchases
20 x 30 = 600 10 x 33 = 330 16 x 38.5 = 616 12 x 39 = 468 2014
Sales
(6 x 45) 270 (22 x 460) 1012 (10 x 48) 480 1762
Multiple Choice
1. A 2. B 3. C 4. B 5. A 6. D
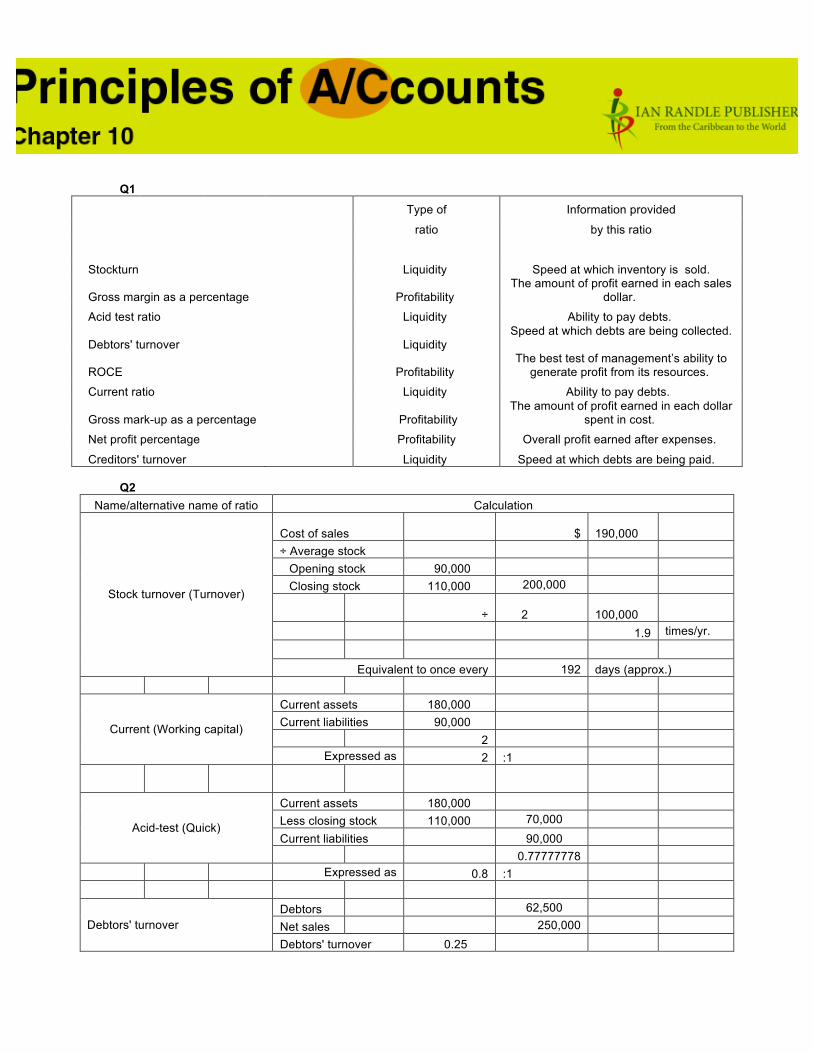
Q1
Type of Information provided
ratio by this ratio
Stockturn Liquidity Speed at which inventory is sold.
Gross margin as a percentage Profitability The amount of profit earned in each sales
dollar.
Acid test ratio Liquidity Ability to pay debts.
Debtors' turnover Liquidity Speed at which debts are being collected.
ROCE Profitability The best test of management’s ability to
generate profit from its resources.
Current ratio Liquidity Ability to pay debts.
Gross mark-up as a percentage Profitability The amount of profit earned in each dollar
spent in cost.
Net profit percentage Profitability Overall profit earned after expenses.
Creditors' turnover Liquidity Speed at which debts are being paid. Q2
Name/alternative name of ratio Calculation
Cost of sales $ 190,000
÷ Average stock Opening stock 90,000 Closing stock 110,000 200,000
÷ 2 100,000
1.9 times/yr.
Stock turnover (Turnover)
Equivalent to once every 192 days (approx.)
Current assets 180,000 Current liabilities 90,000 2
Current (Working capital)
Expressed as 2 :1
Current assets 180,000 Less closing stock 110,000 70,000 Current liabilities 90,000
Acid-test (Quick)
0.77777778 Expressed as 0.8 :1
Debtors 62,500 Net sales 250,000 Debtors' turnover Debtors' turnover 0.25
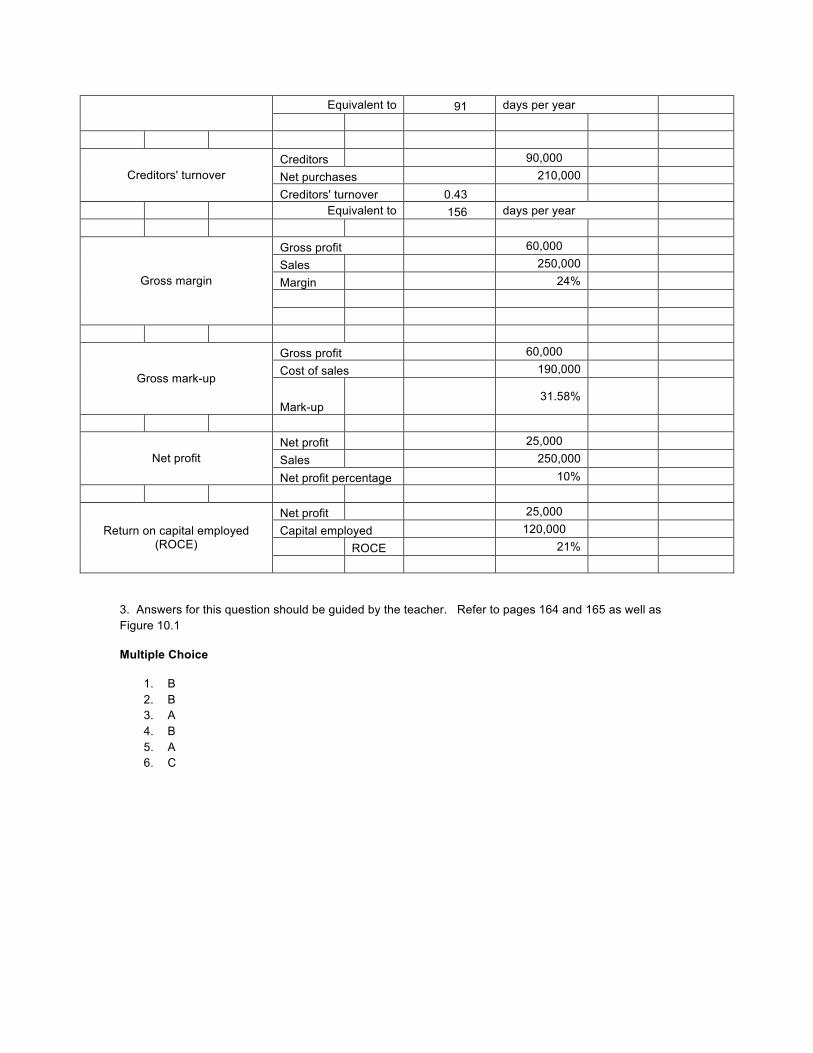
Equivalent to 91 days per year
Creditors 90,000 Net purchases 210,000 Creditors' turnover Creditors' turnover 0.43
Equivalent to 156 days per year
Gross profit 60,000 Sales 250,000 Margin 24%
Gross margin
Gross profit 60,000 Cost of sales 190,000
Gross mark-up
Mark-up 31.58%
Net profit 25,000 Sales 250,000 Net profit
Net profit percentage 10%
Net profit 25,000 Capital employed 120,000 ROCE 21%
Return on capital employed (ROCE)
3. Answers for this question should be guided by the teacher. Refer to pages 164 and 165 as well as Figure 10.1
Multiple Choice
1. B 2. B 3. A 4. B 5. A 6. C
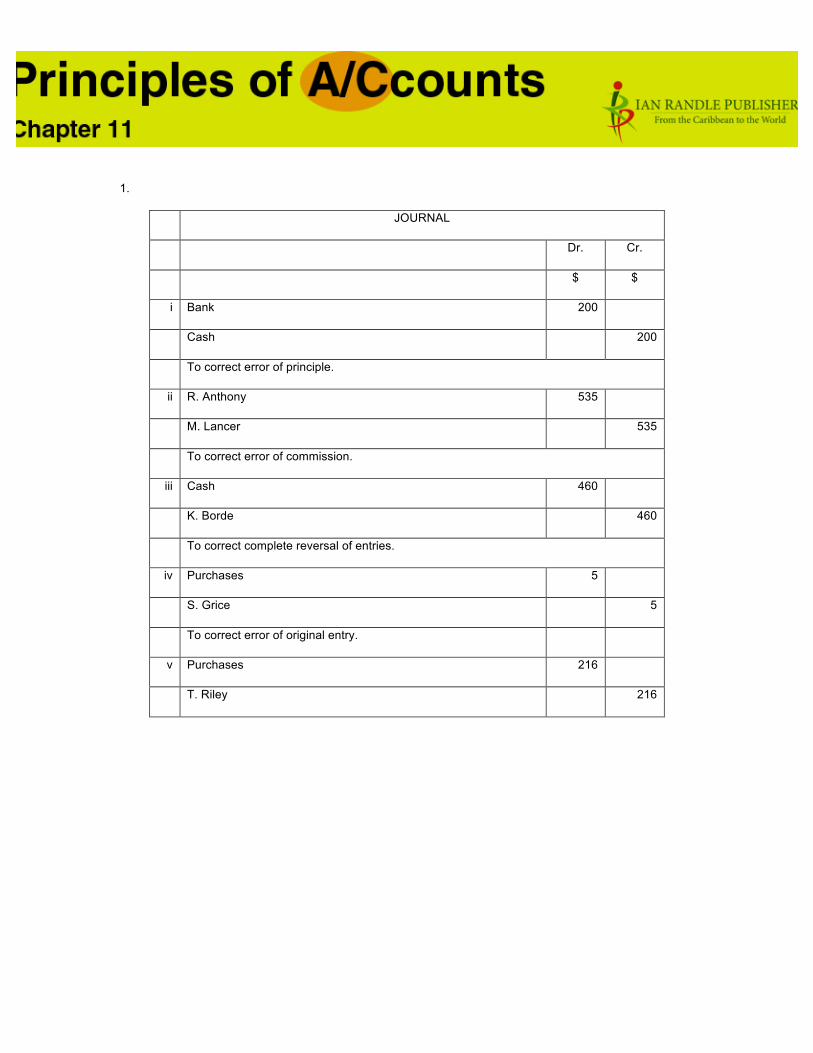
1.
JOURNAL
Dr. Cr.
$ $
i Bank 200
Cash 200
To correct error of principle.
ii R. Anthony 535
M. Lancer 535
To correct error of commission.
iii Cash 460
K. Borde 460
To correct complete reversal of entries.
iv Purchases 5
S. Grice 5
To correct error of original entry.
v Purchases 216
T. Riley 216
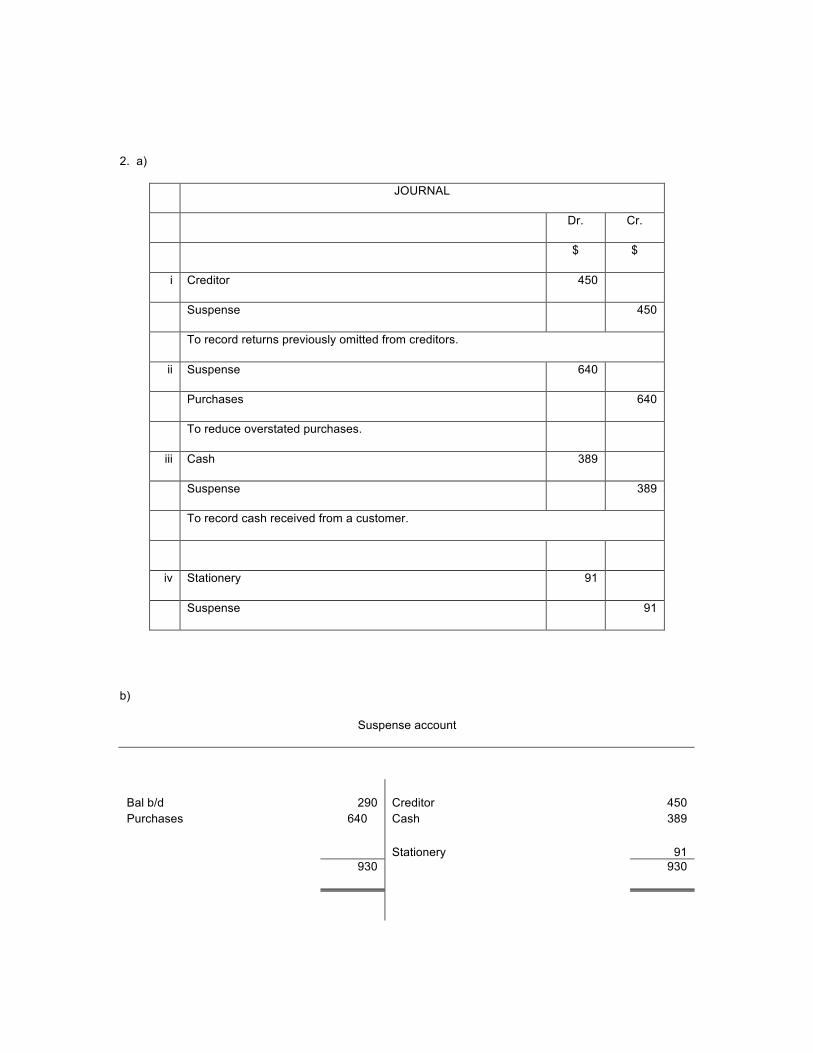
2. a)
JOURNAL
Dr. Cr.
$ $
i Creditor 450
Suspense 450
To record returns previously omitted from creditors.
ii Suspense 640
Purchases 640
To reduce overstated purchases.
iii Cash 389
Suspense 389
To record cash received from a customer.
iv Stationery 91
Suspense 91
b)
Suspense account
$
Bal b/d Purchases
290 640
Creditor Cash
450 389
Stationery 91
930 930
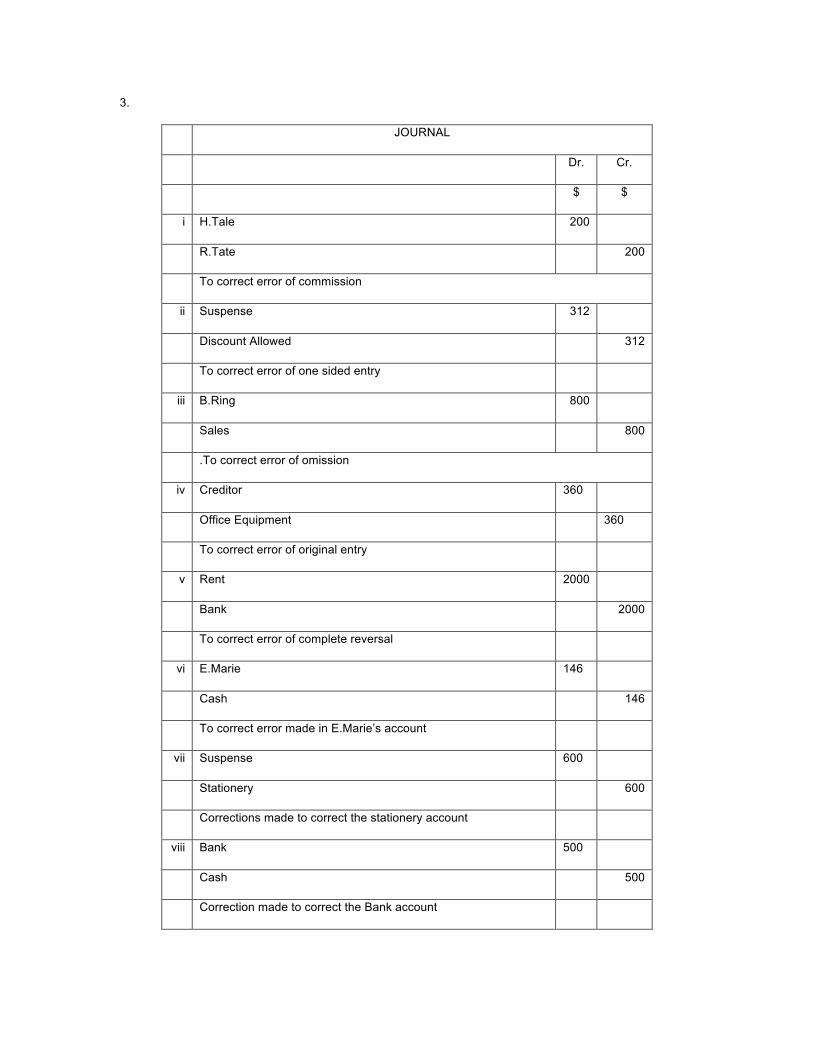
3.
JOURNAL
Dr. Cr.
$ $
i H.Tale 200
R.Tate 200
To correct error of commission
ii Suspense 312
Discount Allowed 312
To correct error of one sided entry
iii B.Ring 800
Sales 800
.To correct error of omission
iv Creditor 360
Office Equipment 360
To correct error of original entry
v Rent 2000
Bank 2000
To correct error of complete reversal
vi E.Marie 146
Cash 146
To correct error made in E.Marie’s account
vii Suspense 600
Stationery 600
Corrections made to correct the stationery account
viii Bank 500
Cash 500
Correction made to correct the Bank account
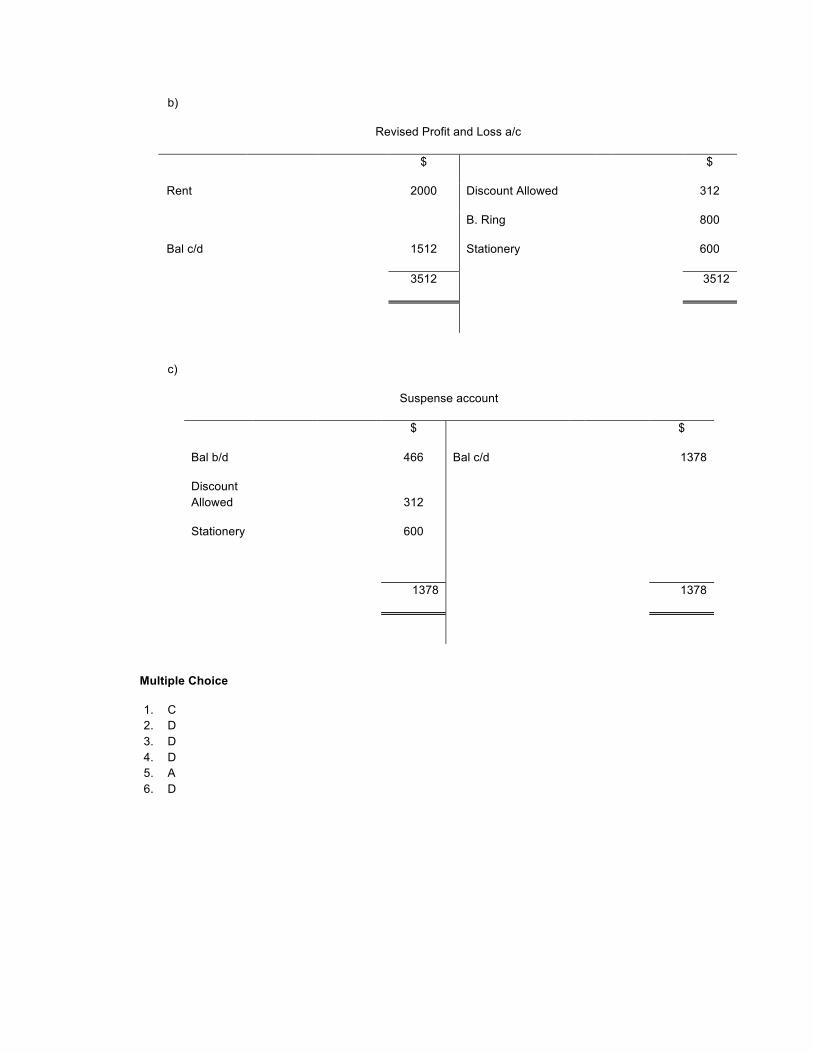
b)
Revised Profit and Loss a/c
$ $
Rent 2000 Discount Allowed 312
Bal c/d 1512
B. Ring
Stationery
800
600
3512 3512
c)
Suspense account
$ $
Bal b/d 466 Bal c/d 1378
Discount Allowed
Stationery
312
600
1378 1378
Multiple Choice
1. C 2. D 3. D 4. D 5. A 6. D
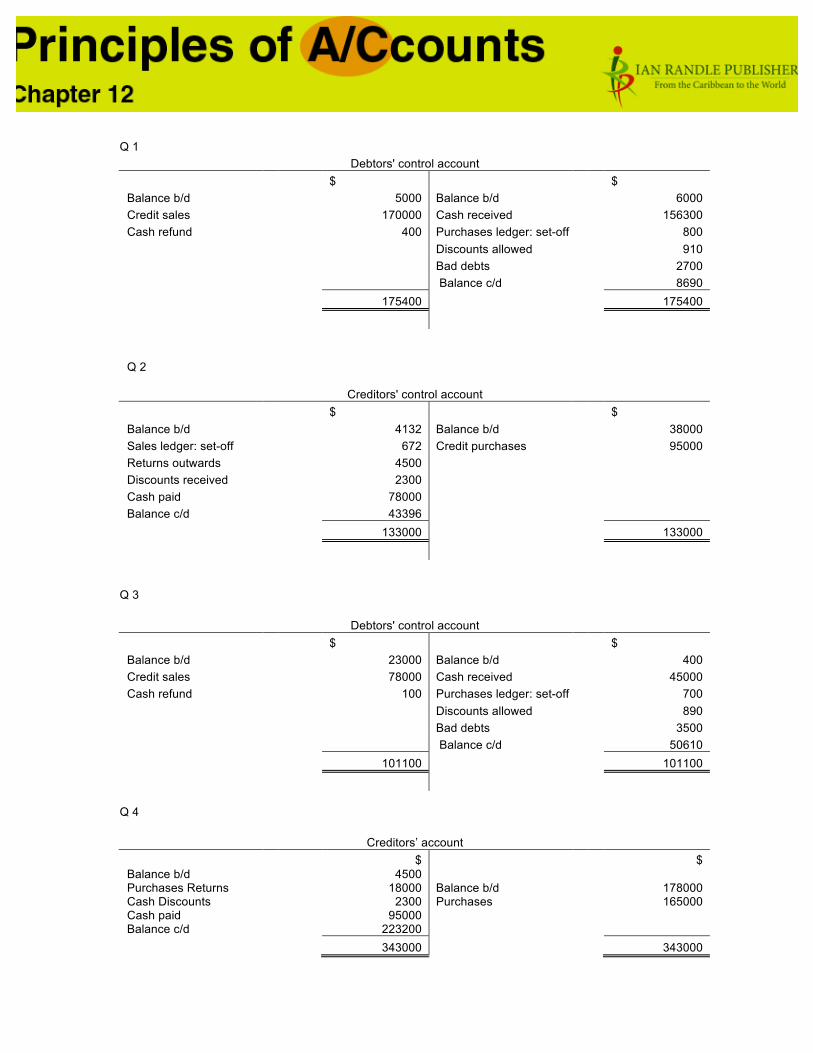
Q 1
Debtors' control account $ $ Balance b/d 5000 Balance b/d 6000 Credit sales 170000 Cash received 156300 Cash refund 400 Purchases ledger: set-off 800 Discounts allowed 910 Bad debts 2700 Balance c/d 8690 175400 175400
Q 2
Creditors' control account $ $ Balance b/d 4132 Balance b/d 38000 Sales ledger: set-off 672 Credit purchases 95000 Returns outwards 4500 Discounts received 2300 Cash paid 78000 Balance c/d 43396 133000 133000
Q 3
Debtors' control account $ $ Balance b/d 23000 Balance b/d 400 Credit sales 78000 Cash received 45000 Cash refund 100 Purchases ledger: set-off 700 Discounts allowed 890 Bad debts 3500 Balance c/d 50610 101100 101100
Q 4
Creditors’ account $ $ Balance b/d Purchases Returns Cash Discounts Cash paid Balance c/d
4500 18000
2300 95000
223200
Balance b/d Purchases
178000 165000
343000 343000
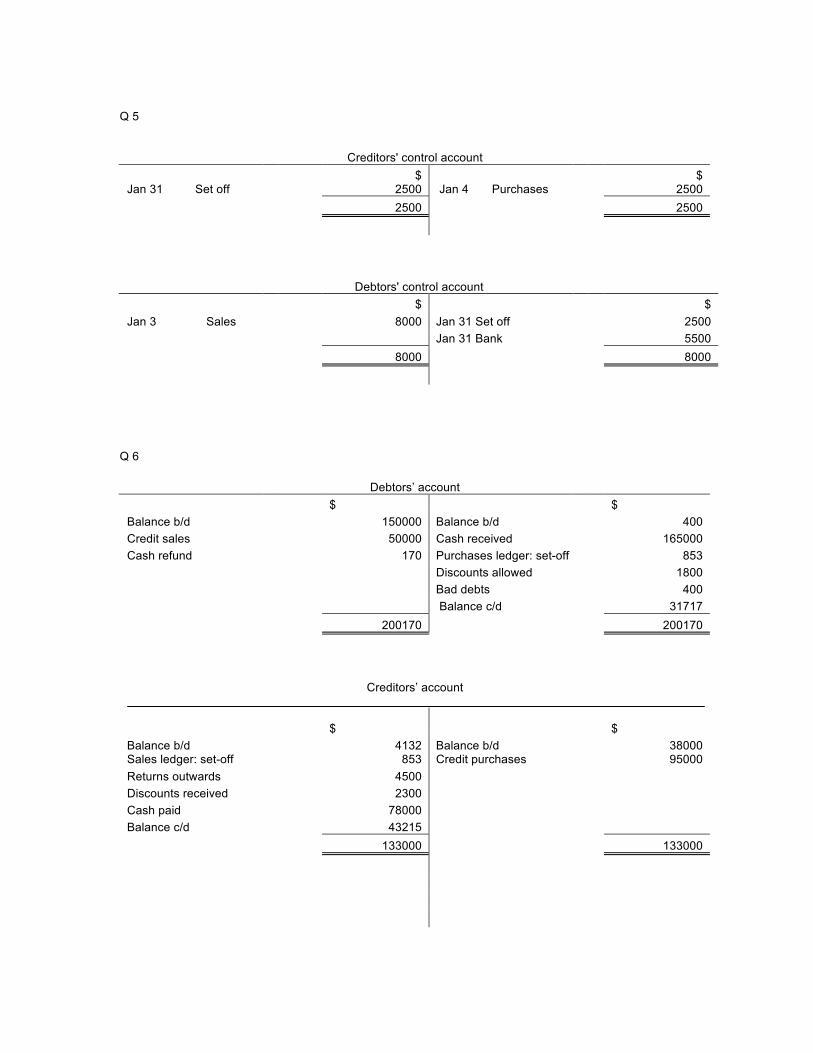
Q 5
Creditors' control account
$ $ Jan 31 Set off 2500 Jan 4 Purchases 2500 2500 2500
Debtors' control account $ $ Jan 3 Sales 8000 Jan 31 Set off 2500 Jan 31 Bank 5500 8000 8000
Q 6
Debtors’ account $ $ Balance b/d 150000 Balance b/d 400 Credit sales 50000 Cash received 165000 Cash refund 170 Purchases ledger: set-off 853 Discounts allowed 1800 Bad debts 400 Balance c/d 31717 200170 200170
Creditors’ account
$ $ Balance b/d 4132 Balance b/d 38000 Sales ledger: set-off 853 Credit purchases 95000 Returns outwards 4500 Discounts received 2300 Cash paid 78000 Balance c/d 43215 133000 133000

Multiple Choice
1. D 2. B 3. C 4. A 5. D 6. B
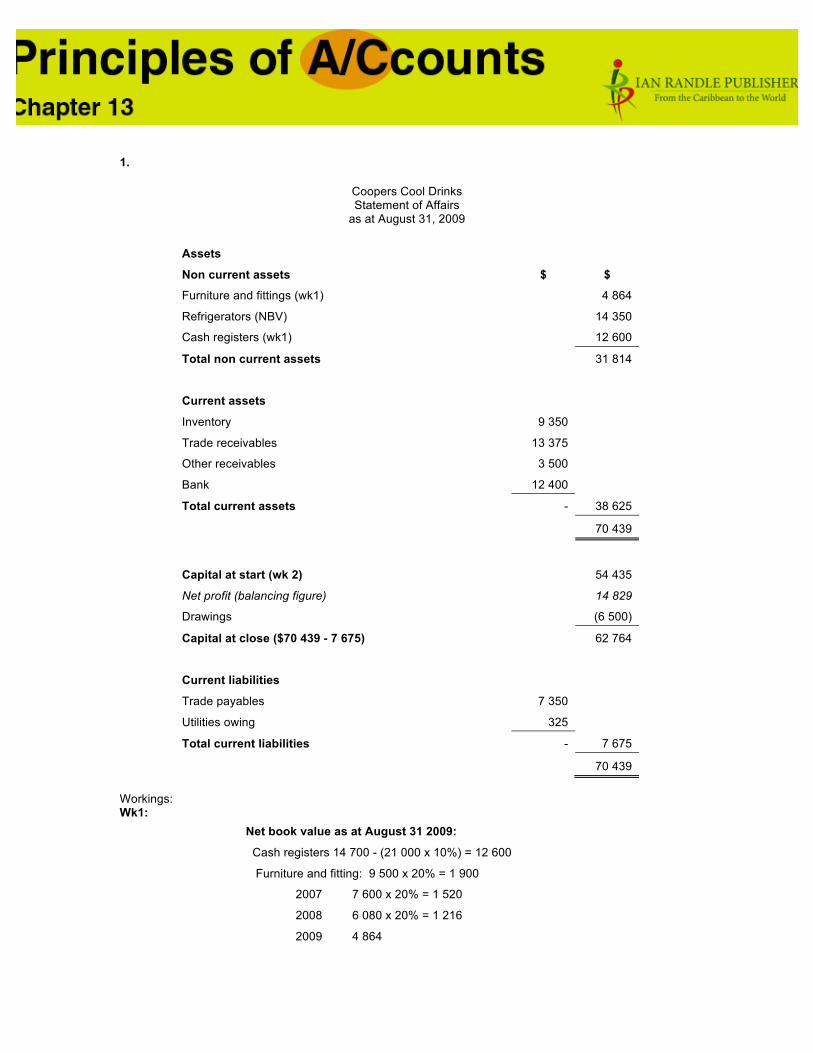
1.
Coopers Cool Drinks Statement of Affairs
as at August 31, 2009
Assets
Non current assets $ $
Furniture and fittings (wk1) 4 864
Refrigerators (NBV) 14 350
Cash registers (wk1) 12 600
Total non current assets 31 814
Current assets
Inventory 9 350
Trade receivables 13 375
Other receivables 3 500
Bank 12 400
Total current assets - 38 625
70 439
Capital at start (wk 2) 54 435
Net profit (balancing figure) 14 829
Drawings (6 500)
Capital at close ($70 439 - 7 675) 62 764
Current liabilities
Trade payables 7 350
Utilities owing 325
Total current liabilities - 7 675
70 439 Workings: Wk1:
Net book value as at August 31 2009:
Cash registers 14 700 - (21 000 x 10%) = 12 600
Furniture and fitting: 9 500 x 20% = 1 900
2007 7 600 x 20% = 1 520
2008 6 080 x 20% = 1 216
2009 4 864
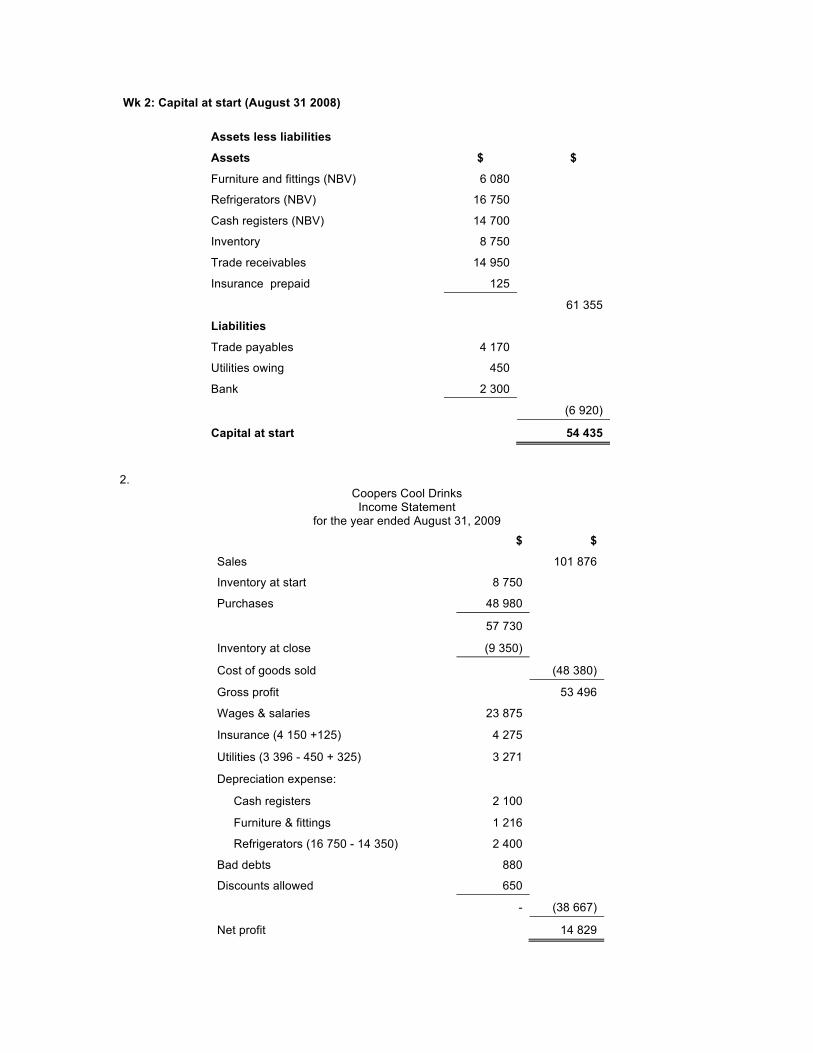
Wk 2: Capital at start (August 31 2008)
Assets less liabilities
Assets $ $
Furniture and fittings (NBV) 6 080
Refrigerators (NBV) 16 750
Cash registers (NBV) 14 700
Inventory 8 750
Trade receivables 14 950
Insurance prepaid 125
61 355
Liabilities
Trade payables 4 170
Utilities owing 450
Bank 2 300
(6 920)
Capital at start 54 435 2.
Coopers Cool Drinks Income Statement
for the year ended August 31, 2009
$ $
Sales 101 876
Inventory at start 8 750
Purchases 48 980
57 730
Inventory at close (9 350)
Cost of goods sold (48 380)
Gross profit 53 496
Wages & salaries 23 875
Insurance (4 150 +125) 4 275
Utilities (3 396 - 450 + 325) 3 271
Depreciation expense:
Cash registers 2 100
Furniture & fittings 1 216
Refrigerators (16 750 - 14 350) 2 400
Bad debts 880
Discounts allowed 650
- (38 667)
Net profit 14 829
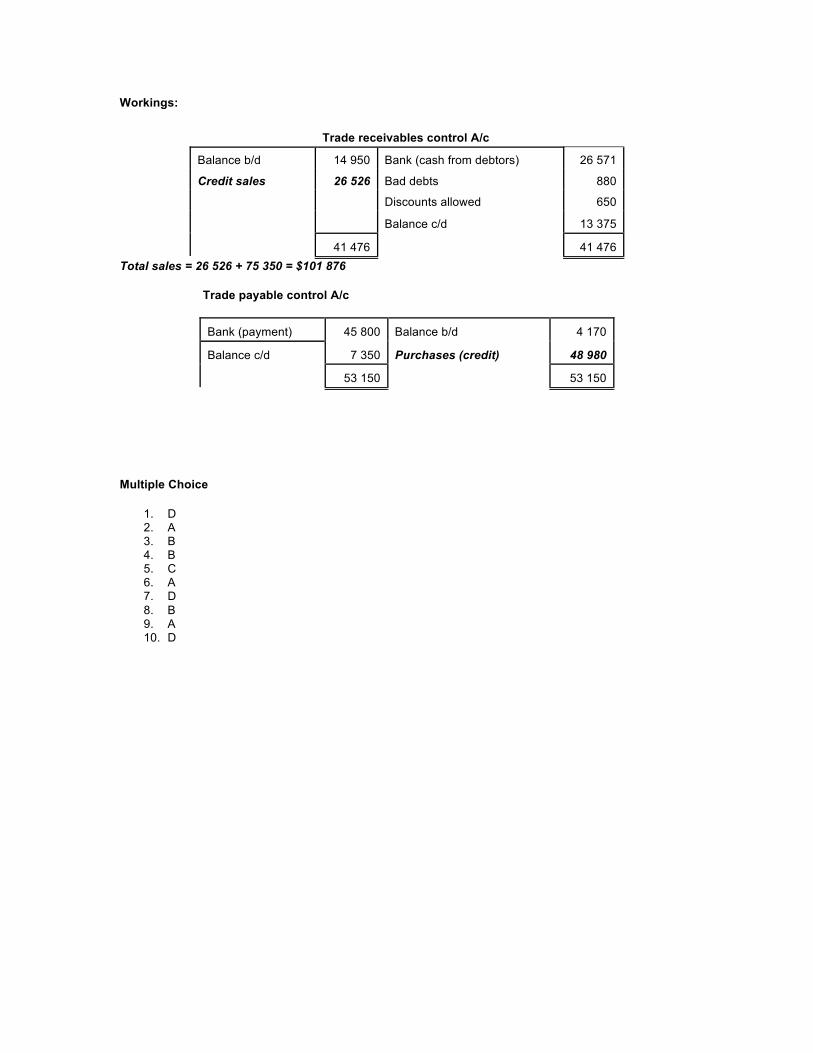
Workings:
Trade receivables control A/c
Balance b/d 14 950 Bank (cash from debtors) 26 571
Credit sales 26 526 Bad debts 880
Discounts allowed 650
Balance c/d 13 375
41 476 41 476 Total sales = 26 526 + 75 350 = $101 876
Trade payable control A/c
Bank (payment) 45 800 Balance b/d 4 170
Balance c/d 7 350 Purchases (credit) 48 980
53 150 53 150
Multiple Choice
1. D 2. A 3. B 4. B 5. C 6. A 7. D 8. B 9. A 10. D

Q1
Direct debits -This is where you give the creditor the right to obtain the money straight from your bank
account. This form of withdrawal is mainly used when there are different amounts to be paid each period (weekly, monthly, quarterly etc.)
Standing orders -Here, you instruct the bank to deduct a fixed amount every period. Useful for insurance and mortgage payments.
Overdraft interest -This will be deducted by the bank as a form of penalty for withdrawing more than you have in your account.
Dishonoured cheque – This is a cheque which had been received from a customer and deposited but has been discovered to be invalid. A cheque becomes invalid for several reasons including insufficient funds, improper information placed on the cheque (e.g. wrong date, improper signature, words and figures for the amount
Q2
Making deposits -This is shown by the word "deposit" in the statement. Direct credits - The opposite of a direct debit. Here you give the debtor the right to put money straight
into your account. For example salaries deposits, or dividends from investments Interest earned - This is money that you have gained by holding cash in the bank.
Q3
Big Doors Enterprises
(i) Bank reconciliation statement for the month ended 31 March, 2009
Bank statement balance $4500 Bank statement balance $2200 Less: Unpresented cheques $1500 Adjusted cash book balance $5200
(ii) $5200
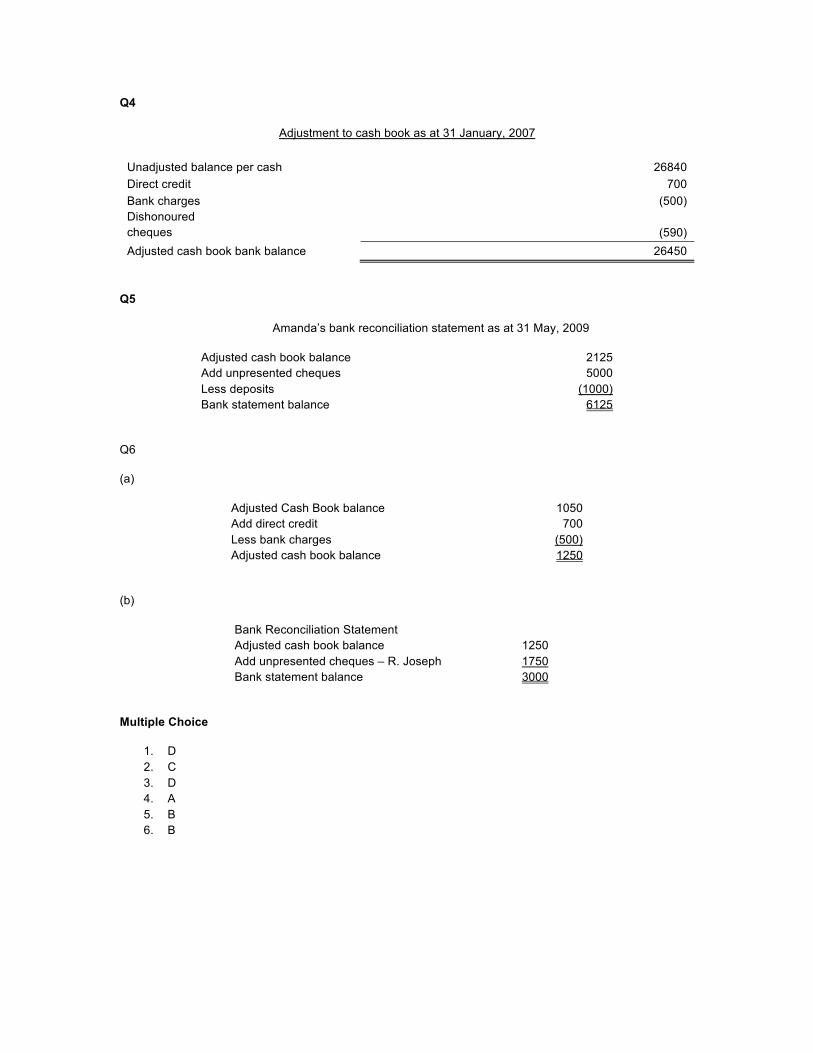
Q4
Adjustment to cash book as at 31 January, 2007 Unadjusted balance per cash 26840 Direct credit 700 Bank charges (500) Dishonoured cheques (590) Adjusted cash book bank balance 26450
Q5
Amanda’s bank reconciliation statement as at 31 May, 2009
Adjusted cash book balance 2125 Add unpresented cheques 5000 Less deposits (1000) Bank statement balance 6125
Q6
(a)
Adjusted Cash Book balance 1050 Add direct credit 700 Less bank charges (500) Adjusted cash book balance 1250
(b)
Bank Reconciliation Statement Adjusted cash book balance 1250 Add unpresented cheques – R. Joseph 1750 Bank statement balance 3000
Multiple Choice
1. D 2. C 3. D 4. A 5. B 6. B
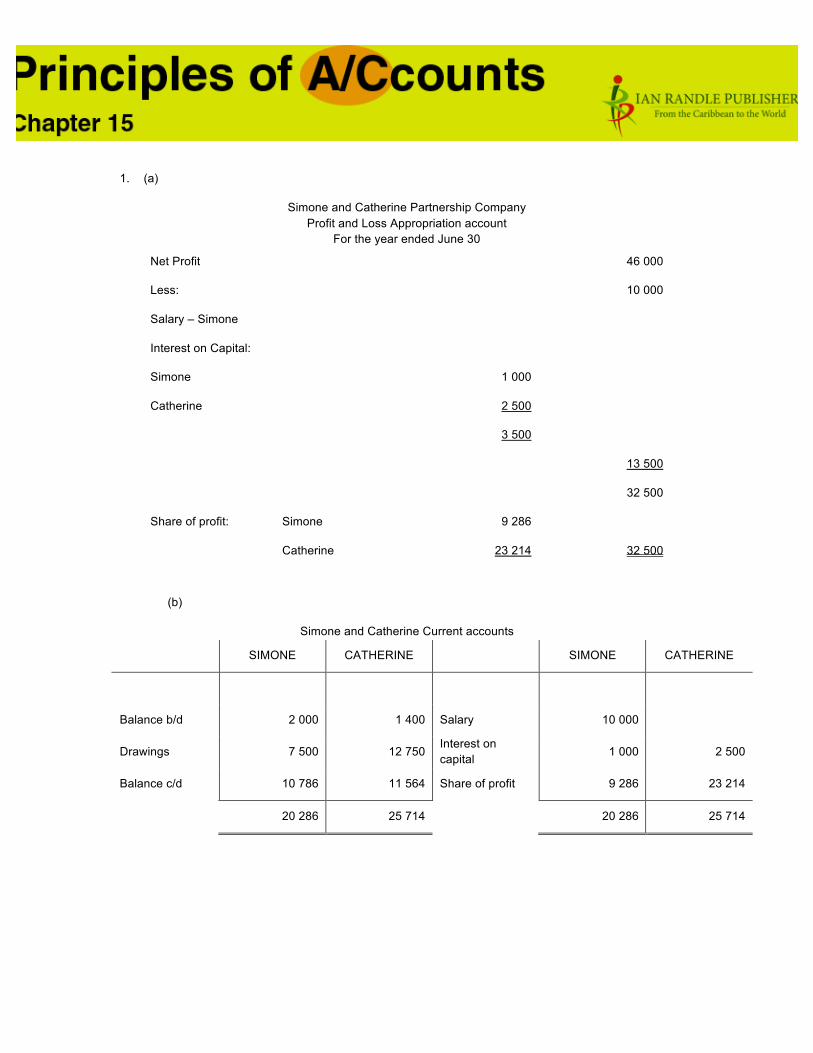
1. (a)
Simone and Catherine Partnership Company Profit and Loss Appropriation account
For the year ended June 30
Net Profit 46 000
Less: 10 000
Salary – Simone
Interest on Capital:
Simone 1 000
Catherine 2 500
3 500
13 500
32 500
Share of profit: Simone 9 286
Catherine 23 214 32 500
(b)
Simone and Catherine Current accounts
SIMONE CATHERINE SIMONE CATHERINE
Balance b/d 2 000 1 400 Salary 10 000
Drawings 7 500 12 750 Interest on capital 1 000 2 500
Balance c/d 10 786 11 564 Share of profit 9 286 23 214
20 286 25 714 20 286 25 714

(c)
Simone and Catherine Partnership Company Balance Sheet As at June 30
Fixed assets 112 550
Current assets:
Stock 3 000
Debtors 14 000
17 000
Less current liabilities
Creditors 12 000
Bank loan 25 200 (37200)
(20 200)
92 350
Financed by
SIMONE CATHERINE
Capital accounts 20 000 50 000 70 000
Current accounts 10 786 11 564 22 350
92 350
2. (a)
Caleb and Garnet General Journal For July 1, 2012
DATE DETAILS DEBIT CREDIT
2012
July 1 cash 12 000
stock 24 000
debtors 2 250
furniture 6 000
premises 20 000
Motor vehicle 9 000
Bank overdraft 2 000
creditors 4 750
Capital: Caleb 32 500
Garnet 34 000
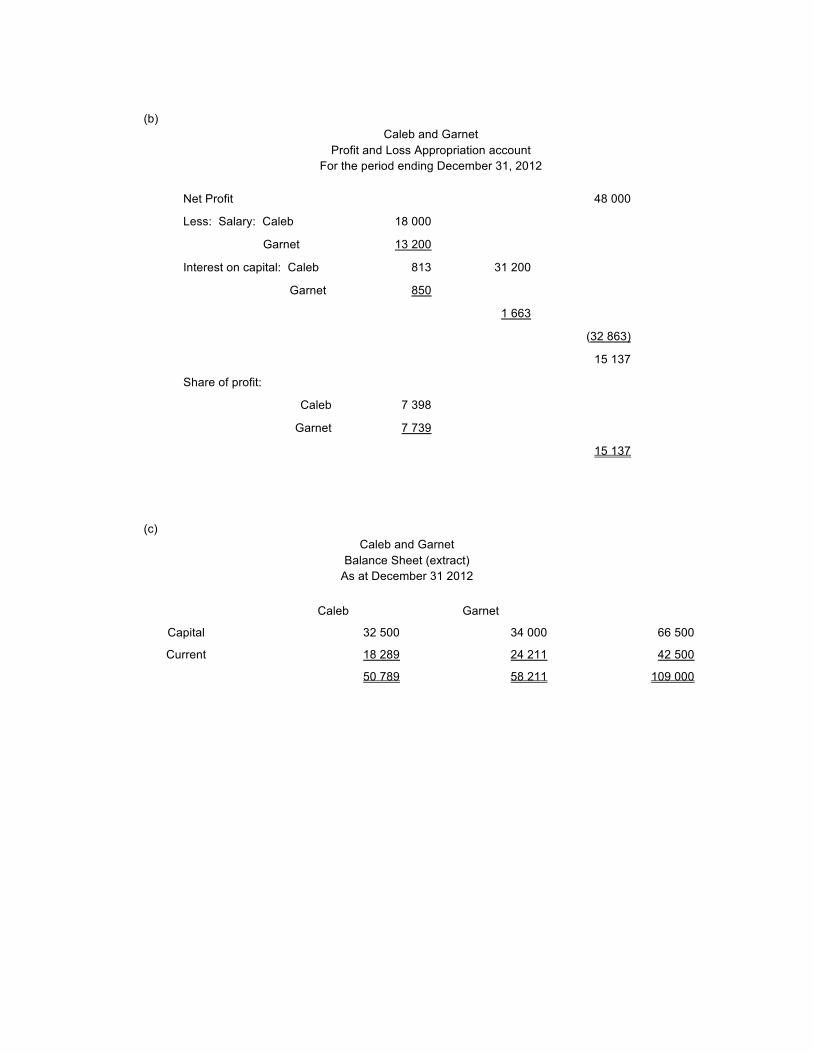
(b)
Caleb and Garnet Profit and Loss Appropriation account
For the period ending December 31, 2012
Net Profit 48 000
Less: Salary: Caleb 18 000
Garnet 13 200
Interest on capital: Caleb 813 31 200
Garnet 850
1 663
(32 863)
15 137
Share of profit:
Caleb 7 398
Garnet 7 739
15 137
(c) Caleb and Garnet
Balance Sheet (extract) As at December 31 2012
Caleb Garnet
Capital 32 500 34 000 66 500
Current 18 289 24 211 42 500
50 789 58 211 109 000
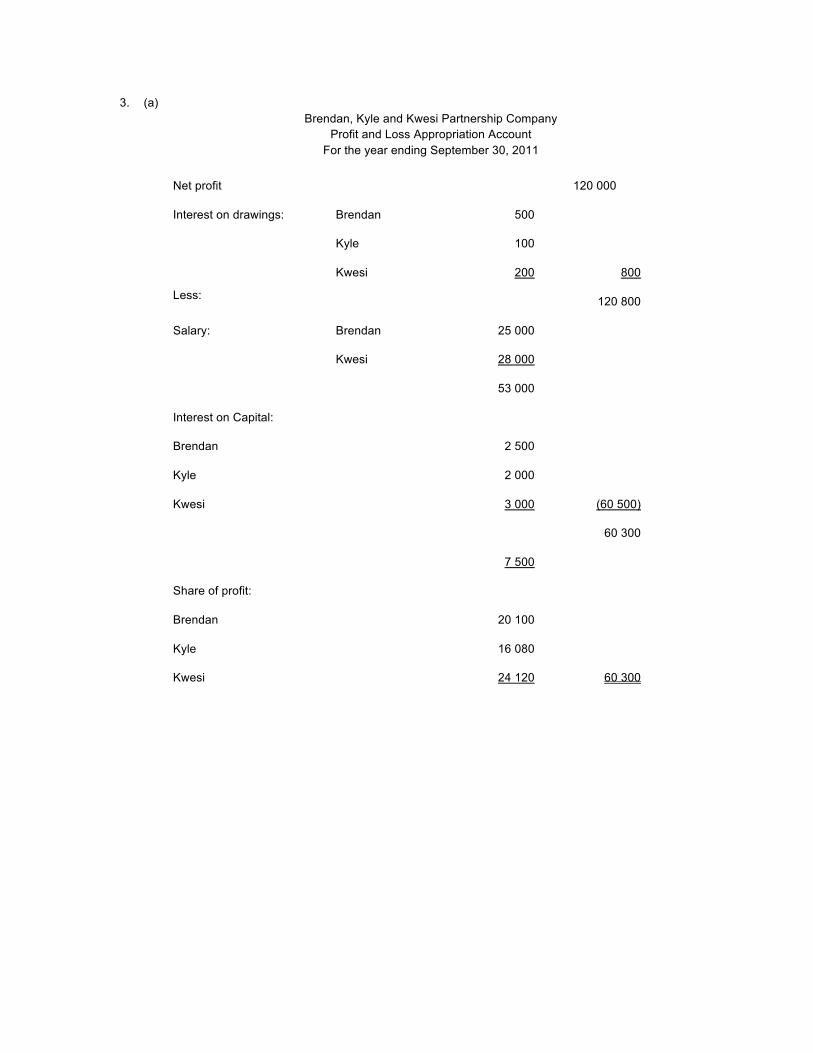
3. (a) Brendan, Kyle and Kwesi Partnership Company
Profit and Loss Appropriation Account For the year ending September 30, 2011
Net profit 120 000
Interest on drawings: Brendan 500
Kyle 100
Kwesi 200 800
Less: 120 800
Salary: Brendan 25 000
Kwesi 28 000
53 000
Interest on Capital:
Brendan 2 500
Kyle 2 000
Kwesi 3 000 (60 500)
60 300
7 500
Share of profit:
Brendan 20 100
Kyle 16 080
Kwesi 24 120 60 300

(b) Brendan, Kyle and Kwesi
Current Accounts
BRENDAN KYLE KWESI BRENDAN KYLE KWESI
Balance b/d 1 000 Balance
b/d 5 000 6 000
Drawings 5 000 1 000 2 000 Salary 25 000 28 000
Interest on drawings
500 100 200 Interest on
capital 2 500 2 000 3 000
Balance c/d 47 100 50 980 23 920 Share of
profit 20 100 16080 24120
52 600 52 080 27 120 52 600 52 080 27 120
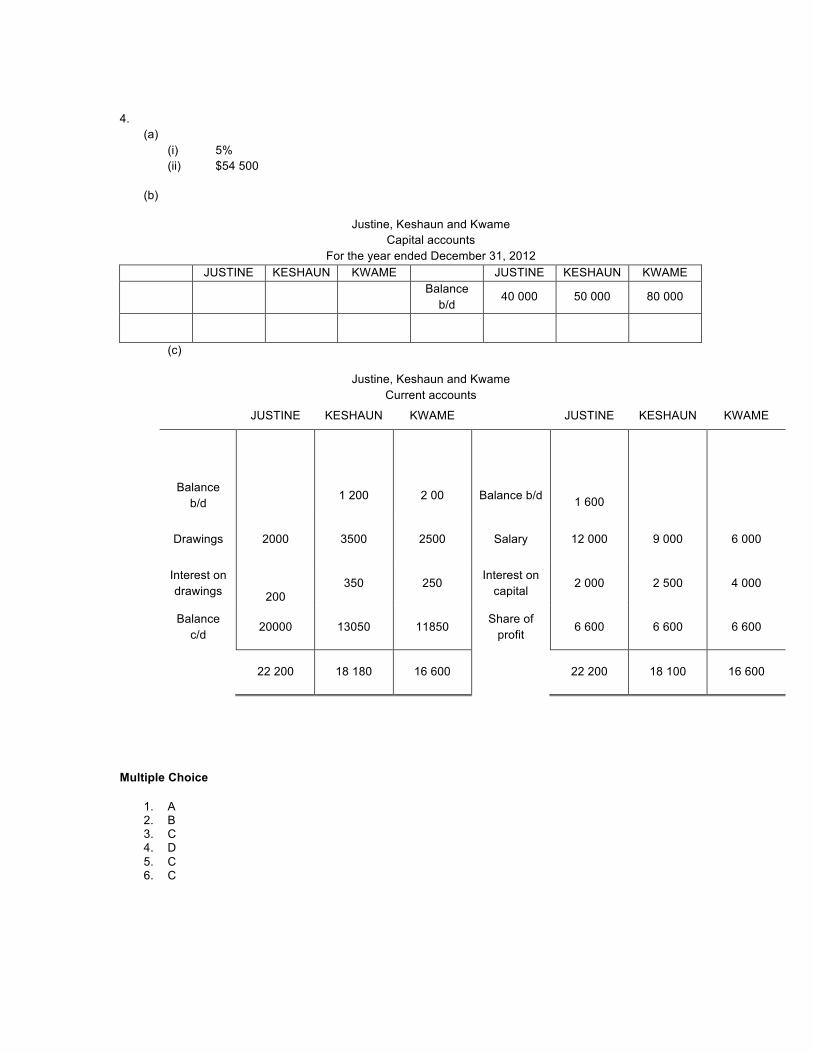
4.
(a) (i) 5% (ii) $54 500
(b)
Justine, Keshaun and Kwame Capital accounts
For the year ended December 31, 2012 JUSTINE KESHAUN KWAME JUSTINE KESHAUN KWAME
Balance b/d
40 000 50 000 80 000
(c)
Justine, Keshaun and Kwame Current accounts
JUSTINE KESHAUN KWAME JUSTINE KESHAUN KWAME
Balance b/d
1 200 2 00 Balance b/d
1 600
Drawings 2000 3500 2500 Salary 12 000 9 000 6 000
Interest on drawings
200 350 250
Interest on capital
2 000 2 500 4 000
Balance c/d
20000 13050 11850 Share of
profit 6 600 6 600 6 600
22 200 18 180 16 600 22 200 18 100 16 600
Multiple Choice
1. A 2. B 3. C 4. D 5. C 6. C
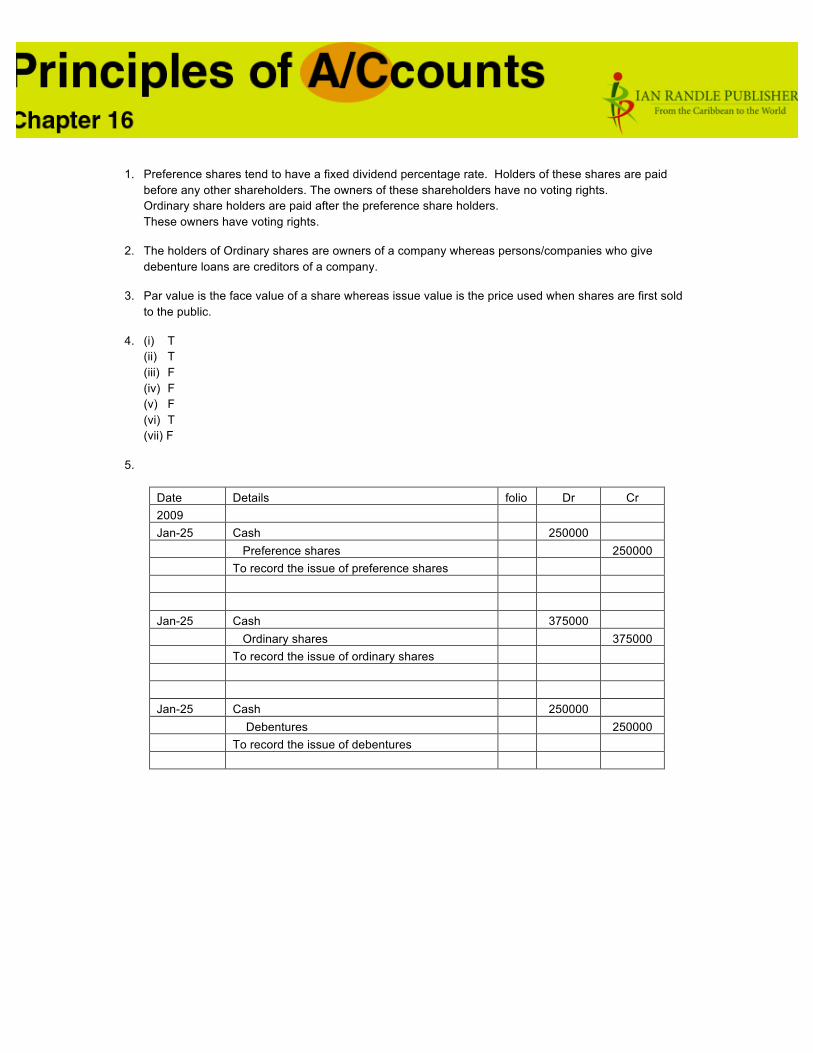
1. Preference shares tend to have a fixed dividend percentage rate. Holders of these shares are paid before any other shareholders. The owners of these shareholders have no voting rights. Ordinary share holders are paid after the preference share holders. These owners have voting rights.
2. The holders of Ordinary shares are owners of a company whereas persons/companies who give debenture loans are creditors of a company.
3. Par value is the face value of a share whereas issue value is the price used when shares are first sold to the public.
4. (i) T (ii) T (iii) F (iv) F (v) F (vi) T (vii) F
5.
Date Details folio Dr Cr 2009 Jan-25 Cash 250000 Preference shares 250000 To record the issue of preference shares Jan-25 Cash 375000 Ordinary shares 375000 To record the issue of ordinary shares Jan-25 Cash 250000 Debentures 250000 To record the issue of debentures
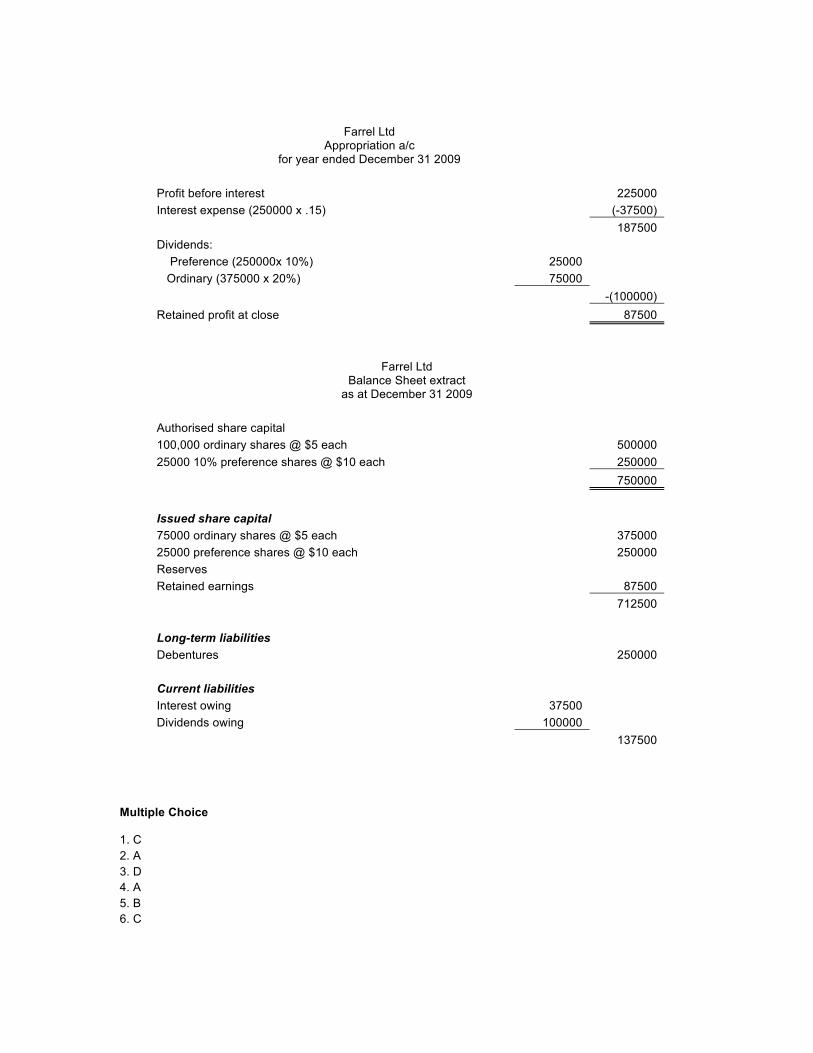
Farrel Ltd Appropriation a/c
for year ended December 31 2009 Profit before interest 225000 Interest expense (250000 x .15) (-37500) 187500 Dividends: Preference (250000x 10%) 25000 Ordinary (375000 x 20%) 75000 -(100000) Retained profit at close 87500
Farrel Ltd Balance Sheet extract
as at December 31 2009 Authorised share capital 100,000 ordinary shares @ $5 each 500000 25000 10% preference shares @ $10 each 250000 750000
Issued share capital 75000 ordinary shares @ $5 each 375000 25000 preference shares @ $10 each 250000 Reserves Retained earnings 87500 712500 Long-term liabilities Debentures 250000 Current liabilities Interest owing 37500 Dividends owing 100000 137500
Multiple Choice 1. C 2. A 3. D 4. A 5. B 6. C
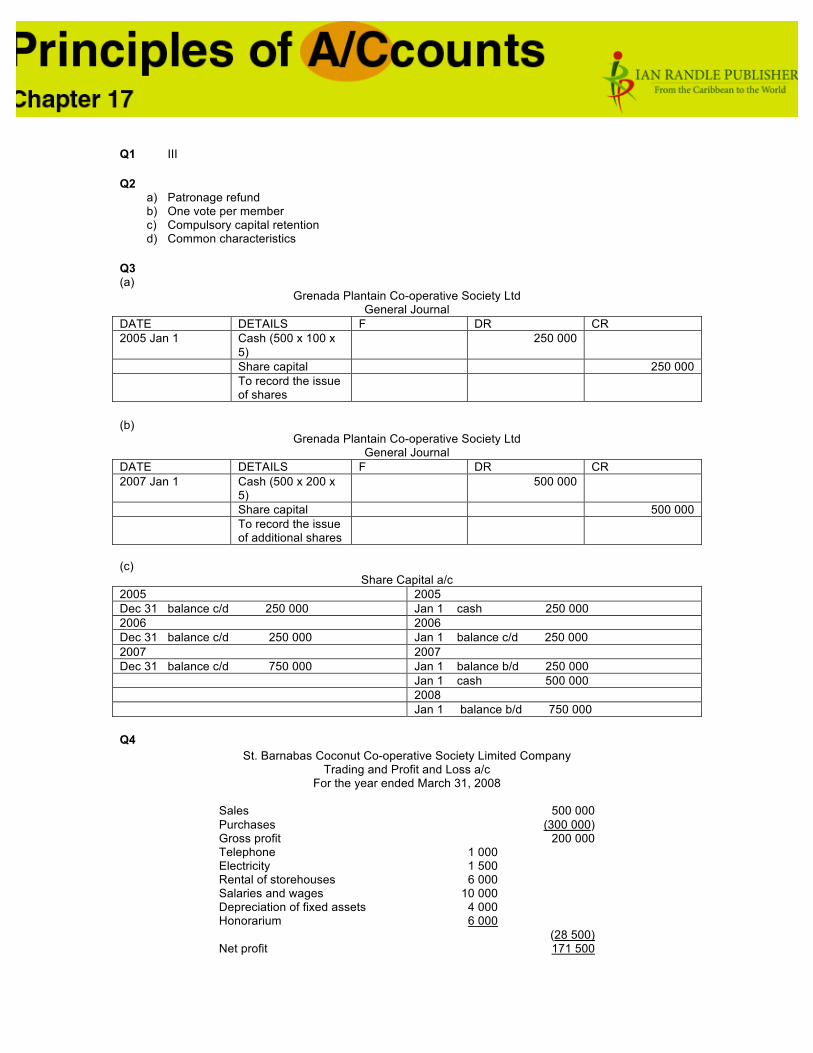
Q1 III Q2
a) Patronage refund b) One vote per member c) Compulsory capital retention d) Common characteristics
Q3 (a)
Grenada Plantain Co-operative Society Ltd General Journal
DATE DETAILS F DR CR 2005 Jan 1 Cash (500 x 100 x
5) 250 000
Share capital 250 000 To record the issue
of shares
(b)
Grenada Plantain Co-operative Society Ltd General Journal
DATE DETAILS F DR CR 2007 Jan 1 Cash (500 x 200 x
5) 500 000
Share capital 500 000 To record the issue
of additional shares
(c)
Share Capital a/c 2005 2005 Dec 31 balance c/d 250 000 Jan 1 cash 250 000 2006 2006 Dec 31 balance c/d 250 000 Jan 1 balance c/d 250 000 2007 2007 Dec 31 balance c/d 750 000 Jan 1 balance b/d 250 000 Jan 1 cash 500 000 2008 Jan 1 balance b/d 750 000 Q4
St. Barnabas Coconut Co-operative Society Limited Company Trading and Profit and Loss a/c
For the year ended March 31, 2008
Sales 500 000 Purchases (300 000) Gross profit 200 000 Telephone 1 000 Electricity 1 500 Rental of storehouses 6 000 Salaries and wages 10 000 Depreciation of fixed assets 4 000 Honorarium 6 000 (28 500) Net profit 171 500
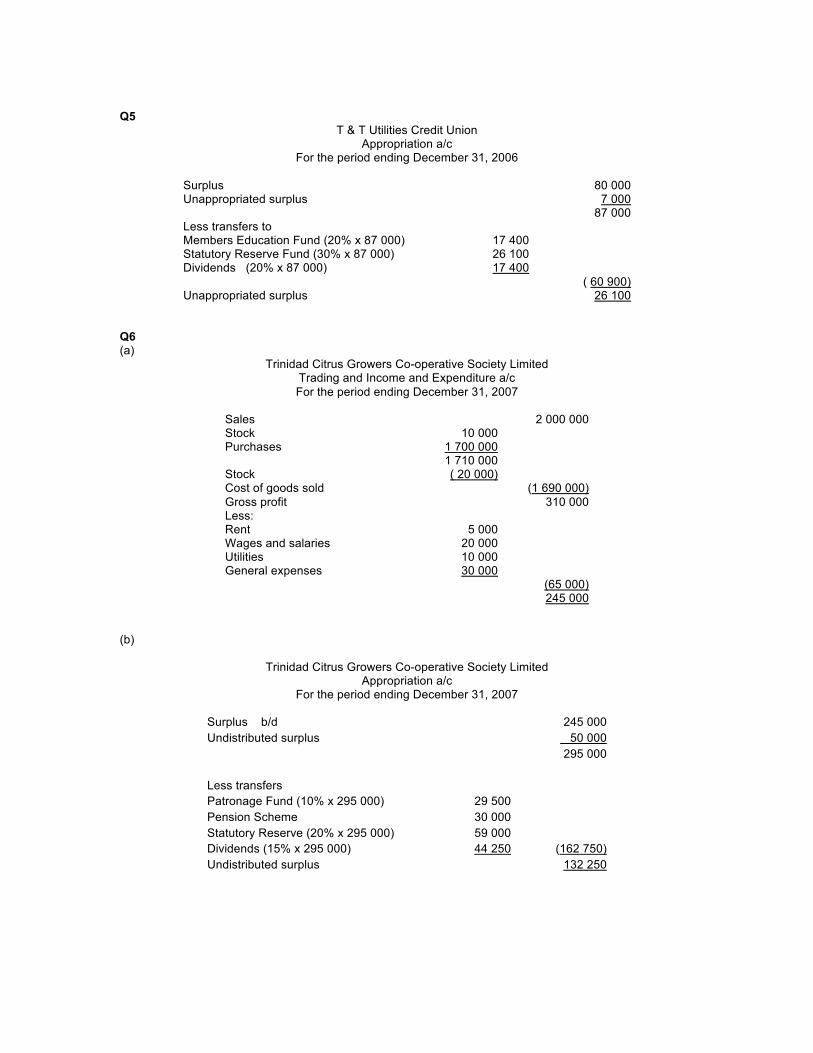
Q5
T & T Utilities Credit Union Appropriation a/c
For the period ending December 31, 2006
Surplus 80 000 Unappropriated surplus 7 000 87 000 Less transfers to Members Education Fund (20% x 87 000) 17 400 Statutory Reserve Fund (30% x 87 000) 26 100 Dividends (20% x 87 000) 17 400 ( 60 900) Unappropriated surplus 26 100
Q6 (a)
Trinidad Citrus Growers Co-operative Society Limited Trading and Income and Expenditure a/c For the period ending December 31, 2007
Sales 2 000 000 Stock 10 000 Purchases 1 700 000 1 710 000 Stock ( 20 000) Cost of goods sold (1 690 000) Gross profit 310 000 Less: Rent 5 000 Wages and salaries 20 000 Utilities 10 000 General expenses 30 000 (65 000) 245 000
(b)
Trinidad Citrus Growers Co-operative Society Limited Appropriation a/c
For the period ending December 31, 2007
Surplus b/d 245 000 Undistributed surplus 50 000 295 000 Less transfers Patronage Fund (10% x 295 000) 29 500 Pension Scheme 30 000 Statutory Reserve (20% x 295 000) 59 000 Dividends (15% x 295 000) 44 250 (162 750) Undistributed surplus 132 250
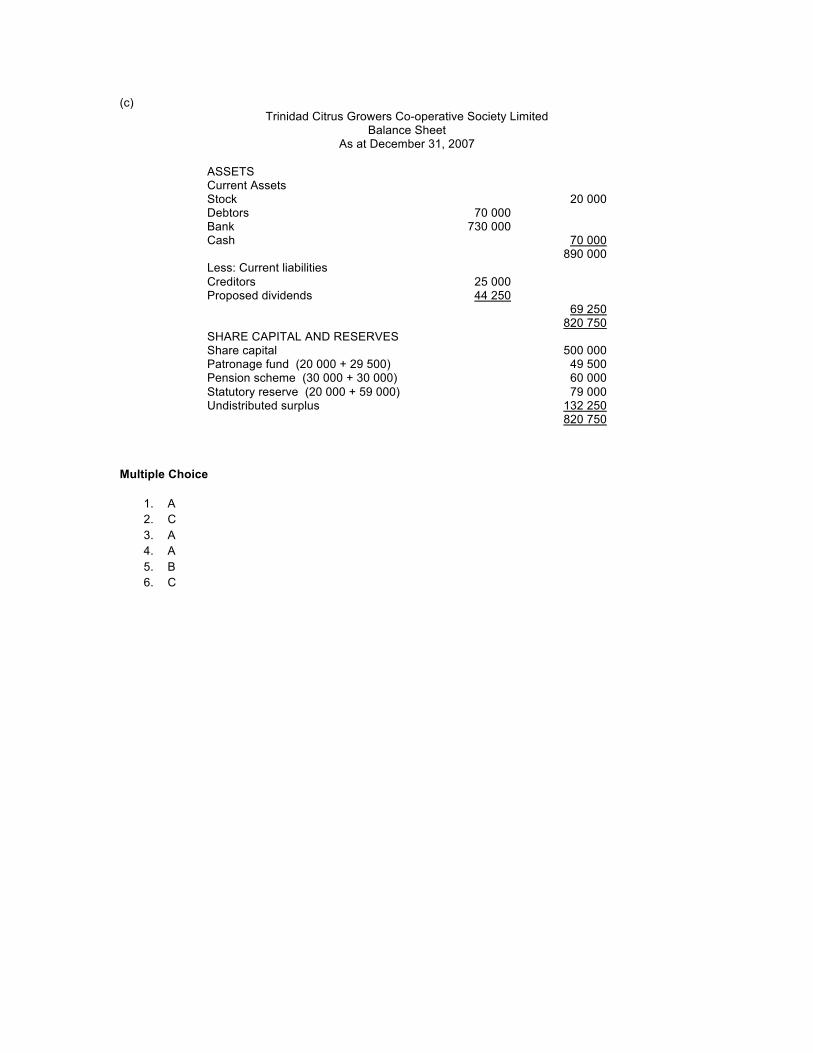
(c) Trinidad Citrus Growers Co-operative Society Limited
Balance Sheet As at December 31, 2007
ASSETS Current Assets Stock 20 000 Debtors 70 000 Bank 730 000 Cash 70 000 890 000 Less: Current liabilities Creditors 25 000 Proposed dividends 44 250 69 250 820 750 SHARE CAPITAL AND RESERVES Share capital 500 000 Patronage fund (20 000 + 29 500) 49 500 Pension scheme (30 000 + 30 000) 60 000 Statutory reserve (20 000 + 59 000) 79 000 Undistributed surplus 132 250 820 750
Multiple Choice
1. A 2. C 3. A 4. A 5. B 6. C
Q1
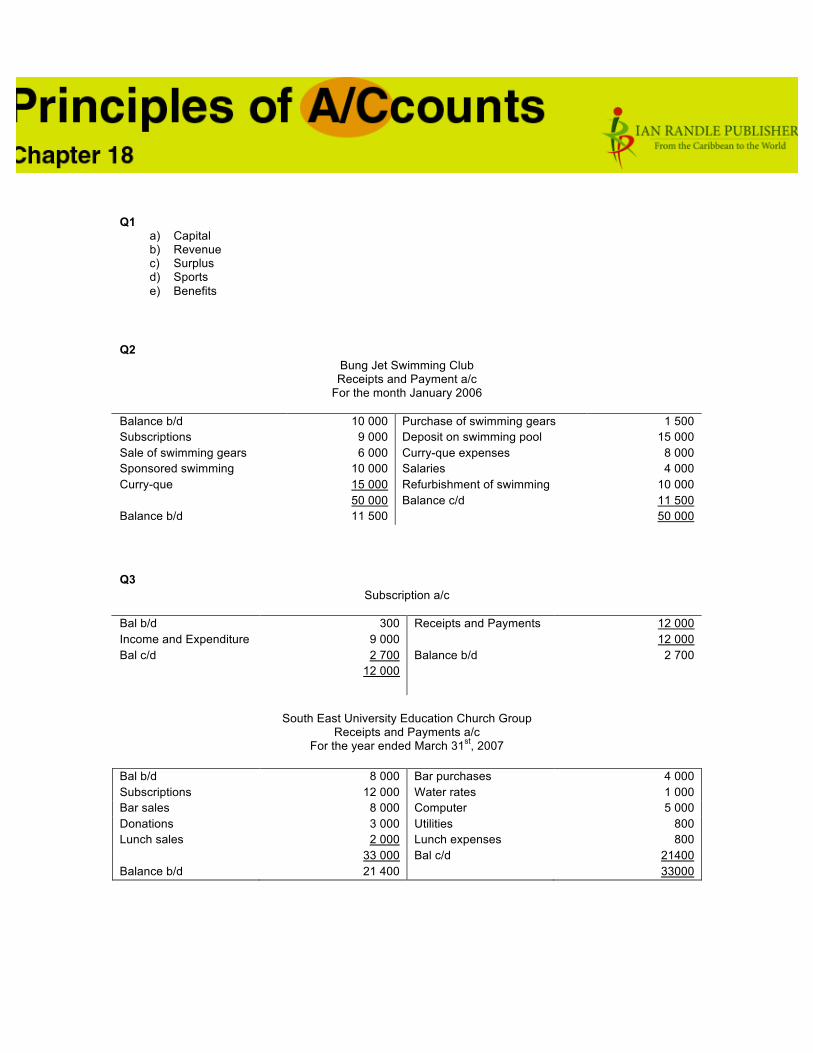
a) Capital b) Revenue c) Surplus d) Sports e) Benefits
Q2 Bung Jet Swimming Club Receipts and Payment a/c
For the month January 2006
Balance b/d 10 000 Purchase of swimming gears 1 500 Subscriptions 9 000 Deposit on swimming pool 15 000 Sale of swimming gears 6 000 Curry-que expenses 8 000 Sponsored swimming 10 000 Salaries 4 000 Curry-que 15 000 Refurbishment of swimming 10 000 50 000 Balance c/d 11 500 Balance b/d 11 500 50 000 Q3
Subscription a/c
Bal b/d 300 Receipts and Payments 12 000 Income and Expenditure 9 000 12 000 Bal c/d 2 700 Balance b/d 2 700 12 000
South East University Education Church Group Receipts and Payments a/c
For the year ended March 31st, 2007 Bal b/d 8 000 Bar purchases 4 000 Subscriptions 12 000 Water rates 1 000 Bar sales 8 000 Computer 5 000 Donations 3 000 Utilities 800 Lunch sales 2 000 Lunch expenses 800 33 000 Bal c/d 21400 Balance b/d 21 400 33000
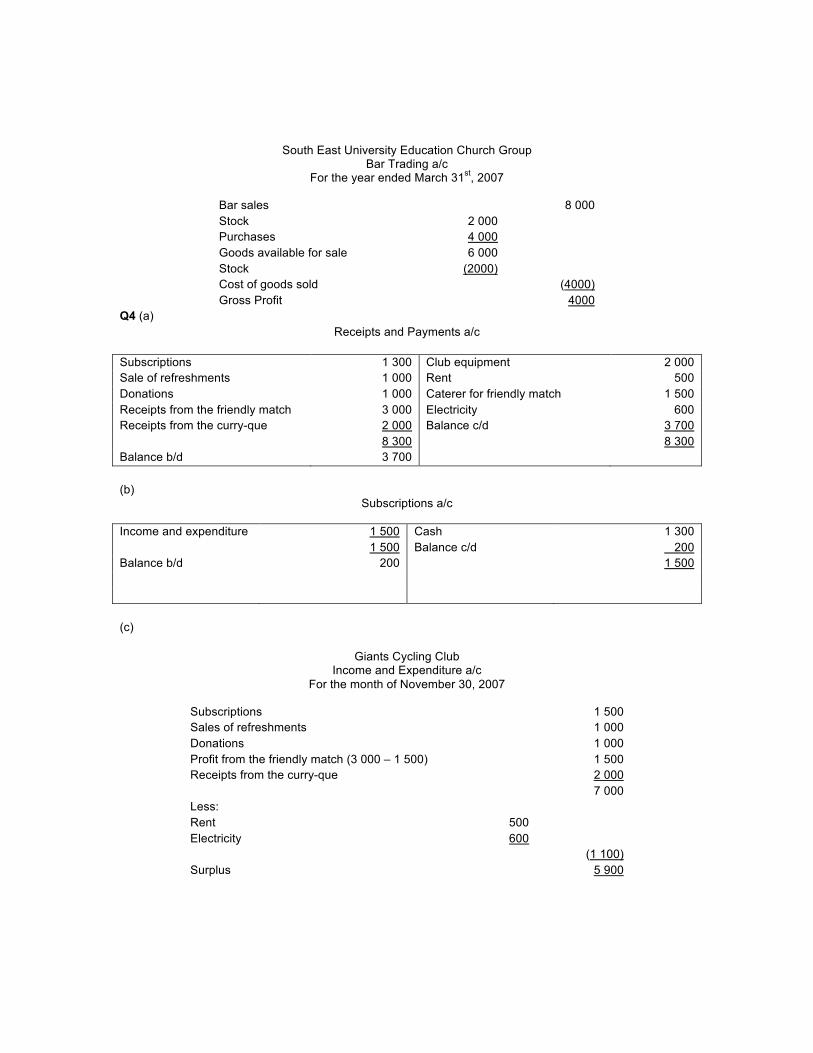
South East University Education Church Group Bar Trading a/c
For the year ended March 31st, 2007
Bar sales 8 000 Stock 2 000 Purchases 4 000 Goods available for sale 6 000 Stock (2000) Cost of goods sold (4000) Gross Profit 4000
Q4 (a) Receipts and Payments a/c
Subscriptions 1 300 Club equipment 2 000 Sale of refreshments 1 000 Rent 500 Donations 1 000 Caterer for friendly match 1 500 Receipts from the friendly match 3 000 Electricity 600 Receipts from the curry-que 2 000 Balance c/d 3 700 8 300 8 300 Balance b/d 3 700 (b)
Subscriptions a/c
Income and expenditure 1 500 Cash 1 300 1 500 Balance c/d 200 Balance b/d 200 1 500 (c)
Giants Cycling Club Income and Expenditure a/c
For the month of November 30, 2007
Subscriptions 1 500 Sales of refreshments 1 000 Donations 1 000 Profit from the friendly match (3 000 – 1 500) 1 500 Receipts from the curry-que 2 000 7 000 Less: Rent 500 Electricity 600 (1 100) Surplus 5 900
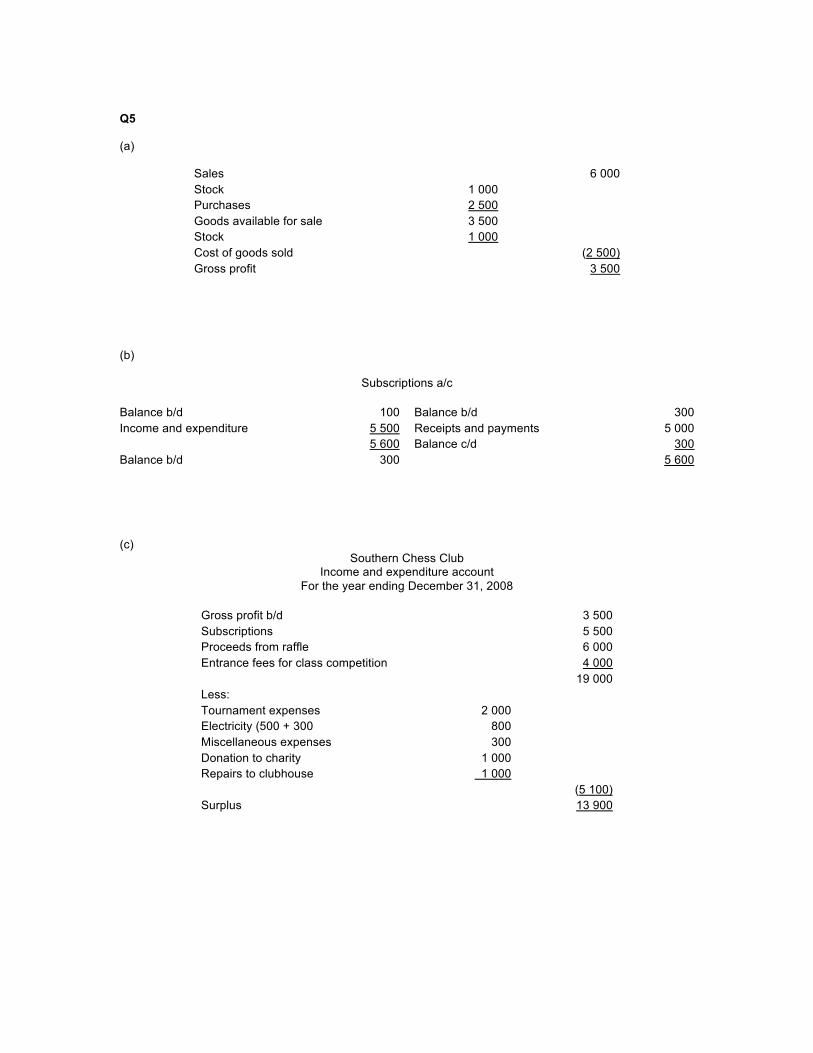
Q5 (a)
Sales 6 000 Stock 1 000 Purchases 2 500 Goods available for sale 3 500 Stock 1 000 Cost of goods sold (2 500) Gross profit 3 500
(b)
Subscriptions a/c Balance b/d 100 Balance b/d 300 Income and expenditure 5 500 Receipts and payments 5 000 5 600 Balance c/d 300 Balance b/d 300 5 600 (c)
Southern Chess Club Income and expenditure account
For the year ending December 31, 2008
Gross profit b/d 3 500 Subscriptions 5 500 Proceeds from raffle 6 000 Entrance fees for class competition 4 000 19 000 Less: Tournament expenses 2 000 Electricity (500 + 300 800 Miscellaneous expenses 300 Donation to charity 1 000 Repairs to clubhouse 1 000 (5 100) Surplus 13 900
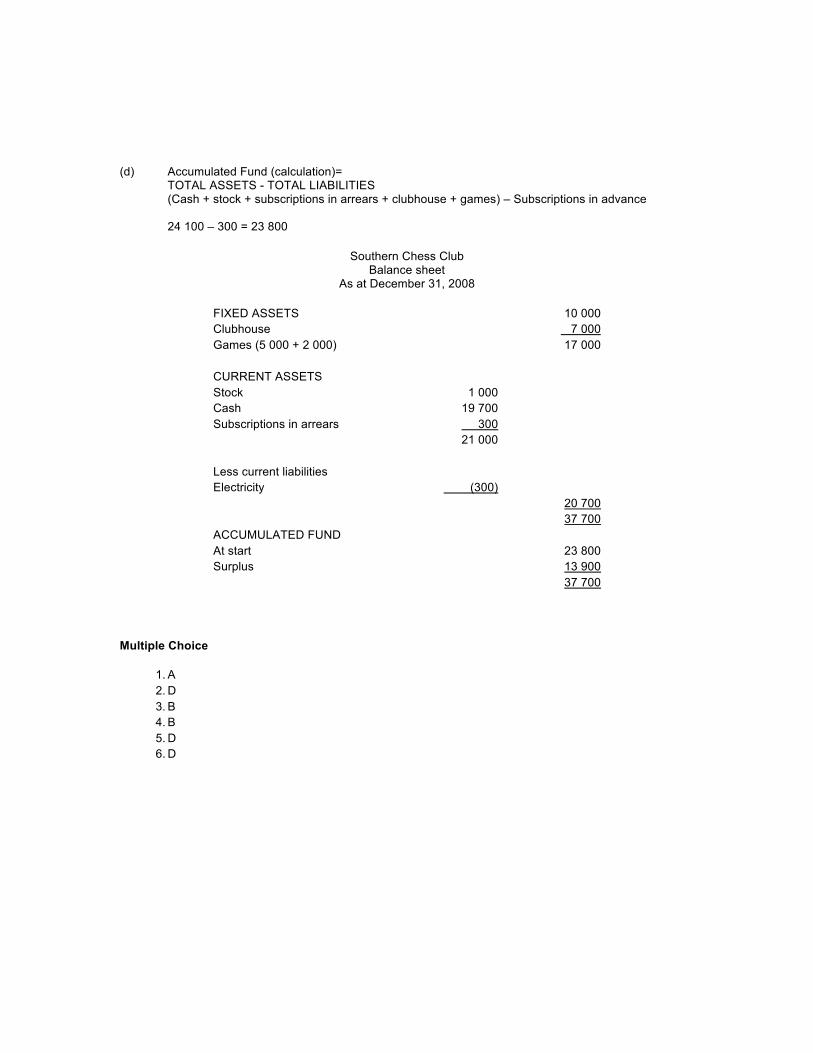
(d) Accumulated Fund (calculation)=
TOTAL ASSETS - TOTAL LIABILITIES (Cash + stock + subscriptions in arrears + clubhouse + games) – Subscriptions in advance
24 100 – 300 = 23 800
Southern Chess Club
Balance sheet As at December 31, 2008
FIXED ASSETS 10 000 Clubhouse 7 000 Games (5 000 + 2 000) 17 000 CURRENT ASSETS Stock 1 000 Cash 19 700 Subscriptions in arrears 300 21 000 Less current liabilities Electricity (300) 20 700 37 700 ACCUMULATED FUND At start 23 800 Surplus 13 900
37 700
Multiple Choice
1. A 2. D 3. B 4. B 5. D 6. D
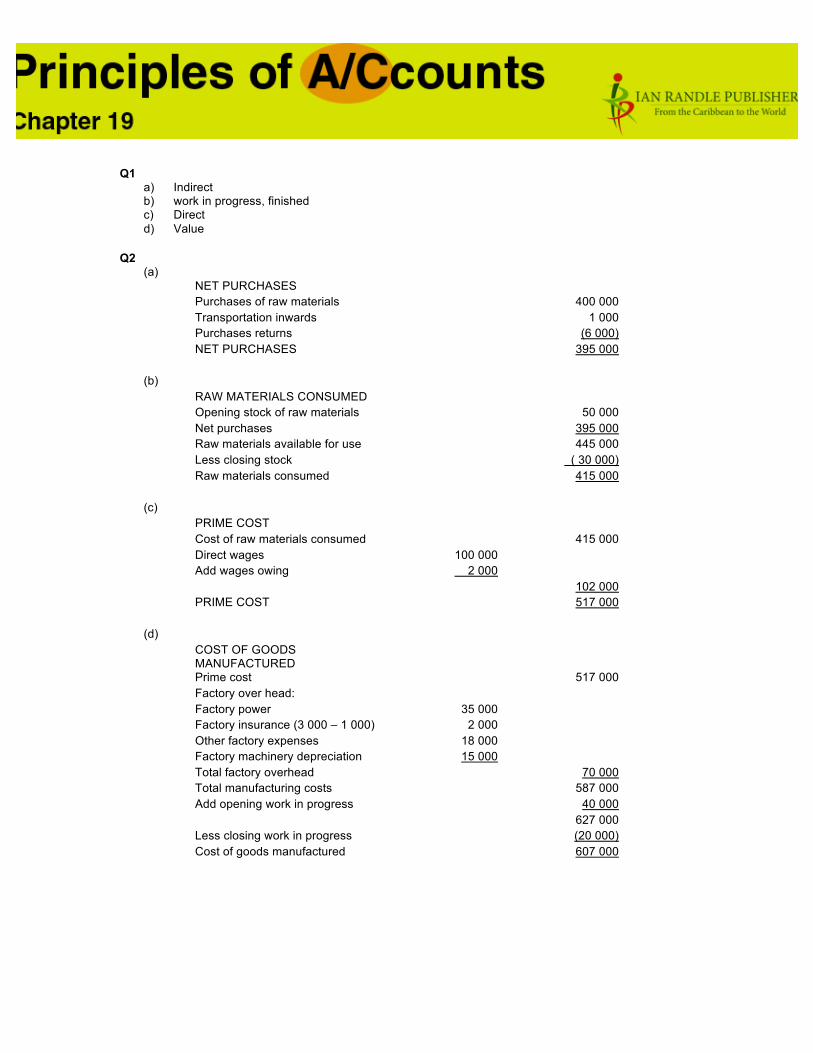
Q1
a) Indirect b) work in progress, finished c) Direct d) Value
Q2
(a) NET PURCHASES Purchases of raw materials 400 000 Transportation inwards 1 000 Purchases returns (6 000) NET PURCHASES 395 000
(b)
RAW MATERIALS CONSUMED Opening stock of raw materials 50 000 Net purchases 395 000 Raw materials available for use 445 000 Less closing stock ( 30 000) Raw materials consumed 415 000
(c)
PRIME COST Cost of raw materials consumed 415 000 Direct wages 100 000 Add wages owing 2 000 102 000 PRIME COST 517 000
(d)
COST OF GOODS MANUFACTURED
Prime cost 517 000 Factory over head: Factory power 35 000 Factory insurance (3 000 – 1 000) 2 000 Other factory expenses 18 000 Factory machinery depreciation 15 000 Total factory overhead 70 000 Total manufacturing costs 587 000 Add opening work in progress 40 000 627 000 Less closing work in progress (20 000) Cost of goods manufactured 607 000
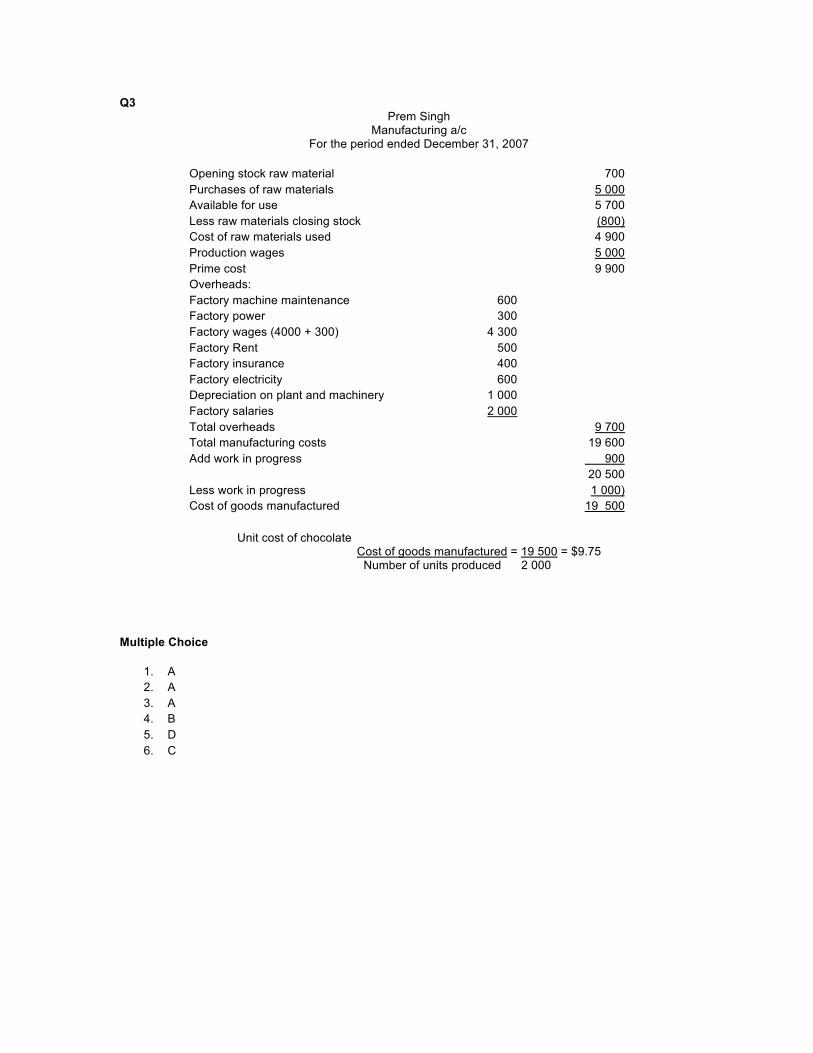
Q3 Prem Singh
Manufacturing a/c For the period ended December 31, 2007
Opening stock raw material 700 Purchases of raw materials 5 000 Available for use 5 700 Less raw materials closing stock (800) Cost of raw materials used 4 900 Production wages 5 000 Prime cost 9 900 Overheads: Factory machine maintenance 600 Factory power 300 Factory wages (4000 + 300) 4 300 Factory Rent 500 Factory insurance 400 Factory electricity 600 Depreciation on plant and machinery 1 000 Factory salaries 2 000 Total overheads 9 700 Total manufacturing costs 19 600 Add work in progress 900 20 500 Less work in progress 1 000) Cost of goods manufactured 19 500
Unit cost of chocolate Cost of goods manufactured = 19 500 = $9.75 Number of units produced 2 000
Multiple Choice
1. A 2. A 3. A 4. B 5. D 6. C
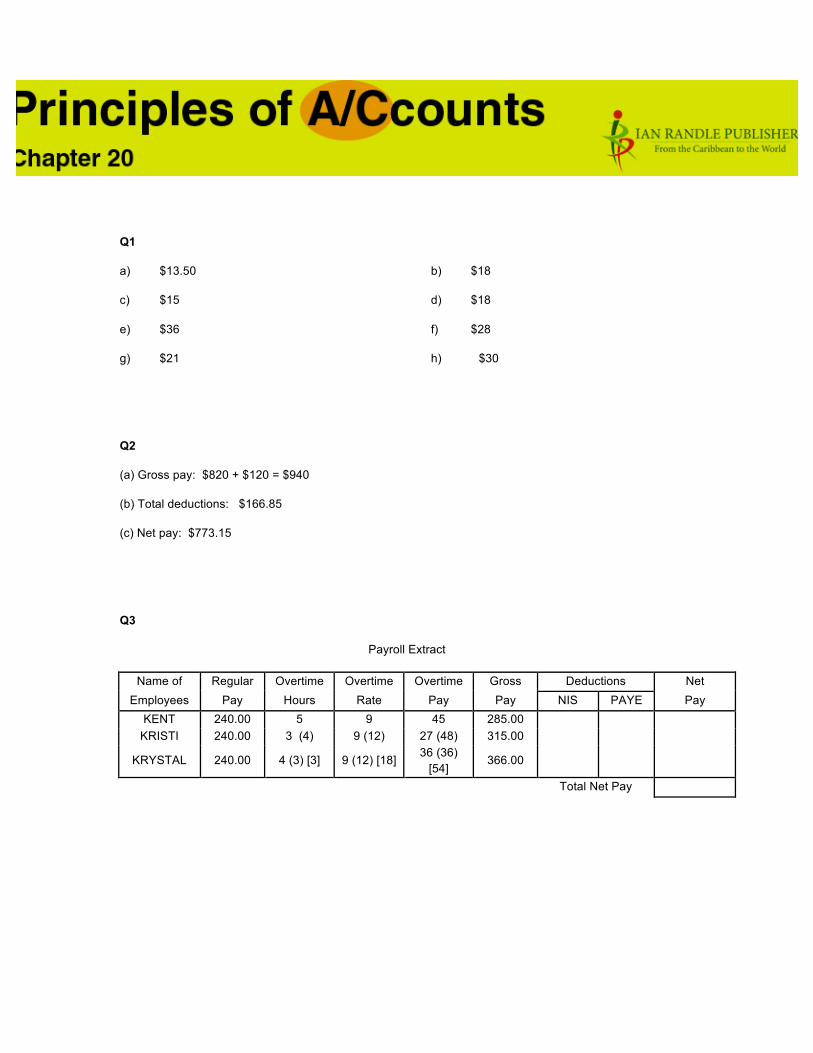
Q1
a) $13.50 b) $18
c) $15 d) $18
e) $36 f) $28
g) $21 h) $30
Q2
(a) Gross pay: $820 + $120 = $940
(b) Total deductions: $166.85
(c) Net pay: $773.15
Q3
Payroll Extract
Name of Regular Overtime Overtime Overtime Gross Deductions Net Employees Pay Hours Rate Pay Pay NIS PAYE Pay
KENT 240.00 5 9 45 285.00 KRISTI 240.00 3 (4) 9 (12) 27 (48) 315.00
KRYSTAL 240.00 4 (3) [3] 9 (12) [18] 36 (36) [54]
366.00
Total Net Pay
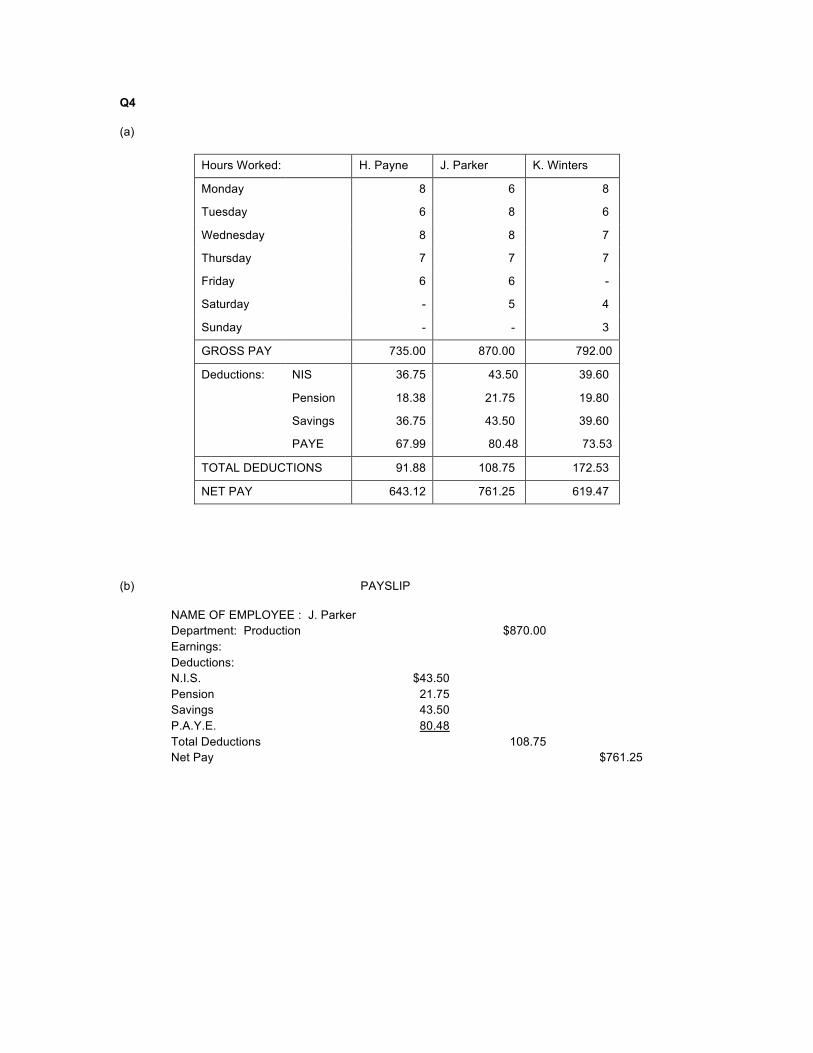
Q4
(a)
Hours Worked: H. Payne J. Parker K. Winters
Monday 8 6 8
Tuesday 6 8 6
Wednesday 8 8 7
Thursday 7 7 7
Friday 6 6 -
Saturday - 5 4
Sunday - - 3
GROSS PAY 735.00 870.00 792.00
Deductions: NIS 36.75 43.50 39.60
Pension 18.38 21.75 19.80
Savings 36.75 43.50 39.60
PAYE 67.99 80.48 73.53
TOTAL DEDUCTIONS 91.88 108.75 172.53
NET PAY 643.12 761.25 619.47
(b) PAYSLIP
NAME OF EMPLOYEE : J. Parker Department: Production $870.00 Earnings: Deductions: N.I.S. $43.50 Pension 21.75 Savings 43.50 P.A.Y.E. 80.48 Total Deductions 108.75 Net Pay $761.25
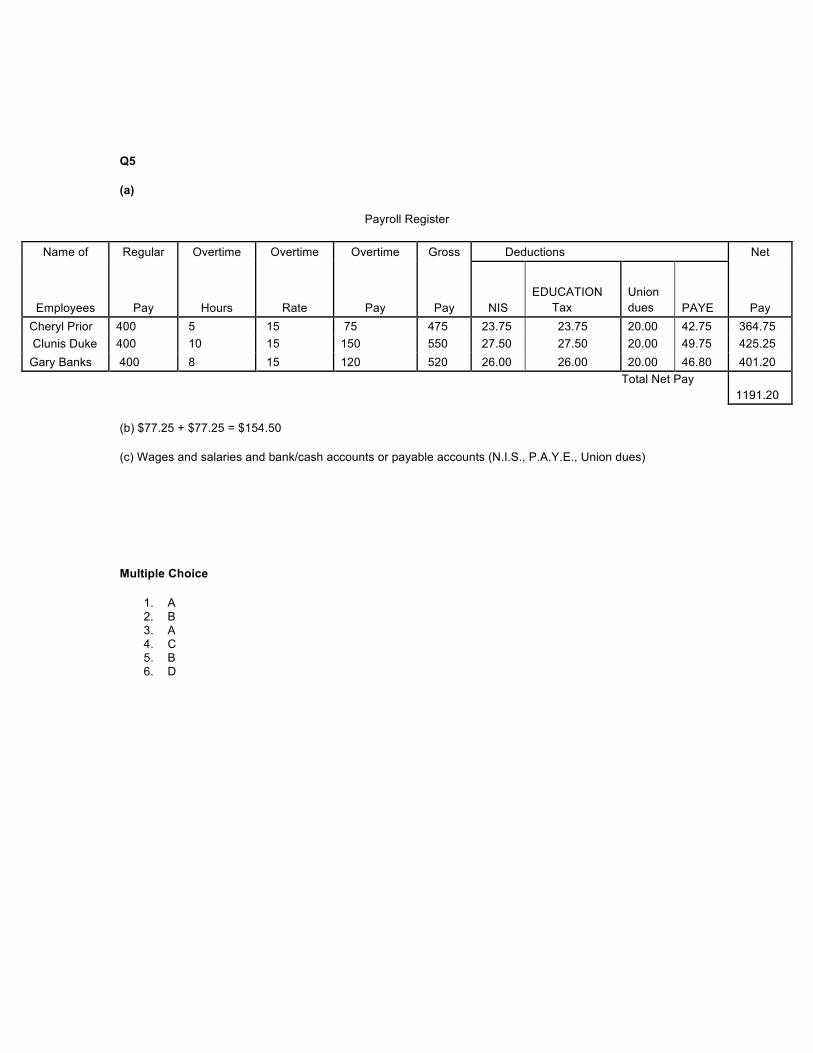
Q5
(a)
Payroll Register
Name of Regular Overtime Overtime Overtime Gross Deductions Net
Employees Pay Hours Rate Pay Pay NIS EDUCATION Tax
Union dues PAYE Pay
Cheryl Prior 400 5 15 75 475 23.75 23.75 20.00 42.75 364.75 Clunis Duke 400 10 15 150 550 27.50 27.50 20.00 49.75 425.25 Gary Banks 400 8 15 120 520 26.00 26.00 20.00 46.80 401.20
Total Net Pay 1191.20
(b) $77.25 + $77.25 = $154.50
(c) Wages and salaries and bank/cash accounts or payable accounts (N.I.S., P.A.Y.E., Union dues)
Multiple Choice
1. A 2. B 3. A 4. C 5. B 6. D