Embed Size (px)
Citation preview

1
Measurement and Measurement and Analysis of LDAP Analysis of LDAP
PerformancePerformance
Xin Wang( Xin Wang([email protected]@ctr.columbia.edu), ), Henning Schulzrinne, Dilip Henning Schulzrinne, Dilip
Kandlur, Dinesh VermaKandlur, Dinesh Verma

2
OutlineOutline
• BackgroundBackground
• Experimental SetupExperimental Setup
• Test MethodologyTest Methodology
• Result AnalysisResult Analysis
• Related Work Related Work
• ConclusionConclusion

3
BackgroundBackground
• What is LDAP?What is LDAP?– A directory service is a A directory service is a
simplified database, primarily simplified database, primarily for high volume readfor high volume read
– LDAP: Lightweight Directory LDAP: Lightweight Directory Access Protocols. Access Protocols.
– A client-server model, over A client-server model, over TCP/IPTCP/IP
– Tree structure: entry, Tree structure: entry, attributes, valuesattributes, values
– Operations: add, delete, Operations: add, delete, modify, compare, and search.modify, compare, and search.

4
Background (cont’d.)Background (cont’d.)
• LDAP for SLS AdministrationLDAP for SLS Administration– Service level specification: type of Service level specification: type of
service provided, traffic constraints, service provided, traffic constraints, etc.etc.
– LDAP directory contains: SLS, policy LDAP directory contains: SLS, policy rules, network provisioning rules, network provisioning information.information.
– Decision entities download Decision entities download classification rules, service classification rules, service specifications, and poll service specifications, and poll service periodically.periodically.
– Enforcement entities query rules from Enforcement entities query rules from the decision entities and enforce the decision entities and enforce themthem

5
LDAP StructureLDAP Structure

6
Experimental SetupExperimental Setup
• Hardware: Hardware: – Server: dual processor Ultra-2, Server: dual processor Ultra-2,
200 MHz CPUs, 256 MB main 200 MHz CPUs, 256 MB main memory memory
– Clients: Ultra1, 170 MHz CPU, Clients: Ultra1, 170 MHz CPU, 128 MB main memory128 MB main memory
– 10 Mb/s Ethernet10 Mb/s Ethernet
• LDAP server:LDAP server:– OpenLDAP 1.2OpenLDAP 1.2– LDBM backend: A high LDBM backend: A high
performance disk-based performance disk-based databasedatabase
– Berkeley DB 2.4.14, Berkeley DB 2.4.14, dbcachesize: 10 MB cachesize: dbcachesize: 10 MB cachesize: vary vary

7
Experimental Setup (cont’d)Experimental Setup (cont’d)
• LDAP ClientLDAP Client

8
Test MethodologyTest Methodology
• Search for downloading policy Search for downloading policy
rulesrules
• Search filter: interface address, Search filter: interface address,
policy object. policy object.
• Default size: 10,000 entries, Default size: 10,000 entries,
entry size 488 bytesentry size 488 bytes
• Search operation:Search operation:
– ldap_search, ldap_bind, ldap_search, ldap_bind,
ldap_search, ldap_unbind.ldap_search, ldap_unbind.
9
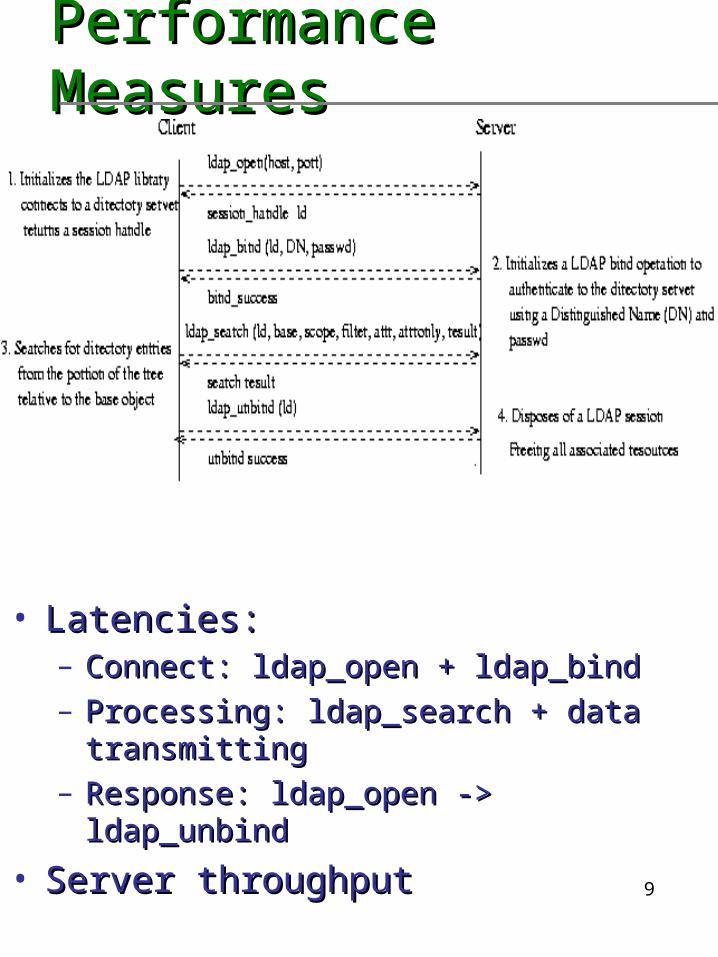
Performance MeasuresPerformance Measures
• Latencies:Latencies:– Connect: ldap_open + ldap_bindConnect: ldap_open + ldap_bind– Processing: ldap_search + data Processing: ldap_search + data
transmittingtransmitting– Response: ldap_open -> ldap_unbindResponse: ldap_open -> ldap_unbind
• Server throughput Server throughput

10
Performance Measures (cont’d)Performance Measures (cont’d)
• Use latencies and throughput to Use latencies and throughput to
evaluate:evaluate:– Overall LDAP performance Overall LDAP performance – Steps to improve system performanceSteps to improve system performance– How individual system components How individual system components
affect performanceaffect performance– System scalability and performance System scalability and performance
limitslimits– Performance under update loadPerformance under update load

11
Overall PerformanceOverall Performance

12
Components of LDAP Search Components of LDAP Search LatencyLatency
Client Server

13
Components of LDAP Connect Components of LDAP Connect LatencyLatency

14
Effect of Nagle Algorithm Effect of Nagle Algorithm

15
Effect of Caching EntriesEffect of Caching Entries

16
Single vs. Dual ProcessorSingle vs. Dual Processor

17
Single vs. Dual ProcessorSingle vs. Dual Processor

18
Scaling of Directory SizeScaling of Directory Size

19
Scaling of Directory Entry Size Scaling of Directory Entry Size (in-memory)(in-memory)

20
Scaling of Directory Entry Size Scaling of Directory Entry Size (out-of-memory)(out-of-memory)

21
Connection ReuseConnection Reuse

22
Performance of Add OperationPerformance of Add Operation

23
Related WorkRelated Work
• MindcraftMindcraft– Netscape Directory Server 3.0 (NSD3) Netscape Directory Server 3.0 (NSD3)
Netscape Directory Server 1.0 (NSD1) Netscape Directory Server 1.0 (NSD1) Novell LDAP services (NDS)Novell LDAP services (NDS)
– 10,000 entry personnel DB10,000 entry personnel DB– Pentium Pro 200 MHz, 512 MB RAMPentium Pro 200 MHz, 512 MB RAM– All experiments are in memoryAll experiments are in memory– ThroughputThroughput
• NSD3: 183 requests/secondNSD3: 183 requests/second• NSD1: 38.4 requests/secondNSD1: 38.4 requests/second• NDS: 0.8 requests/secondNDS: 0.8 requests/second• CPU is found to be the bottleneckCPU is found to be the bottleneck

24
ConclusionConclusion
• General Results:General Results:– response latency 8 ms up to response latency 8 ms up to
105 requests/second105 requests/second– Maximum throughput Maximum throughput
140 requests/second140 requests/second– 5 ms processing latency - 36% from 5 ms processing latency - 36% from
backend, 64% from front endbackend, 64% from front end– Connect time dominates at high load, Connect time dominates at high load,
and limits the throughput and limits the throughput
• Disabling Nagle Algorithm reduces Disabling Nagle Algorithm reduces latency about 50 mslatency about 50 ms
• Entry Caching:Entry Caching:– for 10,000 entry directory caching all for 10,000 entry directory caching all
entries gives 40% improvement in entries gives 40% improvement in processing time, 25% improvement in processing time, 25% improvement in throughputthroughput

25
Conclusion (cont’d)Conclusion (cont’d)
• Scaling of Directory Size:Scaling of Directory Size:– In memory operation, 10,000 -> In memory operation, 10,000 ->
50,000: processing time increases 50,000: processing time increases 60%, throughput reduces 21%.60%, throughput reduces 21%.
– Out-of-memory, 50,000 ->100,000: Out-of-memory, 50,000 ->100,000: processing time increases another processing time increases another 87%, and throughput reduces 23%. 87%, and throughput reduces 23%.
• Scaling of Entry Size (488 ->4880 Scaling of Entry Size (488 ->4880 bytes):bytes):– In-memory, mainly increase in front-In-memory, mainly increase in front-
end processing, i.e., time for ASN.1 end processing, i.e., time for ASN.1 encoding . Processing time increases encoding . Processing time increases 8 ms, 88% due to ASN.1 encoding, 8 ms, 88% due to ASN.1 encoding, and throughput reduces 30%. and throughput reduces 30%.
– Out-of-memory, throughput reduces Out-of-memory, throughput reduces 70%, mainly due to increased data 70%, mainly due to increased data transfer time. transfer time.

26
Conclusion (cont’d)Conclusion (cont’d)
• CPU: CPU: – During in-memory operation, dual During in-memory operation, dual
processors improve performance by processors improve performance by 40%.40%.
• Connection Re-use:Connection Re-use:– 60% performance gain when 60% performance gain when
connection left open. connection left open.