Embed Size (px)
Citation preview
1
Measuring and Managing Method Variability
Lucinda (Cindy) Buhse, PhDDirector, Division of Pharmaceutical Analysis
Advisory Committee for Pharmaceutical Science (ACPS)October 25, 2005

2
FDA Proposal to Advisory Committee in May
Alternative approach to dissolution calibration and validation:
• Perform stringent mechanical calibration to replace the need for a calibrator tablet
• ID and control all sources of variability– Apparatus type including sinkers– Set-up,calibration and operational parameters– Media including degassing
• Understand interaction between instrument and product during pharmaceutical development
• If necessary, establish an internal calibrator (bio-batch or clinical batch) for system suitability and stability
• Confirm suitability using Gauge R&R using pivotal clinical trial product or pivotal “bio-batch”
3
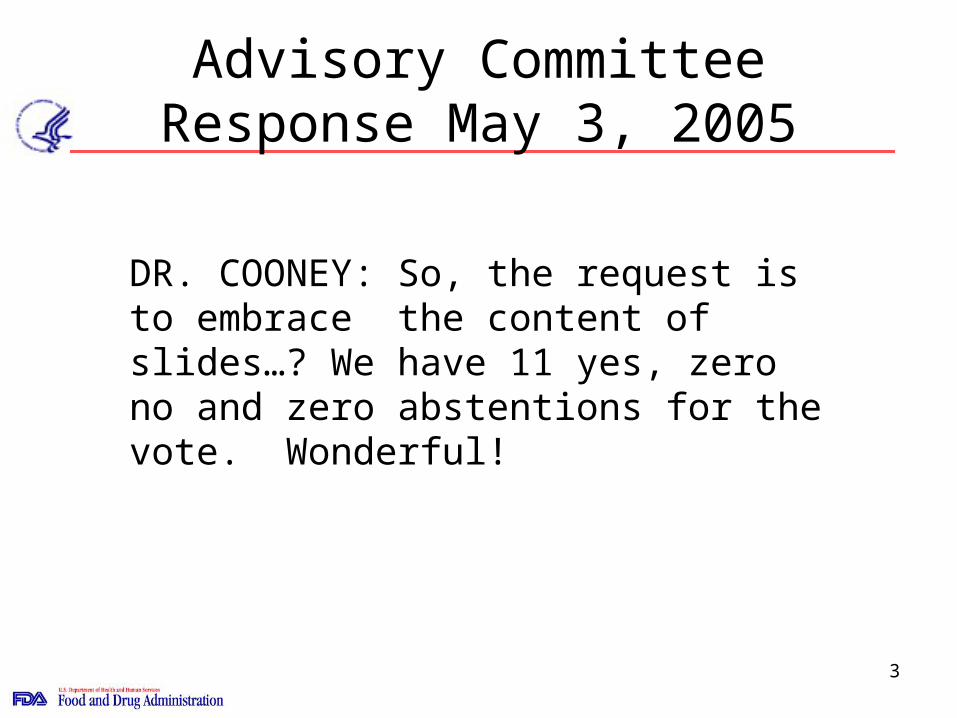
Advisory Committee Response May 3, 2005
DR. COONEY: So, the request is to embrace the content of slides…? We have 11 yes, zero no and zero abstentions for the vote. Wonderful!
4
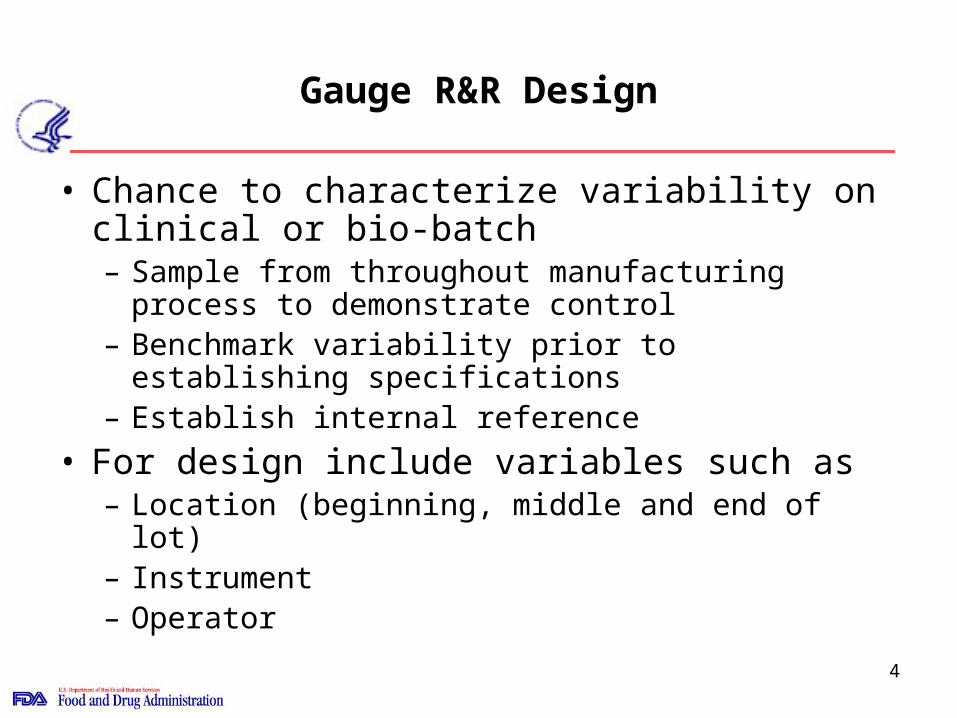
Gauge R&R Design
• Chance to characterize variability on clinical or bio-batch – Sample from throughout manufacturing process to
demonstrate control– Benchmark variability prior to establishing
specifications– Establish internal reference
• For design include variables such as– Location (beginning, middle and end of lot)– Instrument– Operator

5
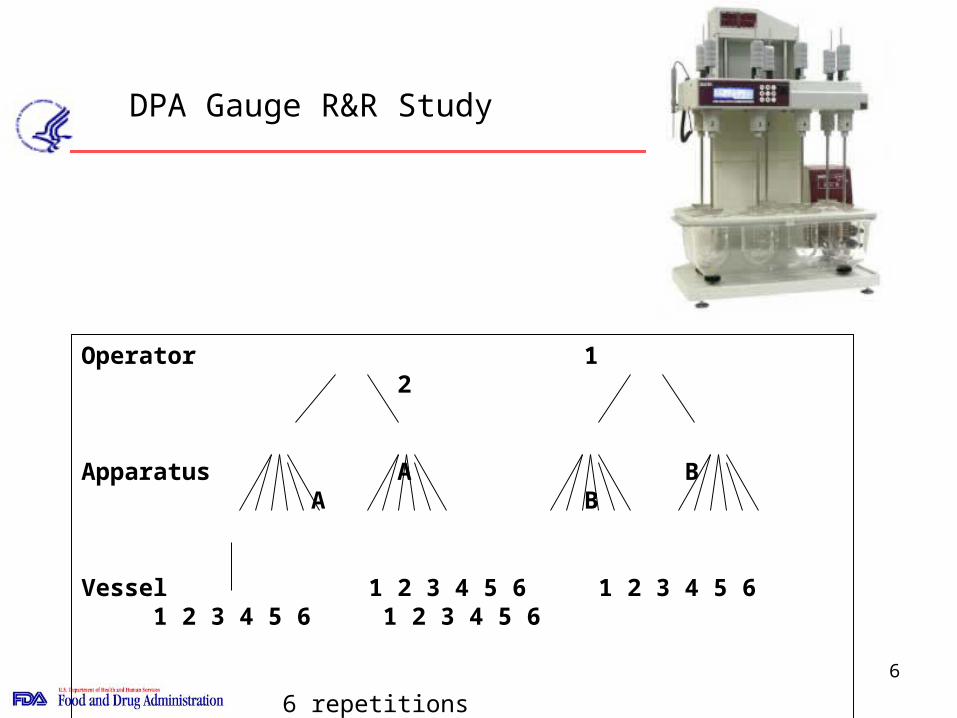
DPA gauge R&R study
• Product: NCDA#2 10mg Prednisone Tablet• Stable• History at DPA – known to be sensitive to degassing and
mechanical calibration tolerances
• Design of Study:• 2 operators • 2 mechanically calibrated USP Apparatus (Paddle)• Nested study design, N= 2x2x6• 6 replications for each operator on each apparatus
6
Operator 1 2
Apparatus A B A B
Vessel 1 2 3 4 5 6 1 2 3 4 5 6 1 2 3 4 5 6 1 2 3 4 5 6
6 repetitions
DPA Gauge R&R Study
7
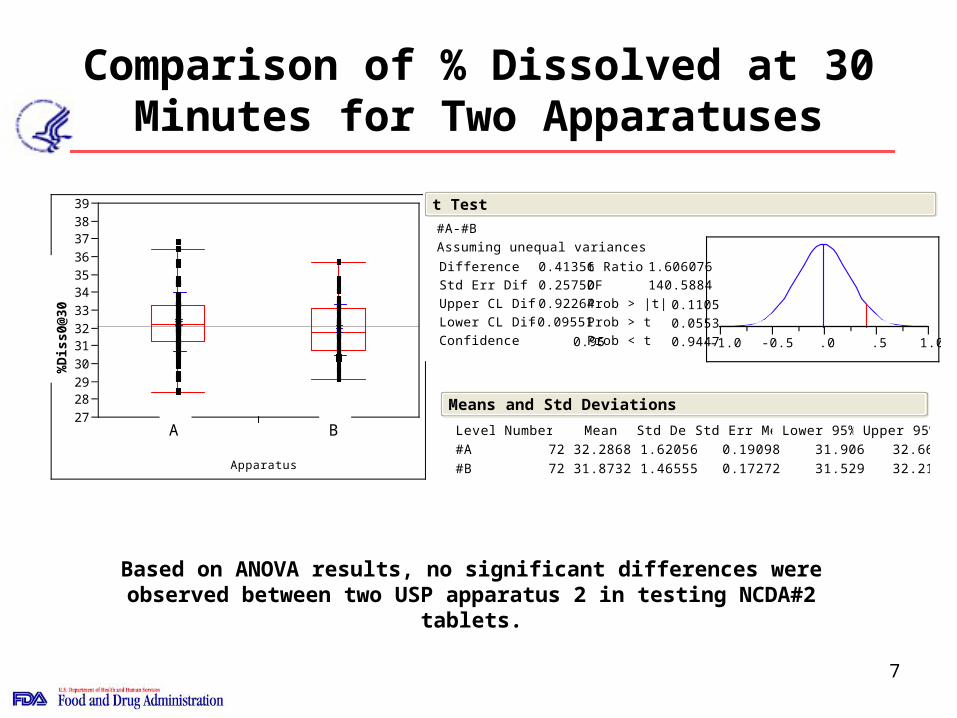
Comparison of % Dissolved at 30 Minutes for Two Apparatuses
Based on ANOVA results, no significant differences were observed between two USP apparatus 2 in testing NCDA#2 tablets.
#A-B
%D
iss@
30
27
2829
30
3132
33
3435
36
3738
39
#A #B
Apparatus
#A-#B
Assuming unequal variances
Difference
Std Err Dif
Upper CL Dif
Lower CL Dif
Confidence
0.41356
0.25750
0.92264
-0.09551
0.95
t Ratio
DF
Prob > |t|
Prob > t
Prob < t
1.606076
140.5884
0.1105
0.0553
0.9447 -1.0 -0.5 .0 .5 1.0
t Test
#A
#B
Level
72
72
Number
32.2868
31.8732
Mean
1.62056
1.46555
Std Dev
0.19098
0.17272
Std Err Mean
31.906
31.529
Lower 95%
32.668
32.218
Upper 95%
Means and Std Deviations
%D
iss0
@30
A B
8
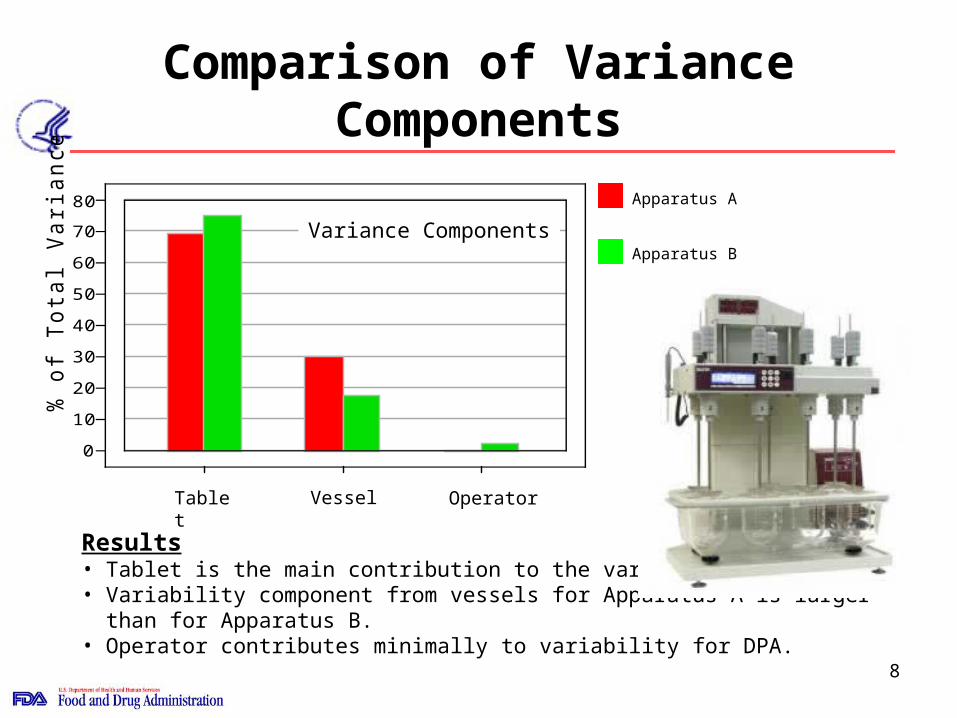
Comparison of Variance Components
0
10
20
30
40
50
60
70
80
% o
f To
tal V
ari
an
ce
OperatorTablet Vessel
Variance Components
Results• Tablet is the main contribution to the variance.• Variability component from vessels for Apparatus A is larger than for Apparatus B.• Operator contributes minimally to variability for DPA.
Apparatus A
Apparatus B
9
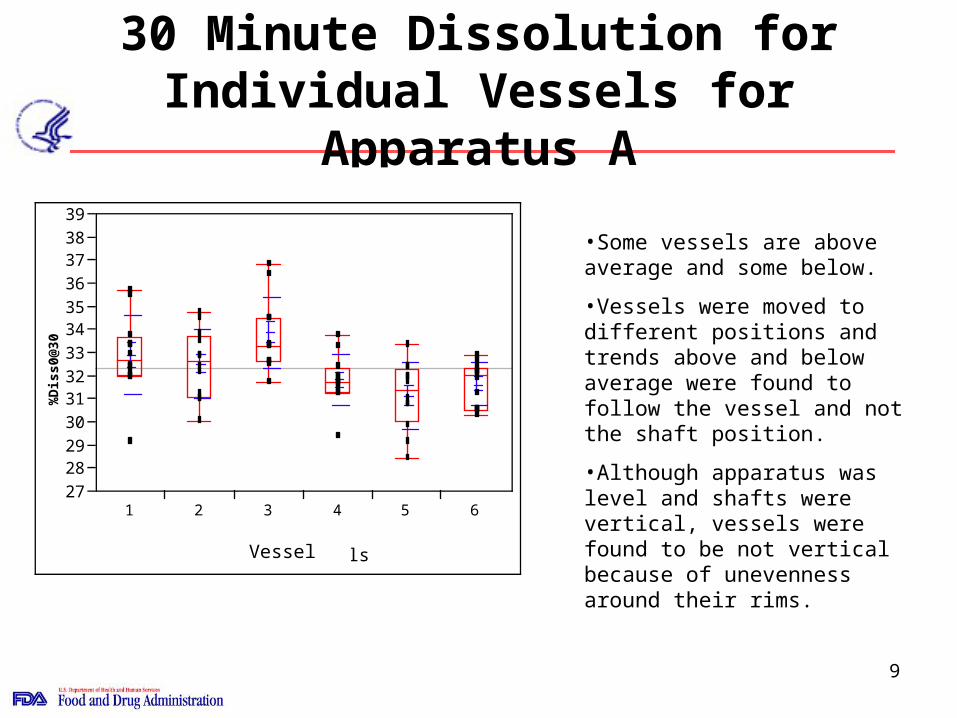
30 Minute Dissolution for Individual Vessels for Apparatus A
#A-%
Dis
s@30
27
2829
30
3132
33
3435
36
3738
39
1 2 3 4 5 6
#A-vessels
%D
iss0
@30
Vessel
•Some vessels are above average and some below.
•Vessels were moved to different positions and trends above and below average were found to follow the vessel and not the shaft position.
•Although apparatus was level and shafts were vertical, vessels were found to be not vertical because of unevenness around their rims.
10
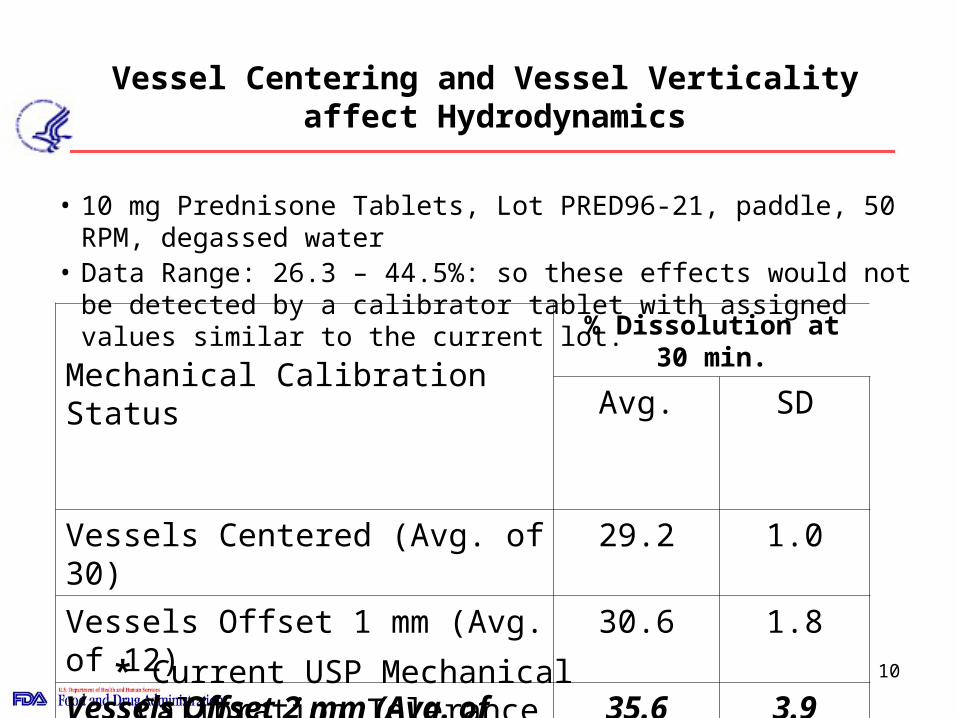
Vessel Centering and Vessel Verticality affect Hydrodynamics
Mechanical Calibration Status
% Dissolution at 30 min.
Avg. SD
Vessels Centered (Avg. of 30) 29.2 1.0
Vessels Offset 1 mm (Avg. of 12) 30.6 1.8
Vessels Offset 2 mm (Avg. of 12)* 35.6 3.9
Vessels Tilted 1.2º (Avg. of 12) 31.4 1.2
Vessels Tilted 2.3º (Avg. of 12) 36.3 2.6* Current USP Mechanical Calibration Tolerance
• 10 mg Prednisone Tablets, Lot PRED96-21, paddle, 50 RPM, degassed water• Data Range: 26.3 – 44.5%: so these effects would not be detected by a
calibrator tablet with assigned values similar to the current lot.
11
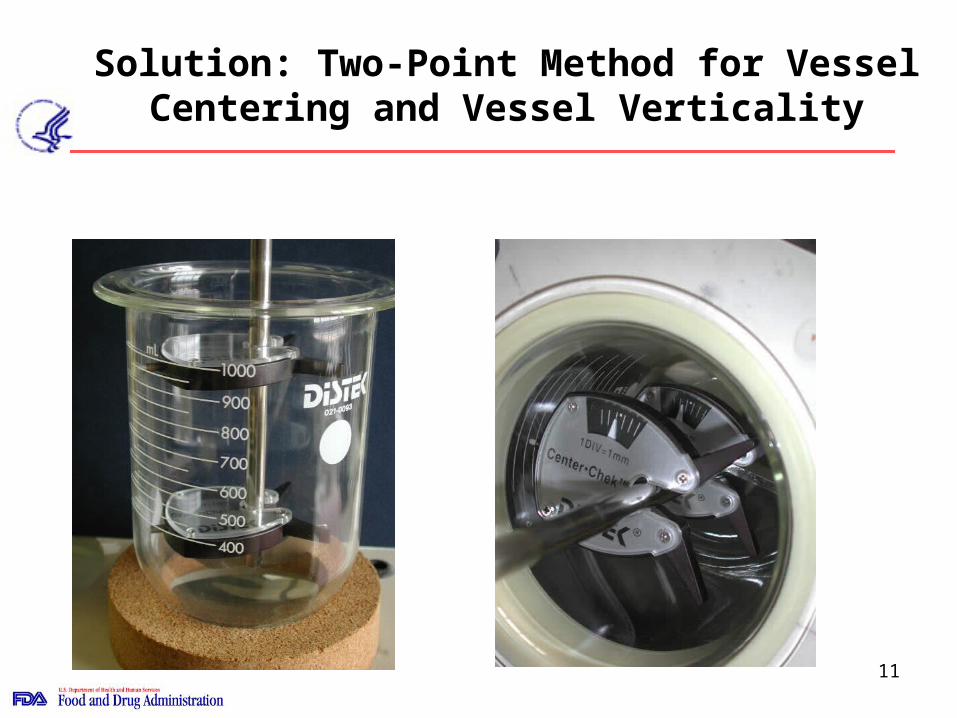
Solution: Two-Point Method for Vessel Centering and Vessel Verticality
12
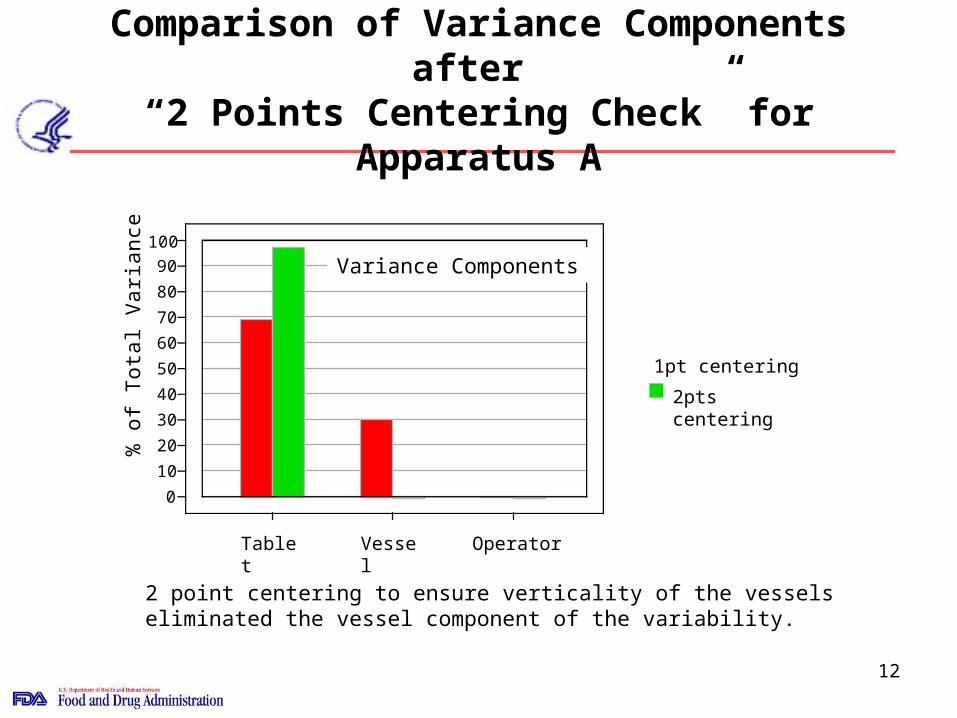
Comparison of Variance Components after “2 Points Centering Check” for Apparatus A
Y
Apparatus #A
Apparatus #B
1pt centering
2pts centering
0
10
20
30
40
50
60
70
80
90
100
% o
f To
tal V
ari
an
ce
Variance Components
OperatorVesselTablet
2 point centering to ensure verticality of the vessels eliminated the vessel component of the variability.
13
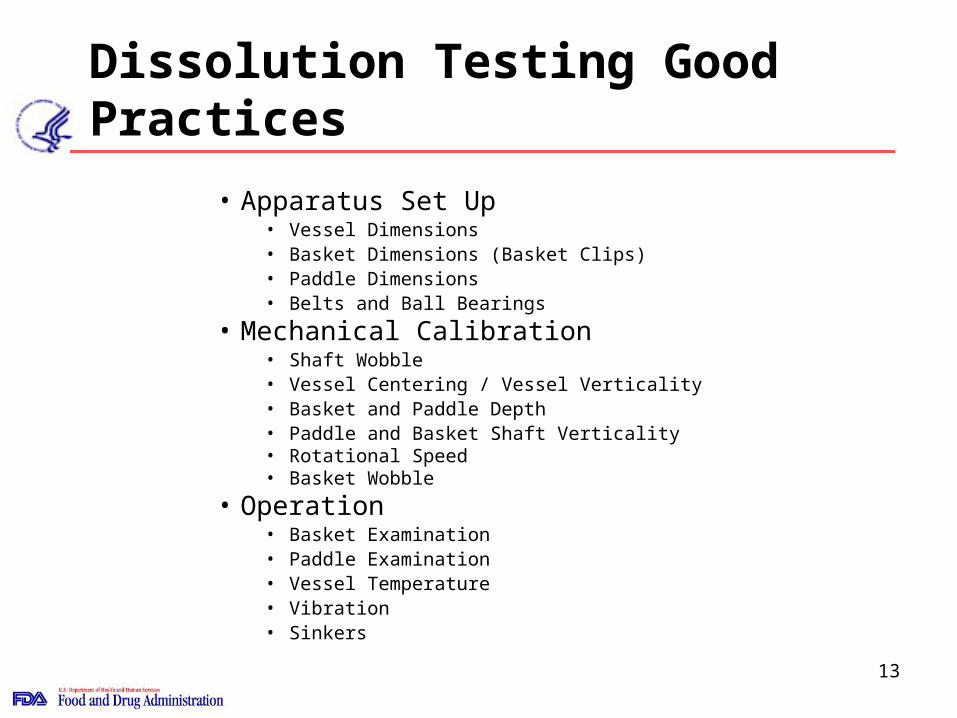
Dissolution Testing Good Practices
• Apparatus Set Up• Vessel Dimensions• Basket Dimensions (Basket Clips)• Paddle Dimensions• Belts and Ball Bearings
• Mechanical Calibration• Shaft Wobble • Vessel Centering / Vessel Verticality• Basket and Paddle Depth• Paddle and Basket Shaft Verticality• Rotational Speed• Basket Wobble
• Operation• Basket Examination• Paddle Examination• Vessel Temperature• Vibration• Sinkers

14
Apparatus Set Up
Vessel Dimensions
Per USP illustrations and dimensionsBasket Dimensions
(including use of Basket Clips)
Paddle Dimensions
Belts and Ball Bearings None Belts are tight, clean, free of cracks,
properly aligned, shafts turn freely
USP FDA
15
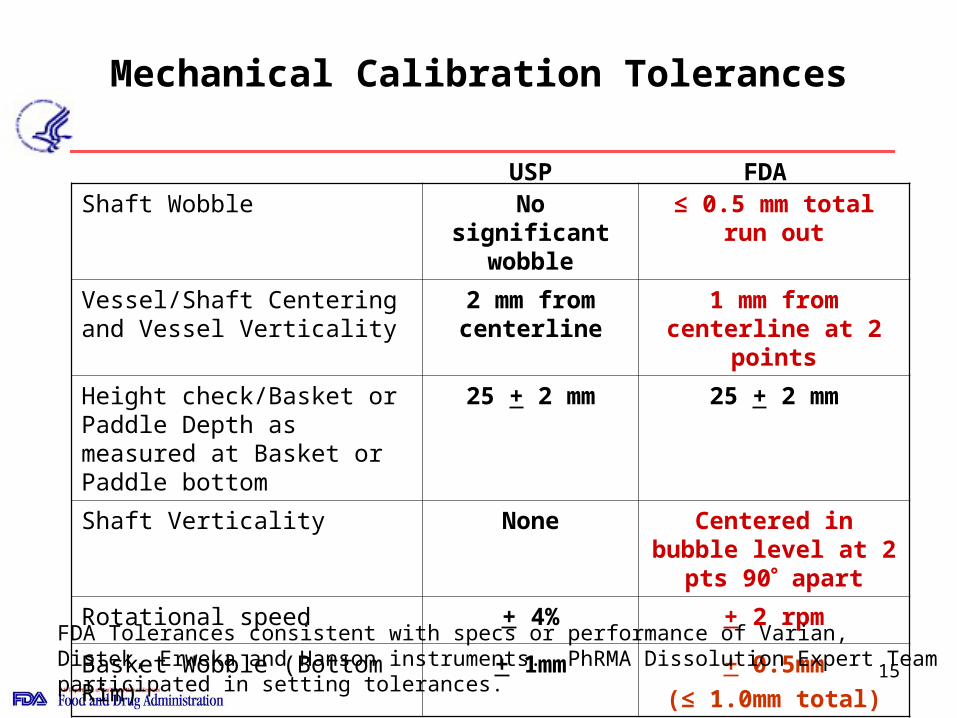
Mechanical Calibration Tolerances
Shaft Wobble No significant wobble
≤ 0.5 mm total run out
Vessel/Shaft Centering and Vessel Verticality
2 mm from centerline
1 mm from centerline at 2 points
Height check/Basket or Paddle Depth as measured at Basket or Paddle bottom
25 + 2 mm 25 + 2 mm
Shaft Verticality None Centered in bubble level at 2 pts 90 apart
Rotational speed + 4% + 2 rpm
Basket Wobble (Bottom Rim) + 1mm + 0.5mm
(≤ 1.0mm total)
USP FDA
FDA Tolerances consistent with specs or performance of Varian, Distek, Erweka and Hanson instruments. PhRMA Dissolution Expert Team participated in setting tolerances.
16
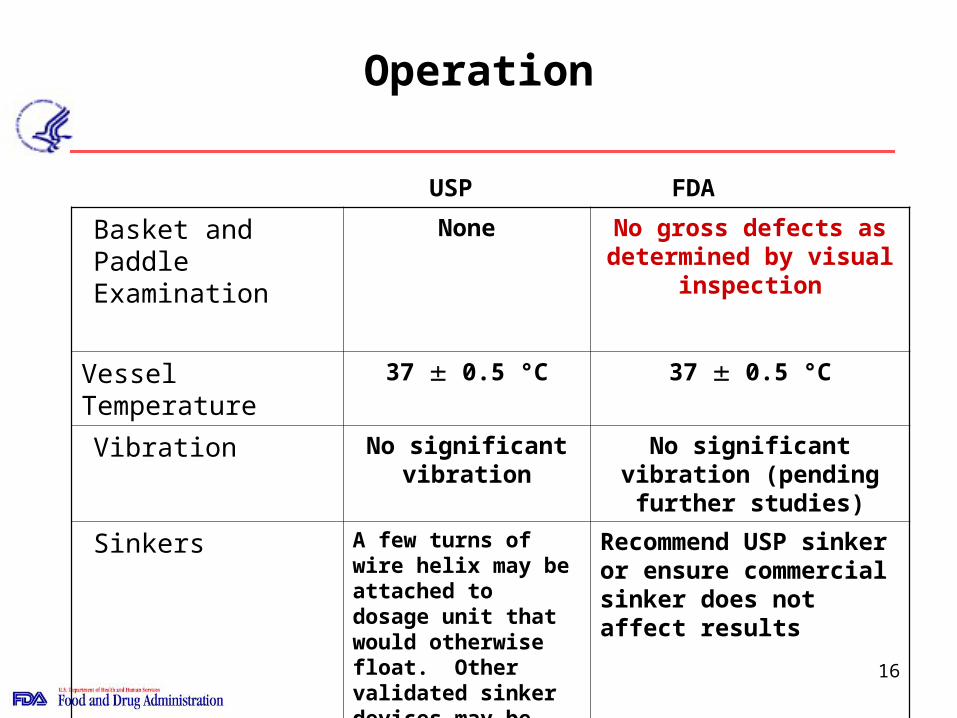
Operation
Basket and Paddle Examination
None No gross defects as determined by visual
inspection
Vessel Temperature 37 0.5 °C 37 0.5 °C
Vibration No significant vibration
No significant vibration (pending further studies)
Sinkers A few turns of wire helix may be attached to dosage unit that would otherwise float. Other validated sinker devices may be used.
Recommend USP sinker or ensure commercial sinker does not affect results
USP FDA

17
Vibration
1. 1999 Collaborative Study: Displacement
2. 1998 Japanese Study: Acceleration
Apparatus 1, 50 rpm, Enteric Coated product Average of 5 – 8 apparatus
Low Vibration Acceleration < 0.01 m/s2 32 1
High Vibration: Acceleration > 0.09 m/s2 39 4
3. 2005 Study by Bryan Crist and Dan Spisak, Varian Inc. : Frequency
Apparatus 2, 50 rpm 10 mg Prednisone USP Lot #O0C056 Average 6
Benchmark 34 4
Vibration Displacement < 0.20 mils Frequency at 20 Hz 34 2
Vibration Displacement < 0.02 mils Frequency at 130 Hz 42 9
18
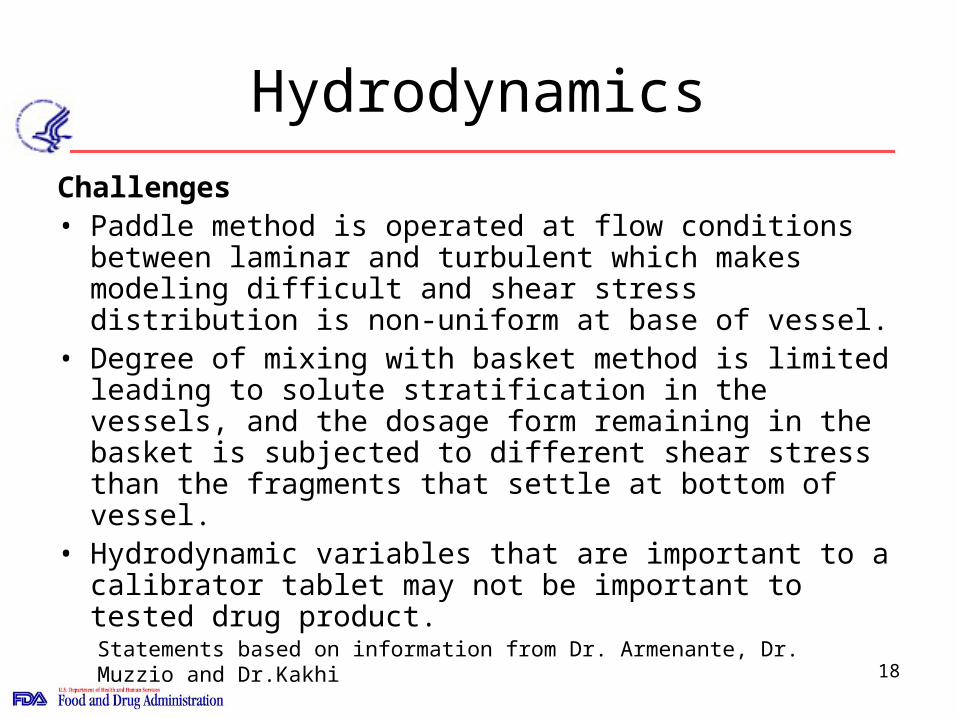
Hydrodynamics
Challenges• Paddle method is operated at flow conditions between
laminar and turbulent which makes modeling difficult and shear stress distribution is non-uniform at base of vessel.
• Degree of mixing with basket method is limited leading to solute stratification in the vessels, and the dosage form remaining in the basket is subjected to different shear stress than the fragments that settle at bottom of vessel.
• Hydrodynamic variables that are important to a calibrator tablet may not be important to tested drug product.
Statements based on information from Dr. Armenante, Dr. Muzzio and Dr.Kakhi

19
Benefits of Mechanical Calibration and Gauge R&R
• The sources of variability in the dissolution measurement system can be identified and minimized.
• If done during clinical or bio-batch lot, knowledge of variability can assure development of meaningful specifications.
• An internal calibrator can be developed from clinical or bio-batch which is more applicable to specific product than the USP calibrator tablets.
• This approach provides a higher assurance of quality than the current system where failure results can be caused by product failure OR measurement system variability.
20
Next Steps
• Additional Collaborative Research– Hydrodynamics– Vibration– New approaches to assess drug release (PAT,
spectroscopy, first principles and modeling)• Training of FDA Labs• Compliance Policy Guide• Future Guidance