Embed Size (px)
Citation preview

1
MERRILL LYNCH
GLOBAL ENERGY CONFERENCE
NOVEMBER 5, 2003
Presenter:Gene IsenbergChairman & CEO

2
Balance Sheet Data as of September, 2003
A CONSERVATIVE AND FLEXIBLE FINANCIAL POSITION
Cash and Marketable SecuritiesAccounts ReceivableWorking CapitalProperty, Plant and Equipment, NetTotal Assets
Actual1,517349931
2,8205,487
2,2852,399 49% 24%
153
A3A-
S&P 500, OSX
Total DebtStockholder’s EquityTotal Debt to Total CapitalizationNet Debt to CapitalizationWeighted Avg. Shares Outstanding
Moody’s Rating (1)
Standard & Poors
($Millions)
(1) Some debt issues are unrated

3
AVAILABLE CAPACITY AT OCTOBER 31, 2003
Drilling Working Ready-to-Run Inventory Total North America
Alaska 8 10 2 20 US 48 Drilling 168 121 94 383 GOM Offshore 14 27 0 41 Canada 37 45 0 82 International
Int’l Land (1) 56 38 2.5 96.5 Int’l Offshore (1) 22 0 0 20.5Total Drilling 305 241 98.5 643W.O./Well Servicing
US Lower 48 432 63 247 742 Canada 139 18 52 209Total W.O./Well Servicing 571 81 299 951
(1) Represents Nabors’ Net Interest in J.V. Rigs in Saudi @ 50%, operating rig count includes those leased from GOM Offshore

4
NATURAL GAS OUTLOOKSupply challenges point to a more orderly and sustainable cycle
» North American Gas Decline Rates Imply 20+ BCFPD Production Decline Per Year
» Timing of the Supply Impact of Gas From:• Deepwater• McKenzie Delta• Alaska• LNG
» US & Canadian Basins are the only alternatives for incremental supply of natural gas over the next five to eight years. Longer term, LNG will ultimately become the marginal supply

5
GLOBAL OILSupply Demand Balance Appears Favorable But Less Visible Than Gas
Supply:
»Aging and Declining Fields
•North Sea, North Slope, US, Latin America, Middle East
»Prospective New Supplies
• Deep Water – US GOM, West Africa
•Middle East – Exploration and Development
•Russia – Rehabilitation and New Developments•Former Soviet Union States
Demand:
»Global GDP – China, India and Emerging Economics
»North American Gas Alternatives
6
INCREMENTAL GASDRILLING CHALLENGES
»Existing Reserves
– Higher Recovery Efficiency
– Increased Technology
»Incremental Reserves– Deeper Horizons– More Complex – Higher Risks– More Remote– Less Accessible
7
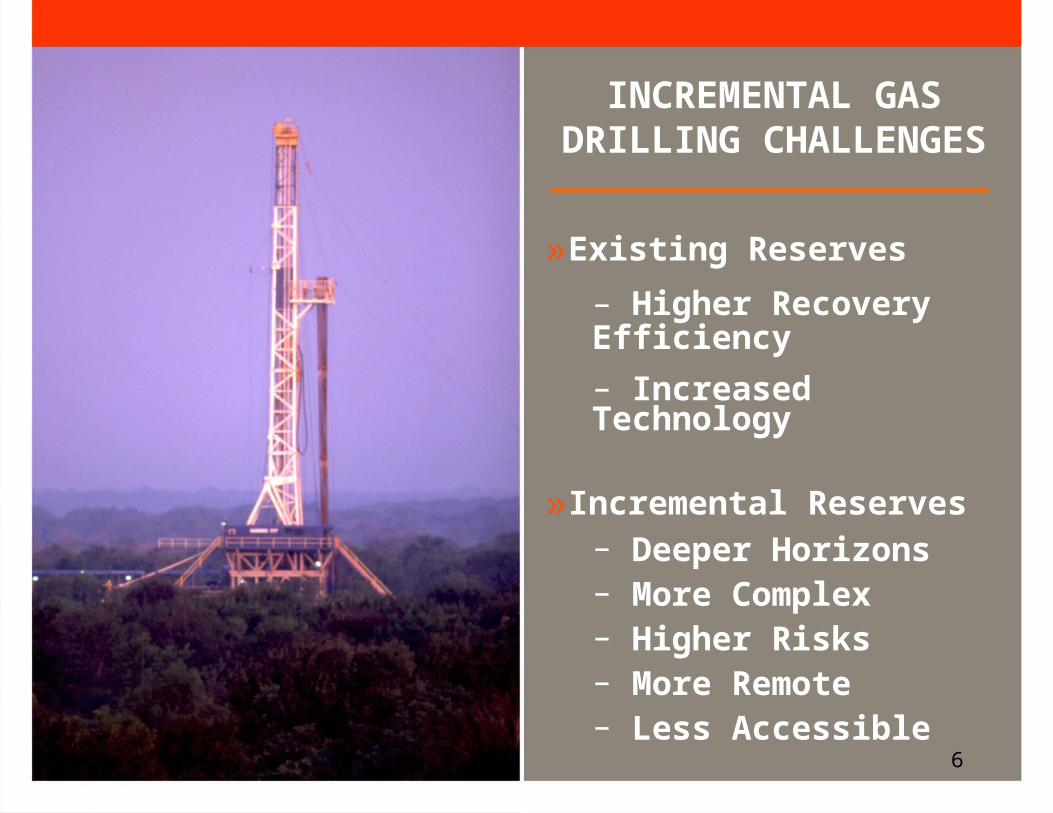
U.S. GAS RIG ACTIVITY
Source: Baker Hughes, Bloomberg
376
463
564 563
484
717
691
939
TODAY – 944
YTD 03 – 855
8
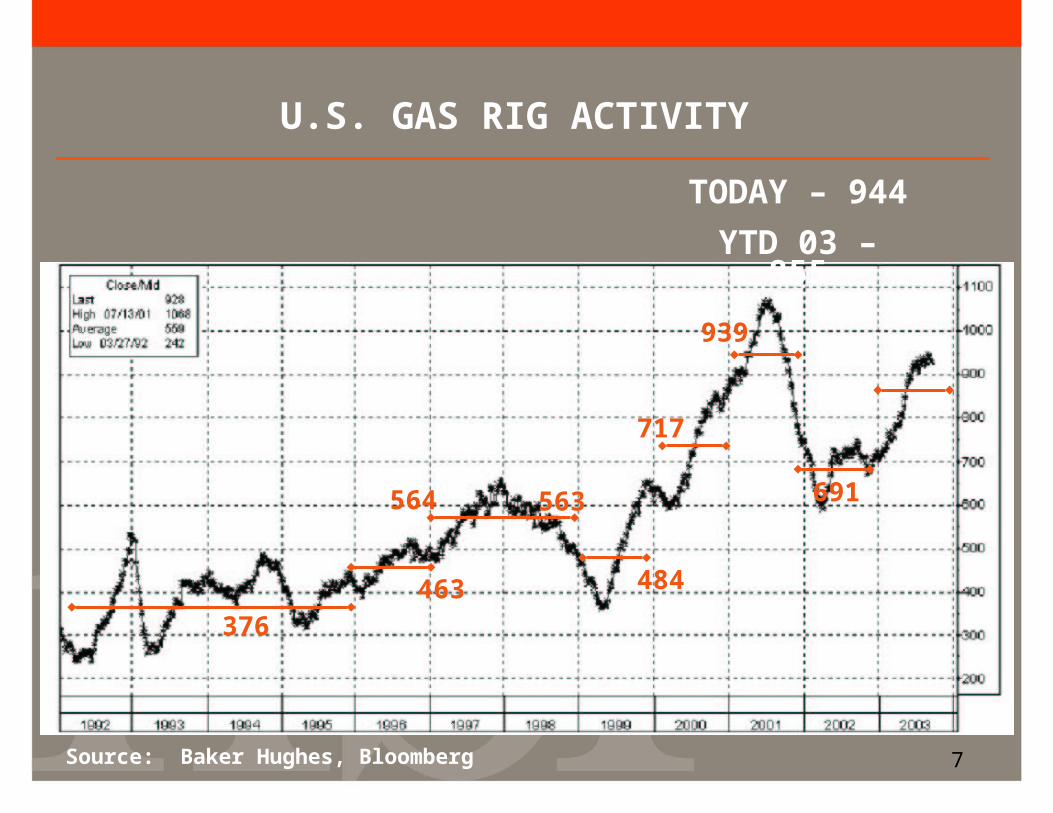
U.S. NATURAL GAS PRODUCTIONYEAR-OVER-YEAR % CHANGE
EOG_BS0503-3
-10%
-8%
-6%
-4%
-2%
0%
2%
4%
2000
-4.8ACT
Quarterly YOY % Change
53.0 53.0 52.2 51.9 50.5 50.3 49.7 48.7 49.4 49.0 48.8 48.5
-5.2ACT
-2E -3E -2E -1E
2001 2002 2003E
52.0 51.6 52.0 52.1
Quarterly Bcfd:
Annual Change +1.2% -5.3% -1 to -3%
-4.9ACT
Assumes BHI Gas Rig Count 1,000 Year End 2003
Storm Related
-6.2ACT
717 Gas Rigs717 Gas Rigs 939 Gas Rigs939 Gas Rigs 691 Gas Rigs691 Gas Rigs
Est. 1,000 at year endToday = 944
Y-T-D Avg. = 855

9
LAND RIG SUPPLYCYCLE-TO-CYLCE
» August 2000 Effective 100% Utilization at 850 US Land Rigs
» Today Effective 100% Utilization at 1100+ US Land Rigs
» Increased Operating Costs
» Increased Capital Costs
» None the less, we expect significantly lower dayrates than the 2001 peak
10
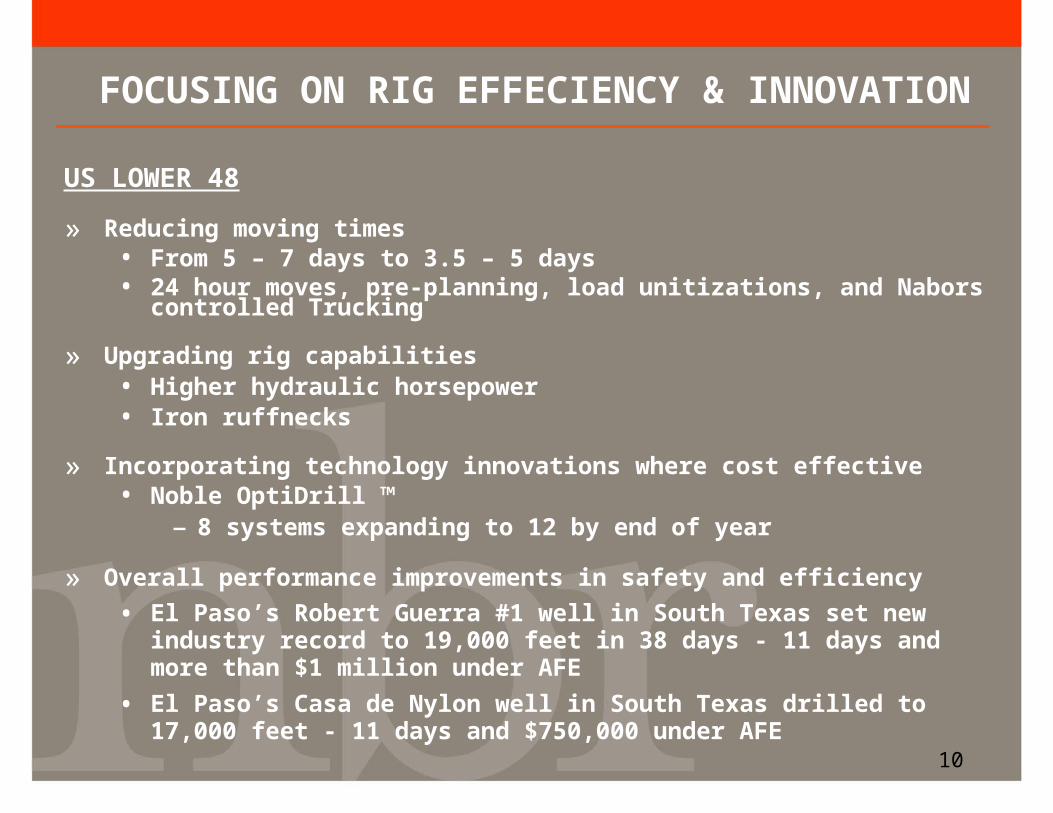
FOCUSING ON RIG EFFECIENCY & INNOVATION
US LOWER 48
» Reducing moving times • From 5 – 7 days to 3.5 – 5 days• 24 hour moves, pre-planning, load unitizations, and Nabors controlled Trucking
» Upgrading rig capabilities• Higher hydraulic horsepower• Iron ruffnecks
» Incorporating technology innovations where cost effective• Noble OptiDrill ™
– 8 systems expanding to 12 by end of year
» Overall performance improvements in safety and efficiency
• El Paso’s Robert Guerra #1 well in South Texas set new industry record to 19,000 feet in 38 days - 11 days and more than $1 million under AFE
• El Paso’s Casa de Nylon well in South Texas drilled to 17,000 feet - 11 days and $750,000 under AFE
11
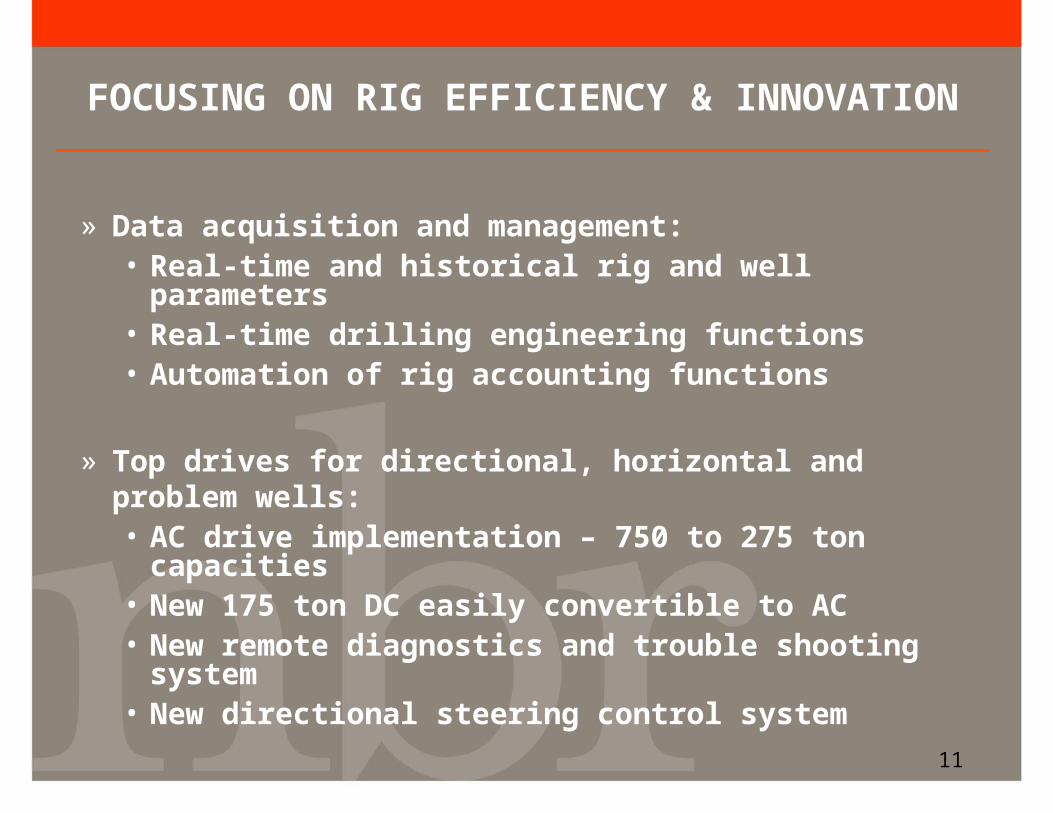
FOCUSING ON RIG EFFICIENCY & INNOVATION
» Data acquisition and management:• Real-time and historical rig and well parameters• Real-time drilling engineering functions• Automation of rig accounting functions
» Top drives for directional, horizontal and problem wells:• AC drive implementation – 750 to 275 ton capacities• New 175 ton DC easily convertible to AC• New remote diagnostics and trouble shooting system• New directional steering control system

12
NEW AND REMODELED RIGS
CANADA: Seven rigs from September 2002 – March 2004
• AC – PLC technologies in house
• 800 – 3,000 HP highly mobile rigs
• In house design and construction expertise
U.S. LOWER 48: •Two modularized pad rigs for Shell Pinedale Anticline
•Upgraded and refurbished rig for Shell South Texas
OFFSHORE: •Three Gulf of Mexico platform rigs for deepwater development projects
•Eight international platform rigs since mid 2003
13
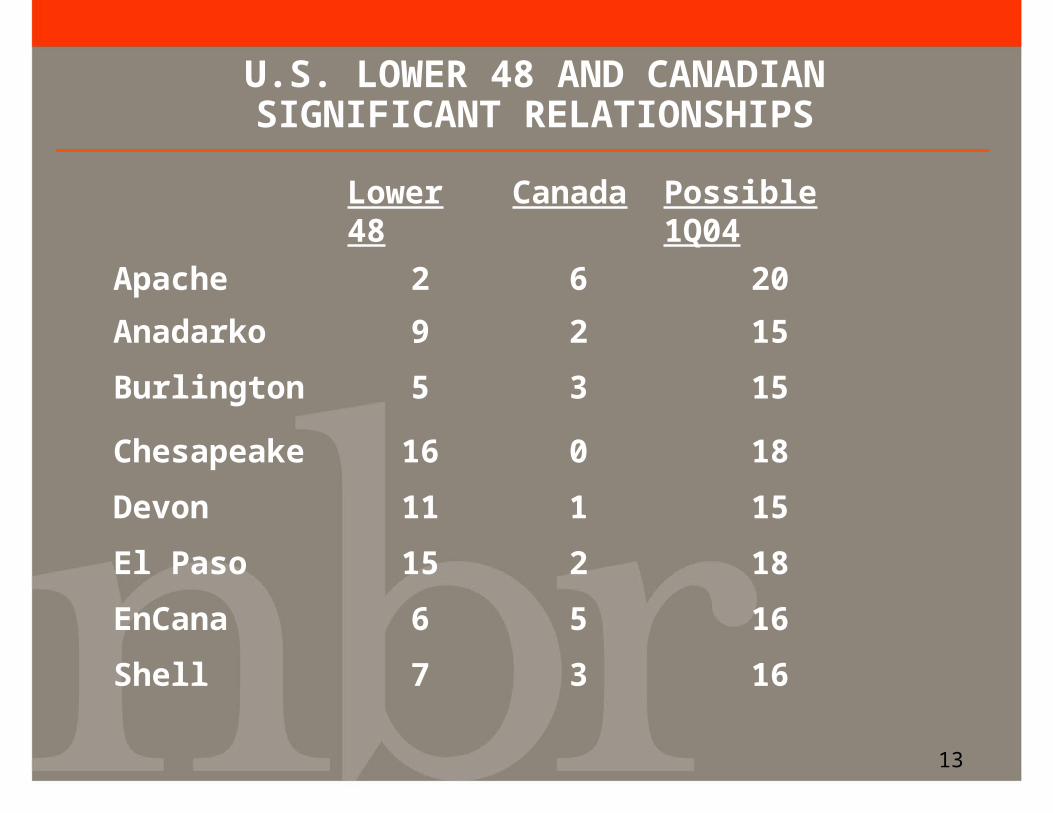
U.S. LOWER 48 AND CANADIANSIGNIFICANT RELATIONSHIPS
Lower 48 Canada Possible 1Q04
Apache 2 6 20
Anadarko 9 2 15
Burlington 5 3 15
Chesapeake 16 0 18
Devon 11 1 15
El Paso 15 2 18
EnCana 6 5 16
Shell 7 3 16

14
GROWING CANADIAN CONTRIBUTION
Actual2001
Proforma2001
Actual2002
Implied ByConsensus 2003
Average No. Rigs Working
Drilling (rig years) 20 - 23 40
Workover (000’s hrs/year) 0 - 166 310
Segment Results ($Millions)
Revenues $86 $450 $142 $250
EBITDA $38 $158 $38 $80
% NBR Segment Total 5% - 9% 18%

15
GROWING INTERNATIONAL CONTRIBUTION
Actual 2001
Actual2002
Implied ByConsensus 2003
Average No. Rigs Working
Land 53 45 47
Offshore 1 7 15
Segment Results ($Millions)
Revenues $282 $320 $400
EBITDA $90 $114 $135
% NBR Segment Total 12% 28% 30%