Embed Size (px)
Citation preview

1
Muscles are remarkably adaptive Any doubts
2
Musculoskeletal Issues
Disease genetics Muscular dystrophy Cancer AIDS cachexia Obesity diabetes
Casting
Bedrest
Spinal cord or nerve injury
Surgery rehab disuse
Aging
Microgravity
3
4
5
6
7
Sarcomere (Basic Contractile Apparatus)
8
9
Cellular Energy Production
10
11
TYPE of FIBER
CharacteristicSlow Oxidative
(I)Fast Oxidative
(IIa)Fast Glycolytic
(IIb)
Myosin ATPase activity LOW HIGH HIGH
Speed of Contraction SLOW FAST FAST
Fatigue Resistance HIGH Intermediate LOW
Oxidative Capacity HIGH HIGH LOW
Anaerobic Enzyme Content LOW Intermediate HIGH
Mitochondria MANY MANY FEW
Capillaries MANY MANY FEW
Myoglobin Content HIGH HIGH LOW
Color of Fiber RED RED WHITE
Glycogen Content LOW Intermediate HIGH
Myoglobin Content HIGH HIGH LOW
Fiber Diameter SMALL Intermediate LARGE
12
13
Tetanic Contraction
14
15
PCSA (cm2) = Muscle Mass (g) cosine Θ
ρ (gcm3) Fiber Length (cm)
Θ is the pennation angle of the muscle fibers
16
Effects of Muscle Length and Contraction Velocity
17
18
Muscles Respond to Loads
Transduction of mechanical load
Forces transmitted through extracellular matrix
Generate chemical signals Activate voltage gated
channels Activate IGF secretion
(autocrine signaling)
Transduction of neural activation
Ca2+ increase ndash activate Ca2+ - calmodulin calcineurin pathway
Alter gene expression in favor of protein synthesis
19
Protein Synthesis
20
Protein Degradation
21
Muscle Development and Maintenance
Proliferate after heavy use or muscle injury
22
23
Tidball J Appl Phsyiol 2005
24
Haszele and Price Endocrinology 2004
25
Myostatin is a member of the TGF-b superfamily that regulates development and tissue homeostasis
Myostatin is expressed almost exclusively in skeletal muscle and acts as a negative regulator of muscle growth
Rodent models of experimental disease states show upregulated myostatin mRNA
Studies in humans show that a lack of functional myostatin results in increased muscle mass due to hyperplasia andor hypertrophy
Interest in Myostatin
26
Se-Jin Lee Annual Review Cell Dev Bio 2004
TGFβ Superfamily
27
Activation of Myostatin Pathway
Activation of Myostatin Pathway
Myostatin Pathway Blockade
Skeletal Muscle Growth Leanness
Muscle Wasting Cachexia Syndrome
Myostatin Effects
28
Naturally deficient Naturally deficient myostatin genemyostatin gene
Myostatinrsquos Obvious Effects
Genetically created deficient myostatin gene
(Knockout)
29
Myostatin and Humans
But not just cattle and But not just cattle and mice helliphellipmice helliphellip
30
Se-Jin Lee Annual Review Cell Dev Bio 2004
Inhibition of the Myostatin Inhibitor
31
Myostatin Signaling
32
Myostatin vs Other Established Muscle Metabolism Pathways
Mature Myocyte Myoblast
IGF1
PI3KAkt
FOXO
Ubiquitin-ProteasomePathway
(Atrogin-1 MuRF-1)
PROTEIN (eg MHC)DEGRADATION
mTOR
GSK3
eIF2B 4EBP1S6K
PROTEINSYNTHESIS
MyoDMEF2
CdK2 CdK inhibitors(p21)
PhosphoSMAD23
DifferentiationMyogenesis
+
-
PhosphoActRIIb
MYOSTATIN
33
Skeletal muscle wasting is prevalent in a variety of diseases
Weightlessness during space flight
Cancer cachexia
Muscular dystrophy
Geriatric sarcopenia
Obesitydiabetes
Skeletal muscle wasting results in reduced muscle strength disability and impaired quality of life
No current therapy to prevent or reverse muscle atrophy
Potential for Blocking Myostatin
34
Suspended at 30ordm for 14 days
Access to 100 of cage
Food and water ad libitum
12-h photoperiod
Disuse Models
Human bedrest (6ordm Head Down Tilt)
Durations - days to months Cardiovascular muscle and bone
effects Controlled diet
35
791090
2
4
6
8
10
12
14
16
US P TS P
So
leu
s W
et M
ass
(mg
)
Muscle Mass
Whole Animal Leg Strength
Hindlimb Suspension Effects
Isolated Muscle Strength
36
2200
2250
2300
2350
2400
2450
2500
2550
2600
2650
2700
0 2 4 6 8 10 12 14
Day of Study
Bo
dy
Mas
s (g
ram
s)
US D
US P
TS D
TS P
Body Mass
37
15
16
17
18
19
20
21
22
US P US D TS P TS D
Lea
n B
od
y M
ass
(g
)
0
asymp
Lean Body Mass
US gt TSPlt0001
D gt PPlt0001
38
Study Design
Subjects ndash 10 male volunteers 18-45 years old 10 day strict horizontal bed rest with restricted 5 day
lead in and 4 day follow up periods Controlled diet ndash 55 carb 30 fat 15 protein Caloric intake set to maintain body weight
39
RawImage
Partially ProcessedImage
Double Threshold Analysis
40
Quadriceps Size Change
50
60
70
80
90
Pre-Bed Rest End-Bed Rest
Mea
n C
SA
S
lice
(cm
2 )
-50
-10
-8
-6
-4
-2
0
Δ C
hang
e M
ean
CS
A (
)
p lt 0001
MRI images obtained with Tr = 550ms Te = 10ms Slice thickness = 1cm with 0 overlap Pre-BR and end-BR slices aligned on anatomical features Analysis from distal end of rectus femoris to highest portion of thigh excluding the
gluteus maximus
41
GDF8 vs Δ Muscle Size
Correlation found between absolute level of GDF8 expression pre-bed rest with change in muscle size
Correlations between Δ muscle size and Δ myostatin expression were not observed
-10
-8
-6
-4
-2
000 10 20 30 40
Pre-BR GDF8GAPDH
Δ Q
uads
Mea
n C
SA
(
)
r = - 066p lt 005
42
Summary of Muscle Feedback
Muscle Strength (PCSA)
IGF-1
ProteinDegradation
ExternalLoads Demands
Insulin
Protein Synthesis
Circulating IGF-1
Satellite CellActivation
+
Myostatin
MuscleHypertrophy
MuscleHyperplasia
+
Transduction Mechanical Electrical
--
-
-

2
Musculoskeletal Issues
Disease genetics Muscular dystrophy Cancer AIDS cachexia Obesity diabetes
Casting
Bedrest
Spinal cord or nerve injury
Surgery rehab disuse
Aging
Microgravity
3
4
5
6
7
Sarcomere (Basic Contractile Apparatus)
8
9
Cellular Energy Production
10
11
TYPE of FIBER
CharacteristicSlow Oxidative
(I)Fast Oxidative
(IIa)Fast Glycolytic
(IIb)
Myosin ATPase activity LOW HIGH HIGH
Speed of Contraction SLOW FAST FAST
Fatigue Resistance HIGH Intermediate LOW
Oxidative Capacity HIGH HIGH LOW
Anaerobic Enzyme Content LOW Intermediate HIGH
Mitochondria MANY MANY FEW
Capillaries MANY MANY FEW
Myoglobin Content HIGH HIGH LOW
Color of Fiber RED RED WHITE
Glycogen Content LOW Intermediate HIGH
Myoglobin Content HIGH HIGH LOW
Fiber Diameter SMALL Intermediate LARGE
12
13
Tetanic Contraction
14
15
PCSA (cm2) = Muscle Mass (g) cosine Θ
ρ (gcm3) Fiber Length (cm)
Θ is the pennation angle of the muscle fibers
16
Effects of Muscle Length and Contraction Velocity
17
18
Muscles Respond to Loads
Transduction of mechanical load
Forces transmitted through extracellular matrix
Generate chemical signals Activate voltage gated
channels Activate IGF secretion
(autocrine signaling)
Transduction of neural activation
Ca2+ increase ndash activate Ca2+ - calmodulin calcineurin pathway
Alter gene expression in favor of protein synthesis
19
Protein Synthesis
20
Protein Degradation
21
Muscle Development and Maintenance
Proliferate after heavy use or muscle injury
22
23
Tidball J Appl Phsyiol 2005
24
Haszele and Price Endocrinology 2004
25
Myostatin is a member of the TGF-b superfamily that regulates development and tissue homeostasis
Myostatin is expressed almost exclusively in skeletal muscle and acts as a negative regulator of muscle growth
Rodent models of experimental disease states show upregulated myostatin mRNA
Studies in humans show that a lack of functional myostatin results in increased muscle mass due to hyperplasia andor hypertrophy
Interest in Myostatin
26
Se-Jin Lee Annual Review Cell Dev Bio 2004
TGFβ Superfamily
27
Activation of Myostatin Pathway
Activation of Myostatin Pathway
Myostatin Pathway Blockade
Skeletal Muscle Growth Leanness
Muscle Wasting Cachexia Syndrome
Myostatin Effects
28
Naturally deficient Naturally deficient myostatin genemyostatin gene
Myostatinrsquos Obvious Effects
Genetically created deficient myostatin gene
(Knockout)
29
Myostatin and Humans
But not just cattle and But not just cattle and mice helliphellipmice helliphellip
30
Se-Jin Lee Annual Review Cell Dev Bio 2004
Inhibition of the Myostatin Inhibitor
31
Myostatin Signaling
32
Myostatin vs Other Established Muscle Metabolism Pathways
Mature Myocyte Myoblast
IGF1
PI3KAkt
FOXO
Ubiquitin-ProteasomePathway
(Atrogin-1 MuRF-1)
PROTEIN (eg MHC)DEGRADATION
mTOR
GSK3
eIF2B 4EBP1S6K
PROTEINSYNTHESIS
MyoDMEF2
CdK2 CdK inhibitors(p21)
PhosphoSMAD23
DifferentiationMyogenesis
+
-
PhosphoActRIIb
MYOSTATIN
33
Skeletal muscle wasting is prevalent in a variety of diseases
Weightlessness during space flight
Cancer cachexia
Muscular dystrophy
Geriatric sarcopenia
Obesitydiabetes
Skeletal muscle wasting results in reduced muscle strength disability and impaired quality of life
No current therapy to prevent or reverse muscle atrophy
Potential for Blocking Myostatin
34
Suspended at 30ordm for 14 days
Access to 100 of cage
Food and water ad libitum
12-h photoperiod
Disuse Models
Human bedrest (6ordm Head Down Tilt)
Durations - days to months Cardiovascular muscle and bone
effects Controlled diet
35
791090
2
4
6
8
10
12
14
16
US P TS P
So
leu
s W
et M
ass
(mg
)
Muscle Mass
Whole Animal Leg Strength
Hindlimb Suspension Effects
Isolated Muscle Strength
36
2200
2250
2300
2350
2400
2450
2500
2550
2600
2650
2700
0 2 4 6 8 10 12 14
Day of Study
Bo
dy
Mas
s (g
ram
s)
US D
US P
TS D
TS P
Body Mass
37
15
16
17
18
19
20
21
22
US P US D TS P TS D
Lea
n B
od
y M
ass
(g
)
0
asymp
Lean Body Mass
US gt TSPlt0001
D gt PPlt0001
38
Study Design
Subjects ndash 10 male volunteers 18-45 years old 10 day strict horizontal bed rest with restricted 5 day
lead in and 4 day follow up periods Controlled diet ndash 55 carb 30 fat 15 protein Caloric intake set to maintain body weight
39
RawImage
Partially ProcessedImage
Double Threshold Analysis
40
Quadriceps Size Change
50
60
70
80
90
Pre-Bed Rest End-Bed Rest
Mea
n C
SA
S
lice
(cm
2 )
-50
-10
-8
-6
-4
-2
0
Δ C
hang
e M
ean
CS
A (
)
p lt 0001
MRI images obtained with Tr = 550ms Te = 10ms Slice thickness = 1cm with 0 overlap Pre-BR and end-BR slices aligned on anatomical features Analysis from distal end of rectus femoris to highest portion of thigh excluding the
gluteus maximus
41
GDF8 vs Δ Muscle Size
Correlation found between absolute level of GDF8 expression pre-bed rest with change in muscle size
Correlations between Δ muscle size and Δ myostatin expression were not observed
-10
-8
-6
-4
-2
000 10 20 30 40
Pre-BR GDF8GAPDH
Δ Q
uads
Mea
n C
SA
(
)
r = - 066p lt 005
42
Summary of Muscle Feedback
Muscle Strength (PCSA)
IGF-1
ProteinDegradation
ExternalLoads Demands
Insulin
Protein Synthesis
Circulating IGF-1
Satellite CellActivation
+
Myostatin
MuscleHypertrophy
MuscleHyperplasia
+
Transduction Mechanical Electrical
--
-
-

4
5
6
7
Sarcomere (Basic Contractile Apparatus)
8
9
Cellular Energy Production
10
11
TYPE of FIBER
CharacteristicSlow Oxidative
(I)Fast Oxidative
(IIa)Fast Glycolytic
(IIb)
Myosin ATPase activity LOW HIGH HIGH
Speed of Contraction SLOW FAST FAST
Fatigue Resistance HIGH Intermediate LOW
Oxidative Capacity HIGH HIGH LOW
Anaerobic Enzyme Content LOW Intermediate HIGH
Mitochondria MANY MANY FEW
Capillaries MANY MANY FEW
Myoglobin Content HIGH HIGH LOW
Color of Fiber RED RED WHITE
Glycogen Content LOW Intermediate HIGH
Myoglobin Content HIGH HIGH LOW
Fiber Diameter SMALL Intermediate LARGE
12
13
Tetanic Contraction
14
15
PCSA (cm2) = Muscle Mass (g) cosine Θ
ρ (gcm3) Fiber Length (cm)
Θ is the pennation angle of the muscle fibers
16
Effects of Muscle Length and Contraction Velocity
17
18
Muscles Respond to Loads
Transduction of mechanical load
Forces transmitted through extracellular matrix
Generate chemical signals Activate voltage gated
channels Activate IGF secretion
(autocrine signaling)
Transduction of neural activation
Ca2+ increase ndash activate Ca2+ - calmodulin calcineurin pathway
Alter gene expression in favor of protein synthesis
19
Protein Synthesis
20
Protein Degradation
21
Muscle Development and Maintenance
Proliferate after heavy use or muscle injury
22
23
Tidball J Appl Phsyiol 2005
24
Haszele and Price Endocrinology 2004
25
Myostatin is a member of the TGF-b superfamily that regulates development and tissue homeostasis
Myostatin is expressed almost exclusively in skeletal muscle and acts as a negative regulator of muscle growth
Rodent models of experimental disease states show upregulated myostatin mRNA
Studies in humans show that a lack of functional myostatin results in increased muscle mass due to hyperplasia andor hypertrophy
Interest in Myostatin
26
Se-Jin Lee Annual Review Cell Dev Bio 2004
TGFβ Superfamily
27
Activation of Myostatin Pathway
Activation of Myostatin Pathway
Myostatin Pathway Blockade
Skeletal Muscle Growth Leanness
Muscle Wasting Cachexia Syndrome
Myostatin Effects
28
Naturally deficient Naturally deficient myostatin genemyostatin gene
Myostatinrsquos Obvious Effects
Genetically created deficient myostatin gene
(Knockout)
29
Myostatin and Humans
But not just cattle and But not just cattle and mice helliphellipmice helliphellip
30
Se-Jin Lee Annual Review Cell Dev Bio 2004
Inhibition of the Myostatin Inhibitor
31
Myostatin Signaling
32
Myostatin vs Other Established Muscle Metabolism Pathways
Mature Myocyte Myoblast
IGF1
PI3KAkt
FOXO
Ubiquitin-ProteasomePathway
(Atrogin-1 MuRF-1)
PROTEIN (eg MHC)DEGRADATION
mTOR
GSK3
eIF2B 4EBP1S6K
PROTEINSYNTHESIS
MyoDMEF2
CdK2 CdK inhibitors(p21)
PhosphoSMAD23
DifferentiationMyogenesis
+
-
PhosphoActRIIb
MYOSTATIN
33
Skeletal muscle wasting is prevalent in a variety of diseases
Weightlessness during space flight
Cancer cachexia
Muscular dystrophy
Geriatric sarcopenia
Obesitydiabetes
Skeletal muscle wasting results in reduced muscle strength disability and impaired quality of life
No current therapy to prevent or reverse muscle atrophy
Potential for Blocking Myostatin
34
Suspended at 30ordm for 14 days
Access to 100 of cage
Food and water ad libitum
12-h photoperiod
Disuse Models
Human bedrest (6ordm Head Down Tilt)
Durations - days to months Cardiovascular muscle and bone
effects Controlled diet
35
791090
2
4
6
8
10
12
14
16
US P TS P
So
leu
s W
et M
ass
(mg
)
Muscle Mass
Whole Animal Leg Strength
Hindlimb Suspension Effects
Isolated Muscle Strength
36
2200
2250
2300
2350
2400
2450
2500
2550
2600
2650
2700
0 2 4 6 8 10 12 14
Day of Study
Bo
dy
Mas
s (g
ram
s)
US D
US P
TS D
TS P
Body Mass
37
15
16
17
18
19
20
21
22
US P US D TS P TS D
Lea
n B
od
y M
ass
(g
)
0
asymp
Lean Body Mass
US gt TSPlt0001
D gt PPlt0001
38
Study Design
Subjects ndash 10 male volunteers 18-45 years old 10 day strict horizontal bed rest with restricted 5 day
lead in and 4 day follow up periods Controlled diet ndash 55 carb 30 fat 15 protein Caloric intake set to maintain body weight
39
RawImage
Partially ProcessedImage
Double Threshold Analysis
40
Quadriceps Size Change
50
60
70
80
90
Pre-Bed Rest End-Bed Rest
Mea
n C
SA
S
lice
(cm
2 )
-50
-10
-8
-6
-4
-2
0
Δ C
hang
e M
ean
CS
A (
)
p lt 0001
MRI images obtained with Tr = 550ms Te = 10ms Slice thickness = 1cm with 0 overlap Pre-BR and end-BR slices aligned on anatomical features Analysis from distal end of rectus femoris to highest portion of thigh excluding the
gluteus maximus
41
GDF8 vs Δ Muscle Size
Correlation found between absolute level of GDF8 expression pre-bed rest with change in muscle size
Correlations between Δ muscle size and Δ myostatin expression were not observed
-10
-8
-6
-4
-2
000 10 20 30 40
Pre-BR GDF8GAPDH
Δ Q
uads
Mea
n C
SA
(
)
r = - 066p lt 005
42
Summary of Muscle Feedback
Muscle Strength (PCSA)
IGF-1
ProteinDegradation
ExternalLoads Demands
Insulin
Protein Synthesis
Circulating IGF-1
Satellite CellActivation
+
Myostatin
MuscleHypertrophy
MuscleHyperplasia
+
Transduction Mechanical Electrical
--
-
-

6
7
Sarcomere (Basic Contractile Apparatus)
8
9
Cellular Energy Production
10
11
TYPE of FIBER
CharacteristicSlow Oxidative
(I)Fast Oxidative
(IIa)Fast Glycolytic
(IIb)
Myosin ATPase activity LOW HIGH HIGH
Speed of Contraction SLOW FAST FAST
Fatigue Resistance HIGH Intermediate LOW
Oxidative Capacity HIGH HIGH LOW
Anaerobic Enzyme Content LOW Intermediate HIGH
Mitochondria MANY MANY FEW
Capillaries MANY MANY FEW
Myoglobin Content HIGH HIGH LOW
Color of Fiber RED RED WHITE
Glycogen Content LOW Intermediate HIGH
Myoglobin Content HIGH HIGH LOW
Fiber Diameter SMALL Intermediate LARGE
12
13
Tetanic Contraction
14
15
PCSA (cm2) = Muscle Mass (g) cosine Θ
ρ (gcm3) Fiber Length (cm)
Θ is the pennation angle of the muscle fibers
16
Effects of Muscle Length and Contraction Velocity
17
18
Muscles Respond to Loads
Transduction of mechanical load
Forces transmitted through extracellular matrix
Generate chemical signals Activate voltage gated
channels Activate IGF secretion
(autocrine signaling)
Transduction of neural activation
Ca2+ increase ndash activate Ca2+ - calmodulin calcineurin pathway
Alter gene expression in favor of protein synthesis
19
Protein Synthesis
20
Protein Degradation
21
Muscle Development and Maintenance
Proliferate after heavy use or muscle injury
22
23
Tidball J Appl Phsyiol 2005
24
Haszele and Price Endocrinology 2004
25
Myostatin is a member of the TGF-b superfamily that regulates development and tissue homeostasis
Myostatin is expressed almost exclusively in skeletal muscle and acts as a negative regulator of muscle growth
Rodent models of experimental disease states show upregulated myostatin mRNA
Studies in humans show that a lack of functional myostatin results in increased muscle mass due to hyperplasia andor hypertrophy
Interest in Myostatin
26
Se-Jin Lee Annual Review Cell Dev Bio 2004
TGFβ Superfamily
27
Activation of Myostatin Pathway
Activation of Myostatin Pathway
Myostatin Pathway Blockade
Skeletal Muscle Growth Leanness
Muscle Wasting Cachexia Syndrome
Myostatin Effects
28
Naturally deficient Naturally deficient myostatin genemyostatin gene
Myostatinrsquos Obvious Effects
Genetically created deficient myostatin gene
(Knockout)
29
Myostatin and Humans
But not just cattle and But not just cattle and mice helliphellipmice helliphellip
30
Se-Jin Lee Annual Review Cell Dev Bio 2004
Inhibition of the Myostatin Inhibitor
31
Myostatin Signaling
32
Myostatin vs Other Established Muscle Metabolism Pathways
Mature Myocyte Myoblast
IGF1
PI3KAkt
FOXO
Ubiquitin-ProteasomePathway
(Atrogin-1 MuRF-1)
PROTEIN (eg MHC)DEGRADATION
mTOR
GSK3
eIF2B 4EBP1S6K
PROTEINSYNTHESIS
MyoDMEF2
CdK2 CdK inhibitors(p21)
PhosphoSMAD23
DifferentiationMyogenesis
+
-
PhosphoActRIIb
MYOSTATIN
33
Skeletal muscle wasting is prevalent in a variety of diseases
Weightlessness during space flight
Cancer cachexia
Muscular dystrophy
Geriatric sarcopenia
Obesitydiabetes
Skeletal muscle wasting results in reduced muscle strength disability and impaired quality of life
No current therapy to prevent or reverse muscle atrophy
Potential for Blocking Myostatin
34
Suspended at 30ordm for 14 days
Access to 100 of cage
Food and water ad libitum
12-h photoperiod
Disuse Models
Human bedrest (6ordm Head Down Tilt)
Durations - days to months Cardiovascular muscle and bone
effects Controlled diet
35
791090
2
4
6
8
10
12
14
16
US P TS P
So
leu
s W
et M
ass
(mg
)
Muscle Mass
Whole Animal Leg Strength
Hindlimb Suspension Effects
Isolated Muscle Strength
36
2200
2250
2300
2350
2400
2450
2500
2550
2600
2650
2700
0 2 4 6 8 10 12 14
Day of Study
Bo
dy
Mas
s (g
ram
s)
US D
US P
TS D
TS P
Body Mass
37
15
16
17
18
19
20
21
22
US P US D TS P TS D
Lea
n B
od
y M
ass
(g
)
0
asymp
Lean Body Mass
US gt TSPlt0001
D gt PPlt0001
38
Study Design
Subjects ndash 10 male volunteers 18-45 years old 10 day strict horizontal bed rest with restricted 5 day
lead in and 4 day follow up periods Controlled diet ndash 55 carb 30 fat 15 protein Caloric intake set to maintain body weight
39
RawImage
Partially ProcessedImage
Double Threshold Analysis
40
Quadriceps Size Change
50
60
70
80
90
Pre-Bed Rest End-Bed Rest
Mea
n C
SA
S
lice
(cm
2 )
-50
-10
-8
-6
-4
-2
0
Δ C
hang
e M
ean
CS
A (
)
p lt 0001
MRI images obtained with Tr = 550ms Te = 10ms Slice thickness = 1cm with 0 overlap Pre-BR and end-BR slices aligned on anatomical features Analysis from distal end of rectus femoris to highest portion of thigh excluding the
gluteus maximus
41
GDF8 vs Δ Muscle Size
Correlation found between absolute level of GDF8 expression pre-bed rest with change in muscle size
Correlations between Δ muscle size and Δ myostatin expression were not observed
-10
-8
-6
-4
-2
000 10 20 30 40
Pre-BR GDF8GAPDH
Δ Q
uads
Mea
n C
SA
(
)
r = - 066p lt 005
42
Summary of Muscle Feedback
Muscle Strength (PCSA)
IGF-1
ProteinDegradation
ExternalLoads Demands
Insulin
Protein Synthesis
Circulating IGF-1
Satellite CellActivation
+
Myostatin
MuscleHypertrophy
MuscleHyperplasia
+
Transduction Mechanical Electrical
--
-
-

8
9
Cellular Energy Production
10
11
TYPE of FIBER
CharacteristicSlow Oxidative
(I)Fast Oxidative
(IIa)Fast Glycolytic
(IIb)
Myosin ATPase activity LOW HIGH HIGH
Speed of Contraction SLOW FAST FAST
Fatigue Resistance HIGH Intermediate LOW
Oxidative Capacity HIGH HIGH LOW
Anaerobic Enzyme Content LOW Intermediate HIGH
Mitochondria MANY MANY FEW
Capillaries MANY MANY FEW
Myoglobin Content HIGH HIGH LOW
Color of Fiber RED RED WHITE
Glycogen Content LOW Intermediate HIGH
Myoglobin Content HIGH HIGH LOW
Fiber Diameter SMALL Intermediate LARGE
12
13
Tetanic Contraction
14
15
PCSA (cm2) = Muscle Mass (g) cosine Θ
ρ (gcm3) Fiber Length (cm)
Θ is the pennation angle of the muscle fibers
16
Effects of Muscle Length and Contraction Velocity
17
18
Muscles Respond to Loads
Transduction of mechanical load
Forces transmitted through extracellular matrix
Generate chemical signals Activate voltage gated
channels Activate IGF secretion
(autocrine signaling)
Transduction of neural activation
Ca2+ increase ndash activate Ca2+ - calmodulin calcineurin pathway
Alter gene expression in favor of protein synthesis
19
Protein Synthesis
20
Protein Degradation
21
Muscle Development and Maintenance
Proliferate after heavy use or muscle injury
22
23
Tidball J Appl Phsyiol 2005
24
Haszele and Price Endocrinology 2004
25
Myostatin is a member of the TGF-b superfamily that regulates development and tissue homeostasis
Myostatin is expressed almost exclusively in skeletal muscle and acts as a negative regulator of muscle growth
Rodent models of experimental disease states show upregulated myostatin mRNA
Studies in humans show that a lack of functional myostatin results in increased muscle mass due to hyperplasia andor hypertrophy
Interest in Myostatin
26
Se-Jin Lee Annual Review Cell Dev Bio 2004
TGFβ Superfamily
27
Activation of Myostatin Pathway
Activation of Myostatin Pathway
Myostatin Pathway Blockade
Skeletal Muscle Growth Leanness
Muscle Wasting Cachexia Syndrome
Myostatin Effects
28
Naturally deficient Naturally deficient myostatin genemyostatin gene
Myostatinrsquos Obvious Effects
Genetically created deficient myostatin gene
(Knockout)
29
Myostatin and Humans
But not just cattle and But not just cattle and mice helliphellipmice helliphellip
30
Se-Jin Lee Annual Review Cell Dev Bio 2004
Inhibition of the Myostatin Inhibitor
31
Myostatin Signaling
32
Myostatin vs Other Established Muscle Metabolism Pathways
Mature Myocyte Myoblast
IGF1
PI3KAkt
FOXO
Ubiquitin-ProteasomePathway
(Atrogin-1 MuRF-1)
PROTEIN (eg MHC)DEGRADATION
mTOR
GSK3
eIF2B 4EBP1S6K
PROTEINSYNTHESIS
MyoDMEF2
CdK2 CdK inhibitors(p21)
PhosphoSMAD23
DifferentiationMyogenesis
+
-
PhosphoActRIIb
MYOSTATIN
33
Skeletal muscle wasting is prevalent in a variety of diseases
Weightlessness during space flight
Cancer cachexia
Muscular dystrophy
Geriatric sarcopenia
Obesitydiabetes
Skeletal muscle wasting results in reduced muscle strength disability and impaired quality of life
No current therapy to prevent or reverse muscle atrophy
Potential for Blocking Myostatin
34
Suspended at 30ordm for 14 days
Access to 100 of cage
Food and water ad libitum
12-h photoperiod
Disuse Models
Human bedrest (6ordm Head Down Tilt)
Durations - days to months Cardiovascular muscle and bone
effects Controlled diet
35
791090
2
4
6
8
10
12
14
16
US P TS P
So
leu
s W
et M
ass
(mg
)
Muscle Mass
Whole Animal Leg Strength
Hindlimb Suspension Effects
Isolated Muscle Strength
36
2200
2250
2300
2350
2400
2450
2500
2550
2600
2650
2700
0 2 4 6 8 10 12 14
Day of Study
Bo
dy
Mas
s (g
ram
s)
US D
US P
TS D
TS P
Body Mass
37
15
16
17
18
19
20
21
22
US P US D TS P TS D
Lea
n B
od
y M
ass
(g
)
0
asymp
Lean Body Mass
US gt TSPlt0001
D gt PPlt0001
38
Study Design
Subjects ndash 10 male volunteers 18-45 years old 10 day strict horizontal bed rest with restricted 5 day
lead in and 4 day follow up periods Controlled diet ndash 55 carb 30 fat 15 protein Caloric intake set to maintain body weight
39
RawImage
Partially ProcessedImage
Double Threshold Analysis
40
Quadriceps Size Change
50
60
70
80
90
Pre-Bed Rest End-Bed Rest
Mea
n C
SA
S
lice
(cm
2 )
-50
-10
-8
-6
-4
-2
0
Δ C
hang
e M
ean
CS
A (
)
p lt 0001
MRI images obtained with Tr = 550ms Te = 10ms Slice thickness = 1cm with 0 overlap Pre-BR and end-BR slices aligned on anatomical features Analysis from distal end of rectus femoris to highest portion of thigh excluding the
gluteus maximus
41
GDF8 vs Δ Muscle Size
Correlation found between absolute level of GDF8 expression pre-bed rest with change in muscle size
Correlations between Δ muscle size and Δ myostatin expression were not observed
-10
-8
-6
-4
-2
000 10 20 30 40
Pre-BR GDF8GAPDH
Δ Q
uads
Mea
n C
SA
(
)
r = - 066p lt 005
42
Summary of Muscle Feedback
Muscle Strength (PCSA)
IGF-1
ProteinDegradation
ExternalLoads Demands
Insulin
Protein Synthesis
Circulating IGF-1
Satellite CellActivation
+
Myostatin
MuscleHypertrophy
MuscleHyperplasia
+
Transduction Mechanical Electrical
--
-
-

10
11
TYPE of FIBER
CharacteristicSlow Oxidative
(I)Fast Oxidative
(IIa)Fast Glycolytic
(IIb)
Myosin ATPase activity LOW HIGH HIGH
Speed of Contraction SLOW FAST FAST
Fatigue Resistance HIGH Intermediate LOW
Oxidative Capacity HIGH HIGH LOW
Anaerobic Enzyme Content LOW Intermediate HIGH
Mitochondria MANY MANY FEW
Capillaries MANY MANY FEW
Myoglobin Content HIGH HIGH LOW
Color of Fiber RED RED WHITE
Glycogen Content LOW Intermediate HIGH
Myoglobin Content HIGH HIGH LOW
Fiber Diameter SMALL Intermediate LARGE
12
13
Tetanic Contraction
14
15
PCSA (cm2) = Muscle Mass (g) cosine Θ
ρ (gcm3) Fiber Length (cm)
Θ is the pennation angle of the muscle fibers
16
Effects of Muscle Length and Contraction Velocity
17
18
Muscles Respond to Loads
Transduction of mechanical load
Forces transmitted through extracellular matrix
Generate chemical signals Activate voltage gated
channels Activate IGF secretion
(autocrine signaling)
Transduction of neural activation
Ca2+ increase ndash activate Ca2+ - calmodulin calcineurin pathway
Alter gene expression in favor of protein synthesis
19
Protein Synthesis
20
Protein Degradation
21
Muscle Development and Maintenance
Proliferate after heavy use or muscle injury
22
23
Tidball J Appl Phsyiol 2005
24
Haszele and Price Endocrinology 2004
25
Myostatin is a member of the TGF-b superfamily that regulates development and tissue homeostasis
Myostatin is expressed almost exclusively in skeletal muscle and acts as a negative regulator of muscle growth
Rodent models of experimental disease states show upregulated myostatin mRNA
Studies in humans show that a lack of functional myostatin results in increased muscle mass due to hyperplasia andor hypertrophy
Interest in Myostatin
26
Se-Jin Lee Annual Review Cell Dev Bio 2004
TGFβ Superfamily
27
Activation of Myostatin Pathway
Activation of Myostatin Pathway
Myostatin Pathway Blockade
Skeletal Muscle Growth Leanness
Muscle Wasting Cachexia Syndrome
Myostatin Effects
28
Naturally deficient Naturally deficient myostatin genemyostatin gene
Myostatinrsquos Obvious Effects
Genetically created deficient myostatin gene
(Knockout)
29
Myostatin and Humans
But not just cattle and But not just cattle and mice helliphellipmice helliphellip
30
Se-Jin Lee Annual Review Cell Dev Bio 2004
Inhibition of the Myostatin Inhibitor
31
Myostatin Signaling
32
Myostatin vs Other Established Muscle Metabolism Pathways
Mature Myocyte Myoblast
IGF1
PI3KAkt
FOXO
Ubiquitin-ProteasomePathway
(Atrogin-1 MuRF-1)
PROTEIN (eg MHC)DEGRADATION
mTOR
GSK3
eIF2B 4EBP1S6K
PROTEINSYNTHESIS
MyoDMEF2
CdK2 CdK inhibitors(p21)
PhosphoSMAD23
DifferentiationMyogenesis
+
-
PhosphoActRIIb
MYOSTATIN
33
Skeletal muscle wasting is prevalent in a variety of diseases
Weightlessness during space flight
Cancer cachexia
Muscular dystrophy
Geriatric sarcopenia
Obesitydiabetes
Skeletal muscle wasting results in reduced muscle strength disability and impaired quality of life
No current therapy to prevent or reverse muscle atrophy
Potential for Blocking Myostatin
34
Suspended at 30ordm for 14 days
Access to 100 of cage
Food and water ad libitum
12-h photoperiod
Disuse Models
Human bedrest (6ordm Head Down Tilt)
Durations - days to months Cardiovascular muscle and bone
effects Controlled diet
35
791090
2
4
6
8
10
12
14
16
US P TS P
So
leu
s W
et M
ass
(mg
)
Muscle Mass
Whole Animal Leg Strength
Hindlimb Suspension Effects
Isolated Muscle Strength
36
2200
2250
2300
2350
2400
2450
2500
2550
2600
2650
2700
0 2 4 6 8 10 12 14
Day of Study
Bo
dy
Mas
s (g
ram
s)
US D
US P
TS D
TS P
Body Mass
37
15
16
17
18
19
20
21
22
US P US D TS P TS D
Lea
n B
od
y M
ass
(g
)
0
asymp
Lean Body Mass
US gt TSPlt0001
D gt PPlt0001
38
Study Design
Subjects ndash 10 male volunteers 18-45 years old 10 day strict horizontal bed rest with restricted 5 day
lead in and 4 day follow up periods Controlled diet ndash 55 carb 30 fat 15 protein Caloric intake set to maintain body weight
39
RawImage
Partially ProcessedImage
Double Threshold Analysis
40
Quadriceps Size Change
50
60
70
80
90
Pre-Bed Rest End-Bed Rest
Mea
n C
SA
S
lice
(cm
2 )
-50
-10
-8
-6
-4
-2
0
Δ C
hang
e M
ean
CS
A (
)
p lt 0001
MRI images obtained with Tr = 550ms Te = 10ms Slice thickness = 1cm with 0 overlap Pre-BR and end-BR slices aligned on anatomical features Analysis from distal end of rectus femoris to highest portion of thigh excluding the
gluteus maximus
41
GDF8 vs Δ Muscle Size
Correlation found between absolute level of GDF8 expression pre-bed rest with change in muscle size
Correlations between Δ muscle size and Δ myostatin expression were not observed
-10
-8
-6
-4
-2
000 10 20 30 40
Pre-BR GDF8GAPDH
Δ Q
uads
Mea
n C
SA
(
)
r = - 066p lt 005
42
Summary of Muscle Feedback
Muscle Strength (PCSA)
IGF-1
ProteinDegradation
ExternalLoads Demands
Insulin
Protein Synthesis
Circulating IGF-1
Satellite CellActivation
+
Myostatin
MuscleHypertrophy
MuscleHyperplasia
+
Transduction Mechanical Electrical
--
-
-

12
13
Tetanic Contraction
14
15
PCSA (cm2) = Muscle Mass (g) cosine Θ
ρ (gcm3) Fiber Length (cm)
Θ is the pennation angle of the muscle fibers
16
Effects of Muscle Length and Contraction Velocity
17
18
Muscles Respond to Loads
Transduction of mechanical load
Forces transmitted through extracellular matrix
Generate chemical signals Activate voltage gated
channels Activate IGF secretion
(autocrine signaling)
Transduction of neural activation
Ca2+ increase ndash activate Ca2+ - calmodulin calcineurin pathway
Alter gene expression in favor of protein synthesis
19
Protein Synthesis
20
Protein Degradation
21
Muscle Development and Maintenance
Proliferate after heavy use or muscle injury
22
23
Tidball J Appl Phsyiol 2005
24
Haszele and Price Endocrinology 2004
25
Myostatin is a member of the TGF-b superfamily that regulates development and tissue homeostasis
Myostatin is expressed almost exclusively in skeletal muscle and acts as a negative regulator of muscle growth
Rodent models of experimental disease states show upregulated myostatin mRNA
Studies in humans show that a lack of functional myostatin results in increased muscle mass due to hyperplasia andor hypertrophy
Interest in Myostatin
26
Se-Jin Lee Annual Review Cell Dev Bio 2004
TGFβ Superfamily
27
Activation of Myostatin Pathway
Activation of Myostatin Pathway
Myostatin Pathway Blockade
Skeletal Muscle Growth Leanness
Muscle Wasting Cachexia Syndrome
Myostatin Effects
28
Naturally deficient Naturally deficient myostatin genemyostatin gene
Myostatinrsquos Obvious Effects
Genetically created deficient myostatin gene
(Knockout)
29
Myostatin and Humans
But not just cattle and But not just cattle and mice helliphellipmice helliphellip
30
Se-Jin Lee Annual Review Cell Dev Bio 2004
Inhibition of the Myostatin Inhibitor
31
Myostatin Signaling
32
Myostatin vs Other Established Muscle Metabolism Pathways
Mature Myocyte Myoblast
IGF1
PI3KAkt
FOXO
Ubiquitin-ProteasomePathway
(Atrogin-1 MuRF-1)
PROTEIN (eg MHC)DEGRADATION
mTOR
GSK3
eIF2B 4EBP1S6K
PROTEINSYNTHESIS
MyoDMEF2
CdK2 CdK inhibitors(p21)
PhosphoSMAD23
DifferentiationMyogenesis
+
-
PhosphoActRIIb
MYOSTATIN
33
Skeletal muscle wasting is prevalent in a variety of diseases
Weightlessness during space flight
Cancer cachexia
Muscular dystrophy
Geriatric sarcopenia
Obesitydiabetes
Skeletal muscle wasting results in reduced muscle strength disability and impaired quality of life
No current therapy to prevent or reverse muscle atrophy
Potential for Blocking Myostatin
34
Suspended at 30ordm for 14 days
Access to 100 of cage
Food and water ad libitum
12-h photoperiod
Disuse Models
Human bedrest (6ordm Head Down Tilt)
Durations - days to months Cardiovascular muscle and bone
effects Controlled diet
35
791090
2
4
6
8
10
12
14
16
US P TS P
So
leu
s W
et M
ass
(mg
)
Muscle Mass
Whole Animal Leg Strength
Hindlimb Suspension Effects
Isolated Muscle Strength
36
2200
2250
2300
2350
2400
2450
2500
2550
2600
2650
2700
0 2 4 6 8 10 12 14
Day of Study
Bo
dy
Mas
s (g
ram
s)
US D
US P
TS D
TS P
Body Mass
37
15
16
17
18
19
20
21
22
US P US D TS P TS D
Lea
n B
od
y M
ass
(g
)
0
asymp
Lean Body Mass
US gt TSPlt0001
D gt PPlt0001
38
Study Design
Subjects ndash 10 male volunteers 18-45 years old 10 day strict horizontal bed rest with restricted 5 day
lead in and 4 day follow up periods Controlled diet ndash 55 carb 30 fat 15 protein Caloric intake set to maintain body weight
39
RawImage
Partially ProcessedImage
Double Threshold Analysis
40
Quadriceps Size Change
50
60
70
80
90
Pre-Bed Rest End-Bed Rest
Mea
n C
SA
S
lice
(cm
2 )
-50
-10
-8
-6
-4
-2
0
Δ C
hang
e M
ean
CS
A (
)
p lt 0001
MRI images obtained with Tr = 550ms Te = 10ms Slice thickness = 1cm with 0 overlap Pre-BR and end-BR slices aligned on anatomical features Analysis from distal end of rectus femoris to highest portion of thigh excluding the
gluteus maximus
41
GDF8 vs Δ Muscle Size
Correlation found between absolute level of GDF8 expression pre-bed rest with change in muscle size
Correlations between Δ muscle size and Δ myostatin expression were not observed
-10
-8
-6
-4
-2
000 10 20 30 40
Pre-BR GDF8GAPDH
Δ Q
uads
Mea
n C
SA
(
)
r = - 066p lt 005
42
Summary of Muscle Feedback
Muscle Strength (PCSA)
IGF-1
ProteinDegradation
ExternalLoads Demands
Insulin
Protein Synthesis
Circulating IGF-1
Satellite CellActivation
+
Myostatin
MuscleHypertrophy
MuscleHyperplasia
+
Transduction Mechanical Electrical
--
-
-

14
15
PCSA (cm2) = Muscle Mass (g) cosine Θ
ρ (gcm3) Fiber Length (cm)
Θ is the pennation angle of the muscle fibers
16
Effects of Muscle Length and Contraction Velocity
17
18
Muscles Respond to Loads
Transduction of mechanical load
Forces transmitted through extracellular matrix
Generate chemical signals Activate voltage gated
channels Activate IGF secretion
(autocrine signaling)
Transduction of neural activation
Ca2+ increase ndash activate Ca2+ - calmodulin calcineurin pathway
Alter gene expression in favor of protein synthesis
19
Protein Synthesis
20
Protein Degradation
21
Muscle Development and Maintenance
Proliferate after heavy use or muscle injury
22
23
Tidball J Appl Phsyiol 2005
24
Haszele and Price Endocrinology 2004
25
Myostatin is a member of the TGF-b superfamily that regulates development and tissue homeostasis
Myostatin is expressed almost exclusively in skeletal muscle and acts as a negative regulator of muscle growth
Rodent models of experimental disease states show upregulated myostatin mRNA
Studies in humans show that a lack of functional myostatin results in increased muscle mass due to hyperplasia andor hypertrophy
Interest in Myostatin
26
Se-Jin Lee Annual Review Cell Dev Bio 2004
TGFβ Superfamily
27
Activation of Myostatin Pathway
Activation of Myostatin Pathway
Myostatin Pathway Blockade
Skeletal Muscle Growth Leanness
Muscle Wasting Cachexia Syndrome
Myostatin Effects
28
Naturally deficient Naturally deficient myostatin genemyostatin gene
Myostatinrsquos Obvious Effects
Genetically created deficient myostatin gene
(Knockout)
29
Myostatin and Humans
But not just cattle and But not just cattle and mice helliphellipmice helliphellip
30
Se-Jin Lee Annual Review Cell Dev Bio 2004
Inhibition of the Myostatin Inhibitor
31
Myostatin Signaling
32
Myostatin vs Other Established Muscle Metabolism Pathways
Mature Myocyte Myoblast
IGF1
PI3KAkt
FOXO
Ubiquitin-ProteasomePathway
(Atrogin-1 MuRF-1)
PROTEIN (eg MHC)DEGRADATION
mTOR
GSK3
eIF2B 4EBP1S6K
PROTEINSYNTHESIS
MyoDMEF2
CdK2 CdK inhibitors(p21)
PhosphoSMAD23
DifferentiationMyogenesis
+
-
PhosphoActRIIb
MYOSTATIN
33
Skeletal muscle wasting is prevalent in a variety of diseases
Weightlessness during space flight
Cancer cachexia
Muscular dystrophy
Geriatric sarcopenia
Obesitydiabetes
Skeletal muscle wasting results in reduced muscle strength disability and impaired quality of life
No current therapy to prevent or reverse muscle atrophy
Potential for Blocking Myostatin
34
Suspended at 30ordm for 14 days
Access to 100 of cage
Food and water ad libitum
12-h photoperiod
Disuse Models
Human bedrest (6ordm Head Down Tilt)
Durations - days to months Cardiovascular muscle and bone
effects Controlled diet
35
791090
2
4
6
8
10
12
14
16
US P TS P
So
leu
s W
et M
ass
(mg
)
Muscle Mass
Whole Animal Leg Strength
Hindlimb Suspension Effects
Isolated Muscle Strength
36
2200
2250
2300
2350
2400
2450
2500
2550
2600
2650
2700
0 2 4 6 8 10 12 14
Day of Study
Bo
dy
Mas
s (g
ram
s)
US D
US P
TS D
TS P
Body Mass
37
15
16
17
18
19
20
21
22
US P US D TS P TS D
Lea
n B
od
y M
ass
(g
)
0
asymp
Lean Body Mass
US gt TSPlt0001
D gt PPlt0001
38
Study Design
Subjects ndash 10 male volunteers 18-45 years old 10 day strict horizontal bed rest with restricted 5 day
lead in and 4 day follow up periods Controlled diet ndash 55 carb 30 fat 15 protein Caloric intake set to maintain body weight
39
RawImage
Partially ProcessedImage
Double Threshold Analysis
40
Quadriceps Size Change
50
60
70
80
90
Pre-Bed Rest End-Bed Rest
Mea
n C
SA
S
lice
(cm
2 )
-50
-10
-8
-6
-4
-2
0
Δ C
hang
e M
ean
CS
A (
)
p lt 0001
MRI images obtained with Tr = 550ms Te = 10ms Slice thickness = 1cm with 0 overlap Pre-BR and end-BR slices aligned on anatomical features Analysis from distal end of rectus femoris to highest portion of thigh excluding the
gluteus maximus
41
GDF8 vs Δ Muscle Size
Correlation found between absolute level of GDF8 expression pre-bed rest with change in muscle size
Correlations between Δ muscle size and Δ myostatin expression were not observed
-10
-8
-6
-4
-2
000 10 20 30 40
Pre-BR GDF8GAPDH
Δ Q
uads
Mea
n C
SA
(
)
r = - 066p lt 005
42
Summary of Muscle Feedback
Muscle Strength (PCSA)
IGF-1
ProteinDegradation
ExternalLoads Demands
Insulin
Protein Synthesis
Circulating IGF-1
Satellite CellActivation
+
Myostatin
MuscleHypertrophy
MuscleHyperplasia
+
Transduction Mechanical Electrical
--
-
-

15
PCSA (cm2) = Muscle Mass (g) cosine Θ
ρ (gcm3) Fiber Length (cm)
Θ is the pennation angle of the muscle fibers
16
Effects of Muscle Length and Contraction Velocity
17
18
Muscles Respond to Loads
Transduction of mechanical load
Forces transmitted through extracellular matrix
Generate chemical signals Activate voltage gated
channels Activate IGF secretion
(autocrine signaling)
Transduction of neural activation
Ca2+ increase ndash activate Ca2+ - calmodulin calcineurin pathway
Alter gene expression in favor of protein synthesis
19
Protein Synthesis
20
Protein Degradation
21
Muscle Development and Maintenance
Proliferate after heavy use or muscle injury
22
23
Tidball J Appl Phsyiol 2005
24
Haszele and Price Endocrinology 2004
25
Myostatin is a member of the TGF-b superfamily that regulates development and tissue homeostasis
Myostatin is expressed almost exclusively in skeletal muscle and acts as a negative regulator of muscle growth
Rodent models of experimental disease states show upregulated myostatin mRNA
Studies in humans show that a lack of functional myostatin results in increased muscle mass due to hyperplasia andor hypertrophy
Interest in Myostatin
26
Se-Jin Lee Annual Review Cell Dev Bio 2004
TGFβ Superfamily
27
Activation of Myostatin Pathway
Activation of Myostatin Pathway
Myostatin Pathway Blockade
Skeletal Muscle Growth Leanness
Muscle Wasting Cachexia Syndrome
Myostatin Effects
28
Naturally deficient Naturally deficient myostatin genemyostatin gene
Myostatinrsquos Obvious Effects
Genetically created deficient myostatin gene
(Knockout)
29
Myostatin and Humans
But not just cattle and But not just cattle and mice helliphellipmice helliphellip
30
Se-Jin Lee Annual Review Cell Dev Bio 2004
Inhibition of the Myostatin Inhibitor
31
Myostatin Signaling
32
Myostatin vs Other Established Muscle Metabolism Pathways
Mature Myocyte Myoblast
IGF1
PI3KAkt
FOXO
Ubiquitin-ProteasomePathway
(Atrogin-1 MuRF-1)
PROTEIN (eg MHC)DEGRADATION
mTOR
GSK3
eIF2B 4EBP1S6K
PROTEINSYNTHESIS
MyoDMEF2
CdK2 CdK inhibitors(p21)
PhosphoSMAD23
DifferentiationMyogenesis
+
-
PhosphoActRIIb
MYOSTATIN
33
Skeletal muscle wasting is prevalent in a variety of diseases
Weightlessness during space flight
Cancer cachexia
Muscular dystrophy
Geriatric sarcopenia
Obesitydiabetes
Skeletal muscle wasting results in reduced muscle strength disability and impaired quality of life
No current therapy to prevent or reverse muscle atrophy
Potential for Blocking Myostatin
34
Suspended at 30ordm for 14 days
Access to 100 of cage
Food and water ad libitum
12-h photoperiod
Disuse Models
Human bedrest (6ordm Head Down Tilt)
Durations - days to months Cardiovascular muscle and bone
effects Controlled diet
35
791090
2
4
6
8
10
12
14
16
US P TS P
So
leu
s W
et M
ass
(mg
)
Muscle Mass
Whole Animal Leg Strength
Hindlimb Suspension Effects
Isolated Muscle Strength
36
2200
2250
2300
2350
2400
2450
2500
2550
2600
2650
2700
0 2 4 6 8 10 12 14
Day of Study
Bo
dy
Mas
s (g
ram
s)
US D
US P
TS D
TS P
Body Mass
37
15
16
17
18
19
20
21
22
US P US D TS P TS D
Lea
n B
od
y M
ass
(g
)
0
asymp
Lean Body Mass
US gt TSPlt0001
D gt PPlt0001
38
Study Design
Subjects ndash 10 male volunteers 18-45 years old 10 day strict horizontal bed rest with restricted 5 day
lead in and 4 day follow up periods Controlled diet ndash 55 carb 30 fat 15 protein Caloric intake set to maintain body weight
39
RawImage
Partially ProcessedImage
Double Threshold Analysis
40
Quadriceps Size Change
50
60
70
80
90
Pre-Bed Rest End-Bed Rest
Mea
n C
SA
S
lice
(cm
2 )
-50
-10
-8
-6
-4
-2
0
Δ C
hang
e M
ean
CS
A (
)
p lt 0001
MRI images obtained with Tr = 550ms Te = 10ms Slice thickness = 1cm with 0 overlap Pre-BR and end-BR slices aligned on anatomical features Analysis from distal end of rectus femoris to highest portion of thigh excluding the
gluteus maximus
41
GDF8 vs Δ Muscle Size
Correlation found between absolute level of GDF8 expression pre-bed rest with change in muscle size
Correlations between Δ muscle size and Δ myostatin expression were not observed
-10
-8
-6
-4
-2
000 10 20 30 40
Pre-BR GDF8GAPDH
Δ Q
uads
Mea
n C
SA
(
)
r = - 066p lt 005
42
Summary of Muscle Feedback
Muscle Strength (PCSA)
IGF-1
ProteinDegradation
ExternalLoads Demands
Insulin
Protein Synthesis
Circulating IGF-1
Satellite CellActivation
+
Myostatin
MuscleHypertrophy
MuscleHyperplasia
+
Transduction Mechanical Electrical
--
-
-

16
Effects of Muscle Length and Contraction Velocity
17
18
Muscles Respond to Loads
Transduction of mechanical load
Forces transmitted through extracellular matrix
Generate chemical signals Activate voltage gated
channels Activate IGF secretion
(autocrine signaling)
Transduction of neural activation
Ca2+ increase ndash activate Ca2+ - calmodulin calcineurin pathway
Alter gene expression in favor of protein synthesis
19
Protein Synthesis
20
Protein Degradation
21
Muscle Development and Maintenance
Proliferate after heavy use or muscle injury
22
23
Tidball J Appl Phsyiol 2005
24
Haszele and Price Endocrinology 2004
25
Myostatin is a member of the TGF-b superfamily that regulates development and tissue homeostasis
Myostatin is expressed almost exclusively in skeletal muscle and acts as a negative regulator of muscle growth
Rodent models of experimental disease states show upregulated myostatin mRNA
Studies in humans show that a lack of functional myostatin results in increased muscle mass due to hyperplasia andor hypertrophy
Interest in Myostatin
26
Se-Jin Lee Annual Review Cell Dev Bio 2004
TGFβ Superfamily
27
Activation of Myostatin Pathway
Activation of Myostatin Pathway
Myostatin Pathway Blockade
Skeletal Muscle Growth Leanness
Muscle Wasting Cachexia Syndrome
Myostatin Effects
28
Naturally deficient Naturally deficient myostatin genemyostatin gene
Myostatinrsquos Obvious Effects
Genetically created deficient myostatin gene
(Knockout)
29
Myostatin and Humans
But not just cattle and But not just cattle and mice helliphellipmice helliphellip
30
Se-Jin Lee Annual Review Cell Dev Bio 2004
Inhibition of the Myostatin Inhibitor
31
Myostatin Signaling
32
Myostatin vs Other Established Muscle Metabolism Pathways
Mature Myocyte Myoblast
IGF1
PI3KAkt
FOXO
Ubiquitin-ProteasomePathway
(Atrogin-1 MuRF-1)
PROTEIN (eg MHC)DEGRADATION
mTOR
GSK3
eIF2B 4EBP1S6K
PROTEINSYNTHESIS
MyoDMEF2
CdK2 CdK inhibitors(p21)
PhosphoSMAD23
DifferentiationMyogenesis
+
-
PhosphoActRIIb
MYOSTATIN
33
Skeletal muscle wasting is prevalent in a variety of diseases
Weightlessness during space flight
Cancer cachexia
Muscular dystrophy
Geriatric sarcopenia
Obesitydiabetes
Skeletal muscle wasting results in reduced muscle strength disability and impaired quality of life
No current therapy to prevent or reverse muscle atrophy
Potential for Blocking Myostatin
34
Suspended at 30ordm for 14 days
Access to 100 of cage
Food and water ad libitum
12-h photoperiod
Disuse Models
Human bedrest (6ordm Head Down Tilt)
Durations - days to months Cardiovascular muscle and bone
effects Controlled diet
35
791090
2
4
6
8
10
12
14
16
US P TS P
So
leu
s W
et M
ass
(mg
)
Muscle Mass
Whole Animal Leg Strength
Hindlimb Suspension Effects
Isolated Muscle Strength
36
2200
2250
2300
2350
2400
2450
2500
2550
2600
2650
2700
0 2 4 6 8 10 12 14
Day of Study
Bo
dy
Mas
s (g
ram
s)
US D
US P
TS D
TS P
Body Mass
37
15
16
17
18
19
20
21
22
US P US D TS P TS D
Lea
n B
od
y M
ass
(g
)
0
asymp
Lean Body Mass
US gt TSPlt0001
D gt PPlt0001
38
Study Design
Subjects ndash 10 male volunteers 18-45 years old 10 day strict horizontal bed rest with restricted 5 day
lead in and 4 day follow up periods Controlled diet ndash 55 carb 30 fat 15 protein Caloric intake set to maintain body weight
39
RawImage
Partially ProcessedImage
Double Threshold Analysis
40
Quadriceps Size Change
50
60
70
80
90
Pre-Bed Rest End-Bed Rest
Mea
n C
SA
S
lice
(cm
2 )
-50
-10
-8
-6
-4
-2
0
Δ C
hang
e M
ean
CS
A (
)
p lt 0001
MRI images obtained with Tr = 550ms Te = 10ms Slice thickness = 1cm with 0 overlap Pre-BR and end-BR slices aligned on anatomical features Analysis from distal end of rectus femoris to highest portion of thigh excluding the
gluteus maximus
41
GDF8 vs Δ Muscle Size
Correlation found between absolute level of GDF8 expression pre-bed rest with change in muscle size
Correlations between Δ muscle size and Δ myostatin expression were not observed
-10
-8
-6
-4
-2
000 10 20 30 40
Pre-BR GDF8GAPDH
Δ Q
uads
Mea
n C
SA
(
)
r = - 066p lt 005
42
Summary of Muscle Feedback
Muscle Strength (PCSA)
IGF-1
ProteinDegradation
ExternalLoads Demands
Insulin
Protein Synthesis
Circulating IGF-1
Satellite CellActivation
+
Myostatin
MuscleHypertrophy
MuscleHyperplasia
+
Transduction Mechanical Electrical
--
-
-

17
18
Muscles Respond to Loads
Transduction of mechanical load
Forces transmitted through extracellular matrix
Generate chemical signals Activate voltage gated
channels Activate IGF secretion
(autocrine signaling)
Transduction of neural activation
Ca2+ increase ndash activate Ca2+ - calmodulin calcineurin pathway
Alter gene expression in favor of protein synthesis
19
Protein Synthesis
20
Protein Degradation
21
Muscle Development and Maintenance
Proliferate after heavy use or muscle injury
22
23
Tidball J Appl Phsyiol 2005
24
Haszele and Price Endocrinology 2004
25
Myostatin is a member of the TGF-b superfamily that regulates development and tissue homeostasis
Myostatin is expressed almost exclusively in skeletal muscle and acts as a negative regulator of muscle growth
Rodent models of experimental disease states show upregulated myostatin mRNA
Studies in humans show that a lack of functional myostatin results in increased muscle mass due to hyperplasia andor hypertrophy
Interest in Myostatin
26
Se-Jin Lee Annual Review Cell Dev Bio 2004
TGFβ Superfamily
27
Activation of Myostatin Pathway
Activation of Myostatin Pathway
Myostatin Pathway Blockade
Skeletal Muscle Growth Leanness
Muscle Wasting Cachexia Syndrome
Myostatin Effects
28
Naturally deficient Naturally deficient myostatin genemyostatin gene
Myostatinrsquos Obvious Effects
Genetically created deficient myostatin gene
(Knockout)
29
Myostatin and Humans
But not just cattle and But not just cattle and mice helliphellipmice helliphellip
30
Se-Jin Lee Annual Review Cell Dev Bio 2004
Inhibition of the Myostatin Inhibitor
31
Myostatin Signaling
32
Myostatin vs Other Established Muscle Metabolism Pathways
Mature Myocyte Myoblast
IGF1
PI3KAkt
FOXO
Ubiquitin-ProteasomePathway
(Atrogin-1 MuRF-1)
PROTEIN (eg MHC)DEGRADATION
mTOR
GSK3
eIF2B 4EBP1S6K
PROTEINSYNTHESIS
MyoDMEF2
CdK2 CdK inhibitors(p21)
PhosphoSMAD23
DifferentiationMyogenesis
+
-
PhosphoActRIIb
MYOSTATIN
33
Skeletal muscle wasting is prevalent in a variety of diseases
Weightlessness during space flight
Cancer cachexia
Muscular dystrophy
Geriatric sarcopenia
Obesitydiabetes
Skeletal muscle wasting results in reduced muscle strength disability and impaired quality of life
No current therapy to prevent or reverse muscle atrophy
Potential for Blocking Myostatin
34
Suspended at 30ordm for 14 days
Access to 100 of cage
Food and water ad libitum
12-h photoperiod
Disuse Models
Human bedrest (6ordm Head Down Tilt)
Durations - days to months Cardiovascular muscle and bone
effects Controlled diet
35
791090
2
4
6
8
10
12
14
16
US P TS P
So
leu
s W
et M
ass
(mg
)
Muscle Mass
Whole Animal Leg Strength
Hindlimb Suspension Effects
Isolated Muscle Strength
36
2200
2250
2300
2350
2400
2450
2500
2550
2600
2650
2700
0 2 4 6 8 10 12 14
Day of Study
Bo
dy
Mas
s (g
ram
s)
US D
US P
TS D
TS P
Body Mass
37
15
16
17
18
19
20
21
22
US P US D TS P TS D
Lea
n B
od
y M
ass
(g
)
0
asymp
Lean Body Mass
US gt TSPlt0001
D gt PPlt0001
38
Study Design
Subjects ndash 10 male volunteers 18-45 years old 10 day strict horizontal bed rest with restricted 5 day
lead in and 4 day follow up periods Controlled diet ndash 55 carb 30 fat 15 protein Caloric intake set to maintain body weight
39
RawImage
Partially ProcessedImage
Double Threshold Analysis
40
Quadriceps Size Change
50
60
70
80
90
Pre-Bed Rest End-Bed Rest
Mea
n C
SA
S
lice
(cm
2 )
-50
-10
-8
-6
-4
-2
0
Δ C
hang
e M
ean
CS
A (
)
p lt 0001
MRI images obtained with Tr = 550ms Te = 10ms Slice thickness = 1cm with 0 overlap Pre-BR and end-BR slices aligned on anatomical features Analysis from distal end of rectus femoris to highest portion of thigh excluding the
gluteus maximus
41
GDF8 vs Δ Muscle Size
Correlation found between absolute level of GDF8 expression pre-bed rest with change in muscle size
Correlations between Δ muscle size and Δ myostatin expression were not observed
-10
-8
-6
-4
-2
000 10 20 30 40
Pre-BR GDF8GAPDH
Δ Q
uads
Mea
n C
SA
(
)
r = - 066p lt 005
42
Summary of Muscle Feedback
Muscle Strength (PCSA)
IGF-1
ProteinDegradation
ExternalLoads Demands
Insulin
Protein Synthesis
Circulating IGF-1
Satellite CellActivation
+
Myostatin
MuscleHypertrophy
MuscleHyperplasia
+
Transduction Mechanical Electrical
--
-
-

18
Muscles Respond to Loads
Transduction of mechanical load
Forces transmitted through extracellular matrix
Generate chemical signals Activate voltage gated
channels Activate IGF secretion
(autocrine signaling)
Transduction of neural activation
Ca2+ increase ndash activate Ca2+ - calmodulin calcineurin pathway
Alter gene expression in favor of protein synthesis
19
Protein Synthesis
20
Protein Degradation
21
Muscle Development and Maintenance
Proliferate after heavy use or muscle injury
22
23
Tidball J Appl Phsyiol 2005
24
Haszele and Price Endocrinology 2004
25
Myostatin is a member of the TGF-b superfamily that regulates development and tissue homeostasis
Myostatin is expressed almost exclusively in skeletal muscle and acts as a negative regulator of muscle growth
Rodent models of experimental disease states show upregulated myostatin mRNA
Studies in humans show that a lack of functional myostatin results in increased muscle mass due to hyperplasia andor hypertrophy
Interest in Myostatin
26
Se-Jin Lee Annual Review Cell Dev Bio 2004
TGFβ Superfamily
27
Activation of Myostatin Pathway
Activation of Myostatin Pathway
Myostatin Pathway Blockade
Skeletal Muscle Growth Leanness
Muscle Wasting Cachexia Syndrome
Myostatin Effects
28
Naturally deficient Naturally deficient myostatin genemyostatin gene
Myostatinrsquos Obvious Effects
Genetically created deficient myostatin gene
(Knockout)
29
Myostatin and Humans
But not just cattle and But not just cattle and mice helliphellipmice helliphellip
30
Se-Jin Lee Annual Review Cell Dev Bio 2004
Inhibition of the Myostatin Inhibitor
31
Myostatin Signaling
32
Myostatin vs Other Established Muscle Metabolism Pathways
Mature Myocyte Myoblast
IGF1
PI3KAkt
FOXO
Ubiquitin-ProteasomePathway
(Atrogin-1 MuRF-1)
PROTEIN (eg MHC)DEGRADATION
mTOR
GSK3
eIF2B 4EBP1S6K
PROTEINSYNTHESIS
MyoDMEF2
CdK2 CdK inhibitors(p21)
PhosphoSMAD23
DifferentiationMyogenesis
+
-
PhosphoActRIIb
MYOSTATIN
33
Skeletal muscle wasting is prevalent in a variety of diseases
Weightlessness during space flight
Cancer cachexia
Muscular dystrophy
Geriatric sarcopenia
Obesitydiabetes
Skeletal muscle wasting results in reduced muscle strength disability and impaired quality of life
No current therapy to prevent or reverse muscle atrophy
Potential for Blocking Myostatin
34
Suspended at 30ordm for 14 days
Access to 100 of cage
Food and water ad libitum
12-h photoperiod
Disuse Models
Human bedrest (6ordm Head Down Tilt)
Durations - days to months Cardiovascular muscle and bone
effects Controlled diet
35
791090
2
4
6
8
10
12
14
16
US P TS P
So
leu
s W
et M
ass
(mg
)
Muscle Mass
Whole Animal Leg Strength
Hindlimb Suspension Effects
Isolated Muscle Strength
36
2200
2250
2300
2350
2400
2450
2500
2550
2600
2650
2700
0 2 4 6 8 10 12 14
Day of Study
Bo
dy
Mas
s (g
ram
s)
US D
US P
TS D
TS P
Body Mass
37
15
16
17
18
19
20
21
22
US P US D TS P TS D
Lea
n B
od
y M
ass
(g
)
0
asymp
Lean Body Mass
US gt TSPlt0001
D gt PPlt0001
38
Study Design
Subjects ndash 10 male volunteers 18-45 years old 10 day strict horizontal bed rest with restricted 5 day
lead in and 4 day follow up periods Controlled diet ndash 55 carb 30 fat 15 protein Caloric intake set to maintain body weight
39
RawImage
Partially ProcessedImage
Double Threshold Analysis
40
Quadriceps Size Change
50
60
70
80
90
Pre-Bed Rest End-Bed Rest
Mea
n C
SA
S
lice
(cm
2 )
-50
-10
-8
-6
-4
-2
0
Δ C
hang
e M
ean
CS
A (
)
p lt 0001
MRI images obtained with Tr = 550ms Te = 10ms Slice thickness = 1cm with 0 overlap Pre-BR and end-BR slices aligned on anatomical features Analysis from distal end of rectus femoris to highest portion of thigh excluding the
gluteus maximus
41
GDF8 vs Δ Muscle Size
Correlation found between absolute level of GDF8 expression pre-bed rest with change in muscle size
Correlations between Δ muscle size and Δ myostatin expression were not observed
-10
-8
-6
-4
-2
000 10 20 30 40
Pre-BR GDF8GAPDH
Δ Q
uads
Mea
n C
SA
(
)
r = - 066p lt 005
42
Summary of Muscle Feedback
Muscle Strength (PCSA)
IGF-1
ProteinDegradation
ExternalLoads Demands
Insulin
Protein Synthesis
Circulating IGF-1
Satellite CellActivation
+
Myostatin
MuscleHypertrophy
MuscleHyperplasia
+
Transduction Mechanical Electrical
--
-
-

19
Protein Synthesis
20
Protein Degradation
21
Muscle Development and Maintenance
Proliferate after heavy use or muscle injury
22
23
Tidball J Appl Phsyiol 2005
24
Haszele and Price Endocrinology 2004
25
Myostatin is a member of the TGF-b superfamily that regulates development and tissue homeostasis
Myostatin is expressed almost exclusively in skeletal muscle and acts as a negative regulator of muscle growth
Rodent models of experimental disease states show upregulated myostatin mRNA
Studies in humans show that a lack of functional myostatin results in increased muscle mass due to hyperplasia andor hypertrophy
Interest in Myostatin
26
Se-Jin Lee Annual Review Cell Dev Bio 2004
TGFβ Superfamily
27
Activation of Myostatin Pathway
Activation of Myostatin Pathway
Myostatin Pathway Blockade
Skeletal Muscle Growth Leanness
Muscle Wasting Cachexia Syndrome
Myostatin Effects
28
Naturally deficient Naturally deficient myostatin genemyostatin gene
Myostatinrsquos Obvious Effects
Genetically created deficient myostatin gene
(Knockout)
29
Myostatin and Humans
But not just cattle and But not just cattle and mice helliphellipmice helliphellip
30
Se-Jin Lee Annual Review Cell Dev Bio 2004
Inhibition of the Myostatin Inhibitor
31
Myostatin Signaling
32
Myostatin vs Other Established Muscle Metabolism Pathways
Mature Myocyte Myoblast
IGF1
PI3KAkt
FOXO
Ubiquitin-ProteasomePathway
(Atrogin-1 MuRF-1)
PROTEIN (eg MHC)DEGRADATION
mTOR
GSK3
eIF2B 4EBP1S6K
PROTEINSYNTHESIS
MyoDMEF2
CdK2 CdK inhibitors(p21)
PhosphoSMAD23
DifferentiationMyogenesis
+
-
PhosphoActRIIb
MYOSTATIN
33
Skeletal muscle wasting is prevalent in a variety of diseases
Weightlessness during space flight
Cancer cachexia
Muscular dystrophy
Geriatric sarcopenia
Obesitydiabetes
Skeletal muscle wasting results in reduced muscle strength disability and impaired quality of life
No current therapy to prevent or reverse muscle atrophy
Potential for Blocking Myostatin
34
Suspended at 30ordm for 14 days
Access to 100 of cage
Food and water ad libitum
12-h photoperiod
Disuse Models
Human bedrest (6ordm Head Down Tilt)
Durations - days to months Cardiovascular muscle and bone
effects Controlled diet
35
791090
2
4
6
8
10
12
14
16
US P TS P
So
leu
s W
et M
ass
(mg
)
Muscle Mass
Whole Animal Leg Strength
Hindlimb Suspension Effects
Isolated Muscle Strength
36
2200
2250
2300
2350
2400
2450
2500
2550
2600
2650
2700
0 2 4 6 8 10 12 14
Day of Study
Bo
dy
Mas
s (g
ram
s)
US D
US P
TS D
TS P
Body Mass
37
15
16
17
18
19
20
21
22
US P US D TS P TS D
Lea
n B
od
y M
ass
(g
)
0
asymp
Lean Body Mass
US gt TSPlt0001
D gt PPlt0001
38
Study Design
Subjects ndash 10 male volunteers 18-45 years old 10 day strict horizontal bed rest with restricted 5 day
lead in and 4 day follow up periods Controlled diet ndash 55 carb 30 fat 15 protein Caloric intake set to maintain body weight
39
RawImage
Partially ProcessedImage
Double Threshold Analysis
40
Quadriceps Size Change
50
60
70
80
90
Pre-Bed Rest End-Bed Rest
Mea
n C
SA
S
lice
(cm
2 )
-50
-10
-8
-6
-4
-2
0
Δ C
hang
e M
ean
CS
A (
)
p lt 0001
MRI images obtained with Tr = 550ms Te = 10ms Slice thickness = 1cm with 0 overlap Pre-BR and end-BR slices aligned on anatomical features Analysis from distal end of rectus femoris to highest portion of thigh excluding the
gluteus maximus
41
GDF8 vs Δ Muscle Size
Correlation found between absolute level of GDF8 expression pre-bed rest with change in muscle size
Correlations between Δ muscle size and Δ myostatin expression were not observed
-10
-8
-6
-4
-2
000 10 20 30 40
Pre-BR GDF8GAPDH
Δ Q
uads
Mea
n C
SA
(
)
r = - 066p lt 005
42
Summary of Muscle Feedback
Muscle Strength (PCSA)
IGF-1
ProteinDegradation
ExternalLoads Demands
Insulin
Protein Synthesis
Circulating IGF-1
Satellite CellActivation
+
Myostatin
MuscleHypertrophy
MuscleHyperplasia
+
Transduction Mechanical Electrical
--
-
-

20
Protein Degradation
21
Muscle Development and Maintenance
Proliferate after heavy use or muscle injury
22
23
Tidball J Appl Phsyiol 2005
24
Haszele and Price Endocrinology 2004
25
Myostatin is a member of the TGF-b superfamily that regulates development and tissue homeostasis
Myostatin is expressed almost exclusively in skeletal muscle and acts as a negative regulator of muscle growth
Rodent models of experimental disease states show upregulated myostatin mRNA
Studies in humans show that a lack of functional myostatin results in increased muscle mass due to hyperplasia andor hypertrophy
Interest in Myostatin
26
Se-Jin Lee Annual Review Cell Dev Bio 2004
TGFβ Superfamily
27
Activation of Myostatin Pathway
Activation of Myostatin Pathway
Myostatin Pathway Blockade
Skeletal Muscle Growth Leanness
Muscle Wasting Cachexia Syndrome
Myostatin Effects
28
Naturally deficient Naturally deficient myostatin genemyostatin gene
Myostatinrsquos Obvious Effects
Genetically created deficient myostatin gene
(Knockout)
29
Myostatin and Humans
But not just cattle and But not just cattle and mice helliphellipmice helliphellip
30
Se-Jin Lee Annual Review Cell Dev Bio 2004
Inhibition of the Myostatin Inhibitor
31
Myostatin Signaling
32
Myostatin vs Other Established Muscle Metabolism Pathways
Mature Myocyte Myoblast
IGF1
PI3KAkt
FOXO
Ubiquitin-ProteasomePathway
(Atrogin-1 MuRF-1)
PROTEIN (eg MHC)DEGRADATION
mTOR
GSK3
eIF2B 4EBP1S6K
PROTEINSYNTHESIS
MyoDMEF2
CdK2 CdK inhibitors(p21)
PhosphoSMAD23
DifferentiationMyogenesis
+
-
PhosphoActRIIb
MYOSTATIN
33
Skeletal muscle wasting is prevalent in a variety of diseases
Weightlessness during space flight
Cancer cachexia
Muscular dystrophy
Geriatric sarcopenia
Obesitydiabetes
Skeletal muscle wasting results in reduced muscle strength disability and impaired quality of life
No current therapy to prevent or reverse muscle atrophy
Potential for Blocking Myostatin
34
Suspended at 30ordm for 14 days
Access to 100 of cage
Food and water ad libitum
12-h photoperiod
Disuse Models
Human bedrest (6ordm Head Down Tilt)
Durations - days to months Cardiovascular muscle and bone
effects Controlled diet
35
791090
2
4
6
8
10
12
14
16
US P TS P
So
leu
s W
et M
ass
(mg
)
Muscle Mass
Whole Animal Leg Strength
Hindlimb Suspension Effects
Isolated Muscle Strength
36
2200
2250
2300
2350
2400
2450
2500
2550
2600
2650
2700
0 2 4 6 8 10 12 14
Day of Study
Bo
dy
Mas
s (g
ram
s)
US D
US P
TS D
TS P
Body Mass
37
15
16
17
18
19
20
21
22
US P US D TS P TS D
Lea
n B
od
y M
ass
(g
)
0
asymp
Lean Body Mass
US gt TSPlt0001
D gt PPlt0001
38
Study Design
Subjects ndash 10 male volunteers 18-45 years old 10 day strict horizontal bed rest with restricted 5 day
lead in and 4 day follow up periods Controlled diet ndash 55 carb 30 fat 15 protein Caloric intake set to maintain body weight
39
RawImage
Partially ProcessedImage
Double Threshold Analysis
40
Quadriceps Size Change
50
60
70
80
90
Pre-Bed Rest End-Bed Rest
Mea
n C
SA
S
lice
(cm
2 )
-50
-10
-8
-6
-4
-2
0
Δ C
hang
e M
ean
CS
A (
)
p lt 0001
MRI images obtained with Tr = 550ms Te = 10ms Slice thickness = 1cm with 0 overlap Pre-BR and end-BR slices aligned on anatomical features Analysis from distal end of rectus femoris to highest portion of thigh excluding the
gluteus maximus
41
GDF8 vs Δ Muscle Size
Correlation found between absolute level of GDF8 expression pre-bed rest with change in muscle size
Correlations between Δ muscle size and Δ myostatin expression were not observed
-10
-8
-6
-4
-2
000 10 20 30 40
Pre-BR GDF8GAPDH
Δ Q
uads
Mea
n C
SA
(
)
r = - 066p lt 005
42
Summary of Muscle Feedback
Muscle Strength (PCSA)
IGF-1
ProteinDegradation
ExternalLoads Demands
Insulin
Protein Synthesis
Circulating IGF-1
Satellite CellActivation
+
Myostatin
MuscleHypertrophy
MuscleHyperplasia
+
Transduction Mechanical Electrical
--
-
-

21
Muscle Development and Maintenance
Proliferate after heavy use or muscle injury
22
23
Tidball J Appl Phsyiol 2005
24
Haszele and Price Endocrinology 2004
25
Myostatin is a member of the TGF-b superfamily that regulates development and tissue homeostasis
Myostatin is expressed almost exclusively in skeletal muscle and acts as a negative regulator of muscle growth
Rodent models of experimental disease states show upregulated myostatin mRNA
Studies in humans show that a lack of functional myostatin results in increased muscle mass due to hyperplasia andor hypertrophy
Interest in Myostatin
26
Se-Jin Lee Annual Review Cell Dev Bio 2004
TGFβ Superfamily
27
Activation of Myostatin Pathway
Activation of Myostatin Pathway
Myostatin Pathway Blockade
Skeletal Muscle Growth Leanness
Muscle Wasting Cachexia Syndrome
Myostatin Effects
28
Naturally deficient Naturally deficient myostatin genemyostatin gene
Myostatinrsquos Obvious Effects
Genetically created deficient myostatin gene
(Knockout)
29
Myostatin and Humans
But not just cattle and But not just cattle and mice helliphellipmice helliphellip
30
Se-Jin Lee Annual Review Cell Dev Bio 2004
Inhibition of the Myostatin Inhibitor
31
Myostatin Signaling
32
Myostatin vs Other Established Muscle Metabolism Pathways
Mature Myocyte Myoblast
IGF1
PI3KAkt
FOXO
Ubiquitin-ProteasomePathway
(Atrogin-1 MuRF-1)
PROTEIN (eg MHC)DEGRADATION
mTOR
GSK3
eIF2B 4EBP1S6K
PROTEINSYNTHESIS
MyoDMEF2
CdK2 CdK inhibitors(p21)
PhosphoSMAD23
DifferentiationMyogenesis
+
-
PhosphoActRIIb
MYOSTATIN
33
Skeletal muscle wasting is prevalent in a variety of diseases
Weightlessness during space flight
Cancer cachexia
Muscular dystrophy
Geriatric sarcopenia
Obesitydiabetes
Skeletal muscle wasting results in reduced muscle strength disability and impaired quality of life
No current therapy to prevent or reverse muscle atrophy
Potential for Blocking Myostatin
34
Suspended at 30ordm for 14 days
Access to 100 of cage
Food and water ad libitum
12-h photoperiod
Disuse Models
Human bedrest (6ordm Head Down Tilt)
Durations - days to months Cardiovascular muscle and bone
effects Controlled diet
35
791090
2
4
6
8
10
12
14
16
US P TS P
So
leu
s W
et M
ass
(mg
)
Muscle Mass
Whole Animal Leg Strength
Hindlimb Suspension Effects
Isolated Muscle Strength
36
2200
2250
2300
2350
2400
2450
2500
2550
2600
2650
2700
0 2 4 6 8 10 12 14
Day of Study
Bo
dy
Mas
s (g
ram
s)
US D
US P
TS D
TS P
Body Mass
37
15
16
17
18
19
20
21
22
US P US D TS P TS D
Lea
n B
od
y M
ass
(g
)
0
asymp
Lean Body Mass
US gt TSPlt0001
D gt PPlt0001
38
Study Design
Subjects ndash 10 male volunteers 18-45 years old 10 day strict horizontal bed rest with restricted 5 day
lead in and 4 day follow up periods Controlled diet ndash 55 carb 30 fat 15 protein Caloric intake set to maintain body weight
39
RawImage
Partially ProcessedImage
Double Threshold Analysis
40
Quadriceps Size Change
50
60
70
80
90
Pre-Bed Rest End-Bed Rest
Mea
n C
SA
S
lice
(cm
2 )
-50
-10
-8
-6
-4
-2
0
Δ C
hang
e M
ean
CS
A (
)
p lt 0001
MRI images obtained with Tr = 550ms Te = 10ms Slice thickness = 1cm with 0 overlap Pre-BR and end-BR slices aligned on anatomical features Analysis from distal end of rectus femoris to highest portion of thigh excluding the
gluteus maximus
41
GDF8 vs Δ Muscle Size
Correlation found between absolute level of GDF8 expression pre-bed rest with change in muscle size
Correlations between Δ muscle size and Δ myostatin expression were not observed
-10
-8
-6
-4
-2
000 10 20 30 40
Pre-BR GDF8GAPDH
Δ Q
uads
Mea
n C
SA
(
)
r = - 066p lt 005
42
Summary of Muscle Feedback
Muscle Strength (PCSA)
IGF-1
ProteinDegradation
ExternalLoads Demands
Insulin
Protein Synthesis
Circulating IGF-1
Satellite CellActivation
+
Myostatin
MuscleHypertrophy
MuscleHyperplasia
+
Transduction Mechanical Electrical
--
-
-
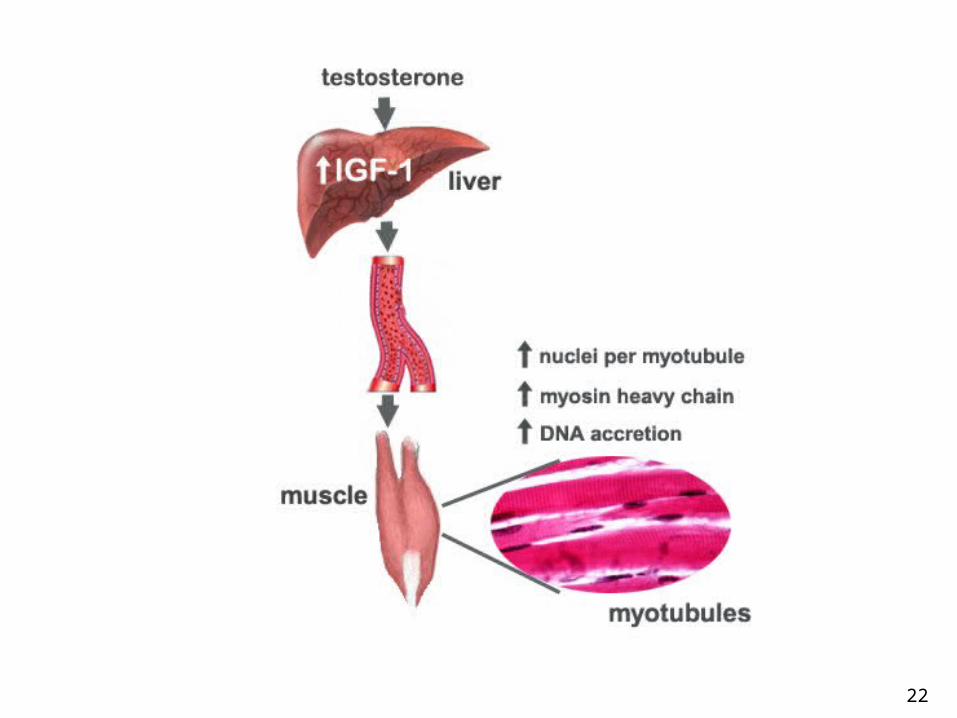
22
23
Tidball J Appl Phsyiol 2005
24
Haszele and Price Endocrinology 2004
25
Myostatin is a member of the TGF-b superfamily that regulates development and tissue homeostasis
Myostatin is expressed almost exclusively in skeletal muscle and acts as a negative regulator of muscle growth
Rodent models of experimental disease states show upregulated myostatin mRNA
Studies in humans show that a lack of functional myostatin results in increased muscle mass due to hyperplasia andor hypertrophy
Interest in Myostatin
26
Se-Jin Lee Annual Review Cell Dev Bio 2004
TGFβ Superfamily
27
Activation of Myostatin Pathway
Activation of Myostatin Pathway
Myostatin Pathway Blockade
Skeletal Muscle Growth Leanness
Muscle Wasting Cachexia Syndrome
Myostatin Effects
28
Naturally deficient Naturally deficient myostatin genemyostatin gene
Myostatinrsquos Obvious Effects
Genetically created deficient myostatin gene
(Knockout)
29
Myostatin and Humans
But not just cattle and But not just cattle and mice helliphellipmice helliphellip
30
Se-Jin Lee Annual Review Cell Dev Bio 2004
Inhibition of the Myostatin Inhibitor
31
Myostatin Signaling
32
Myostatin vs Other Established Muscle Metabolism Pathways
Mature Myocyte Myoblast
IGF1
PI3KAkt
FOXO
Ubiquitin-ProteasomePathway
(Atrogin-1 MuRF-1)
PROTEIN (eg MHC)DEGRADATION
mTOR
GSK3
eIF2B 4EBP1S6K
PROTEINSYNTHESIS
MyoDMEF2
CdK2 CdK inhibitors(p21)
PhosphoSMAD23
DifferentiationMyogenesis
+
-
PhosphoActRIIb
MYOSTATIN
33
Skeletal muscle wasting is prevalent in a variety of diseases
Weightlessness during space flight
Cancer cachexia
Muscular dystrophy
Geriatric sarcopenia
Obesitydiabetes
Skeletal muscle wasting results in reduced muscle strength disability and impaired quality of life
No current therapy to prevent or reverse muscle atrophy
Potential for Blocking Myostatin
34
Suspended at 30ordm for 14 days
Access to 100 of cage
Food and water ad libitum
12-h photoperiod
Disuse Models
Human bedrest (6ordm Head Down Tilt)
Durations - days to months Cardiovascular muscle and bone
effects Controlled diet
35
791090
2
4
6
8
10
12
14
16
US P TS P
So
leu
s W
et M
ass
(mg
)
Muscle Mass
Whole Animal Leg Strength
Hindlimb Suspension Effects
Isolated Muscle Strength
36
2200
2250
2300
2350
2400
2450
2500
2550
2600
2650
2700
0 2 4 6 8 10 12 14
Day of Study
Bo
dy
Mas
s (g
ram
s)
US D
US P
TS D
TS P
Body Mass
37
15
16
17
18
19
20
21
22
US P US D TS P TS D
Lea
n B
od
y M
ass
(g
)
0
asymp
Lean Body Mass
US gt TSPlt0001
D gt PPlt0001
38
Study Design
Subjects ndash 10 male volunteers 18-45 years old 10 day strict horizontal bed rest with restricted 5 day
lead in and 4 day follow up periods Controlled diet ndash 55 carb 30 fat 15 protein Caloric intake set to maintain body weight
39
RawImage
Partially ProcessedImage
Double Threshold Analysis
40
Quadriceps Size Change
50
60
70
80
90
Pre-Bed Rest End-Bed Rest
Mea
n C
SA
S
lice
(cm
2 )
-50
-10
-8
-6
-4
-2
0
Δ C
hang
e M
ean
CS
A (
)
p lt 0001
MRI images obtained with Tr = 550ms Te = 10ms Slice thickness = 1cm with 0 overlap Pre-BR and end-BR slices aligned on anatomical features Analysis from distal end of rectus femoris to highest portion of thigh excluding the
gluteus maximus
41
GDF8 vs Δ Muscle Size
Correlation found between absolute level of GDF8 expression pre-bed rest with change in muscle size
Correlations between Δ muscle size and Δ myostatin expression were not observed
-10
-8
-6
-4
-2
000 10 20 30 40
Pre-BR GDF8GAPDH
Δ Q
uads
Mea
n C
SA
(
)
r = - 066p lt 005
42
Summary of Muscle Feedback
Muscle Strength (PCSA)
IGF-1
ProteinDegradation
ExternalLoads Demands
Insulin
Protein Synthesis
Circulating IGF-1
Satellite CellActivation
+
Myostatin
MuscleHypertrophy
MuscleHyperplasia
+
Transduction Mechanical Electrical
--
-
-
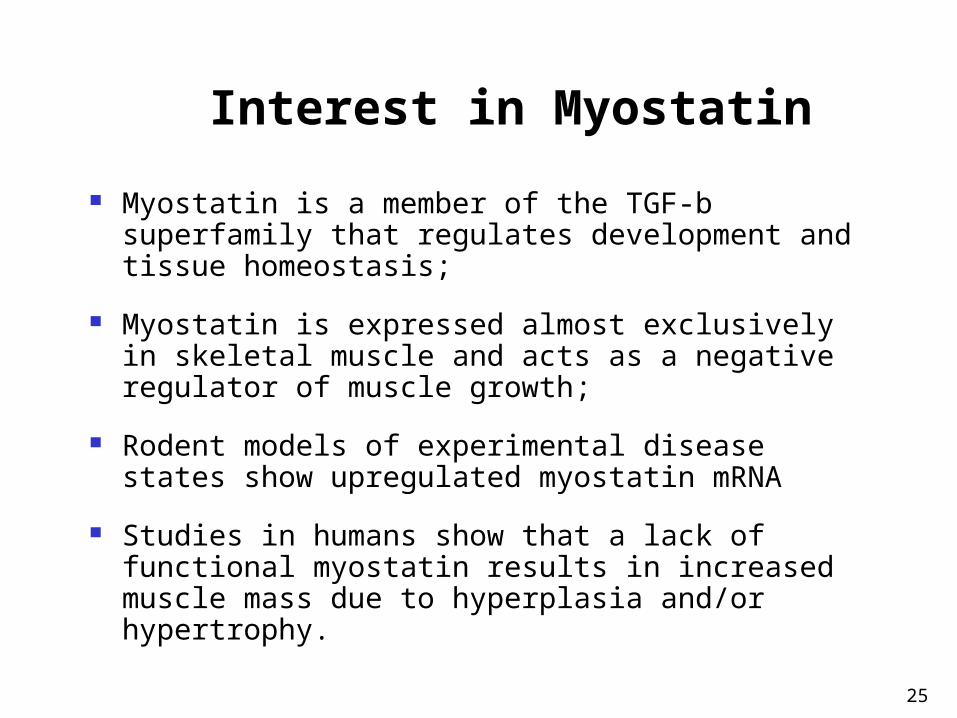
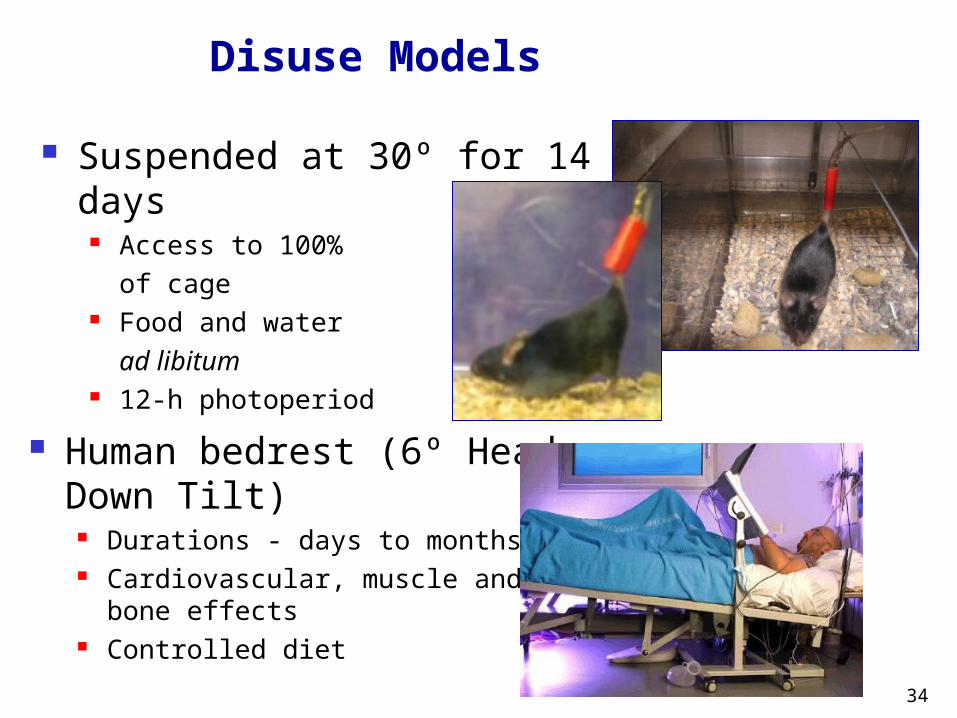

42
Summary of Muscle Feedback
Muscle Strength (PCSA)
IGF-1
ProteinDegradation
ExternalLoads Demands
Insulin
Protein Synthesis
Circulating IGF-1
Satellite CellActivation
+
Myostatin
MuscleHypertrophy
MuscleHyperplasia
+
Transduction Mechanical Electrical
--
-
-


![[Cancer-associated cachexia] clean for authors](https://img.pdfslide.net/doc/110x75/61d1ee79118df22edc52f710/cancer-associated-cachexia-clean-for-authors.jpg)