Embed Size (px)
Citation preview
1
NATS 101 - 06Lecture 2
Density, Pressure & Temperature
Climate and Weather
2
Two Important Concepts
Let’s introduce two new concepts...
Density
Pressure
3
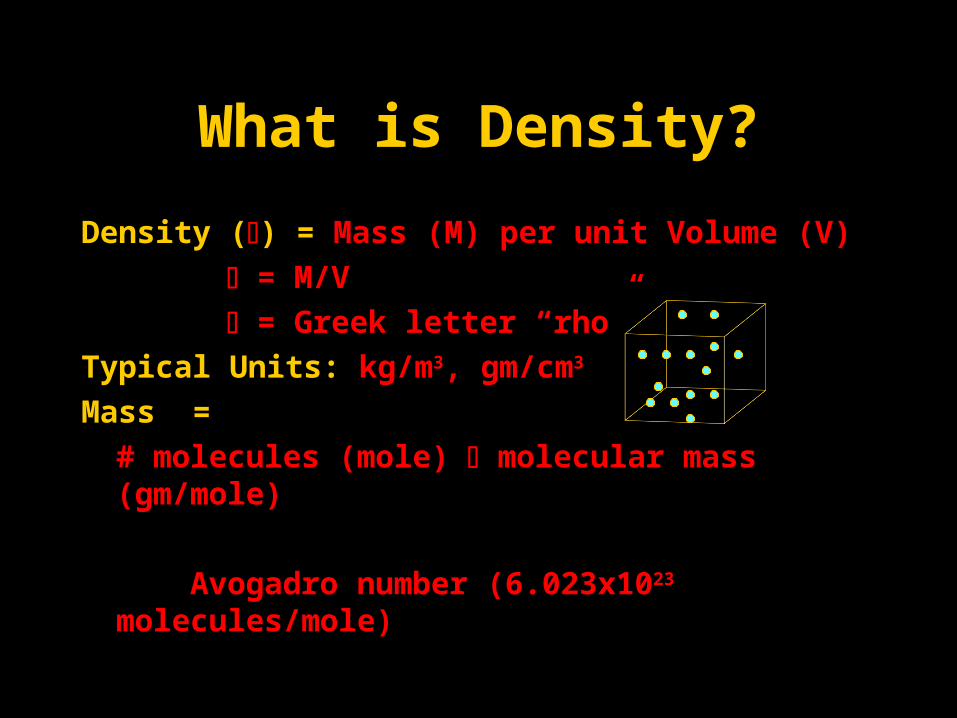
What is Density?
Density () = Mass (M) per unit Volume (V)
= M/V
= Greek letter “rho”
Typical Units: kg/m3, gm/cm3
Mass =
# molecules (mole) molecular mass (gm/mole)
Avogadro number (6.023x10²³ molecules/mole)
4
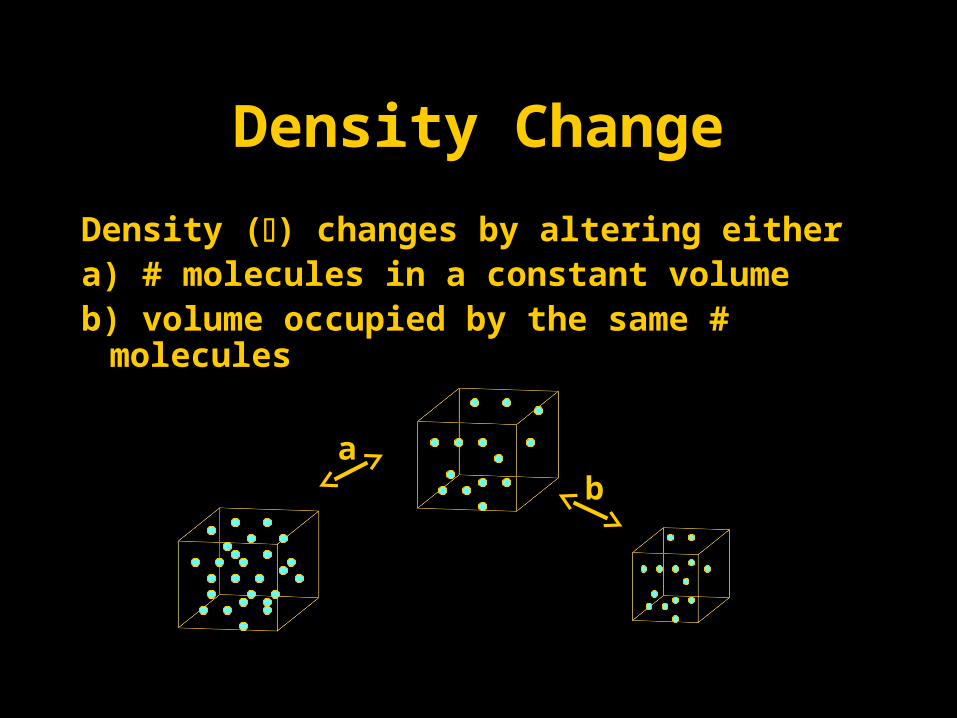
Density Change
Density () changes by altering eithera) # molecules in a constant volumeb) volume occupied by the same # molecules
ab
5
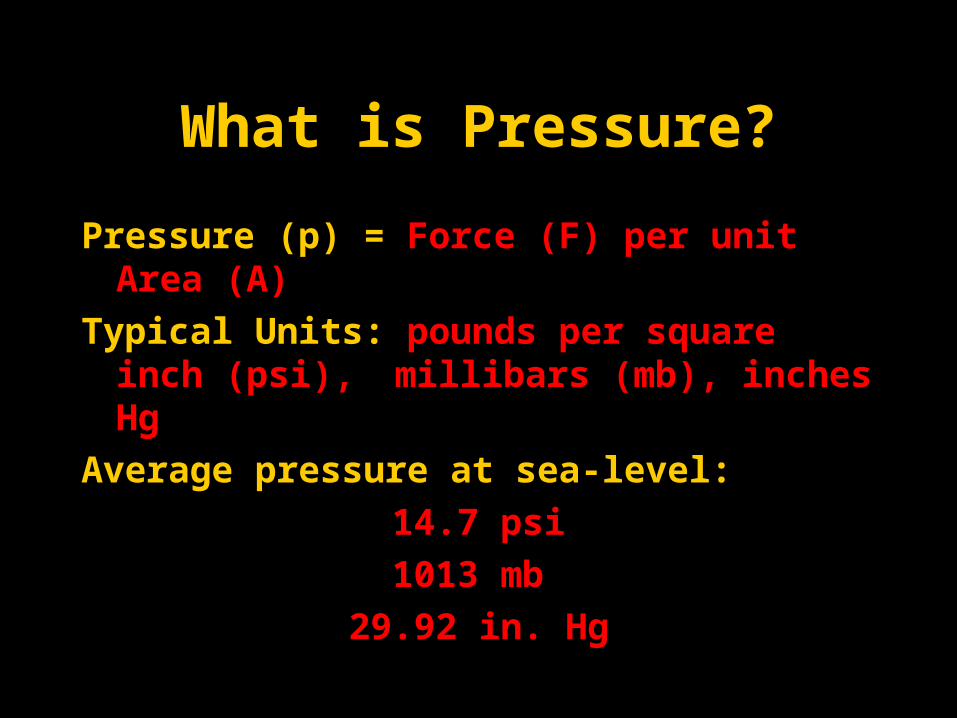
What is Pressure?
Pressure (p) = Force (F) per unit Area (A)
Typical Units: pounds per square inch (psi), millibars (mb), inches
Hg
Average pressure at sea-level:
14.7 psi
1013 mb
29.92 in. Hg
6
Pressure
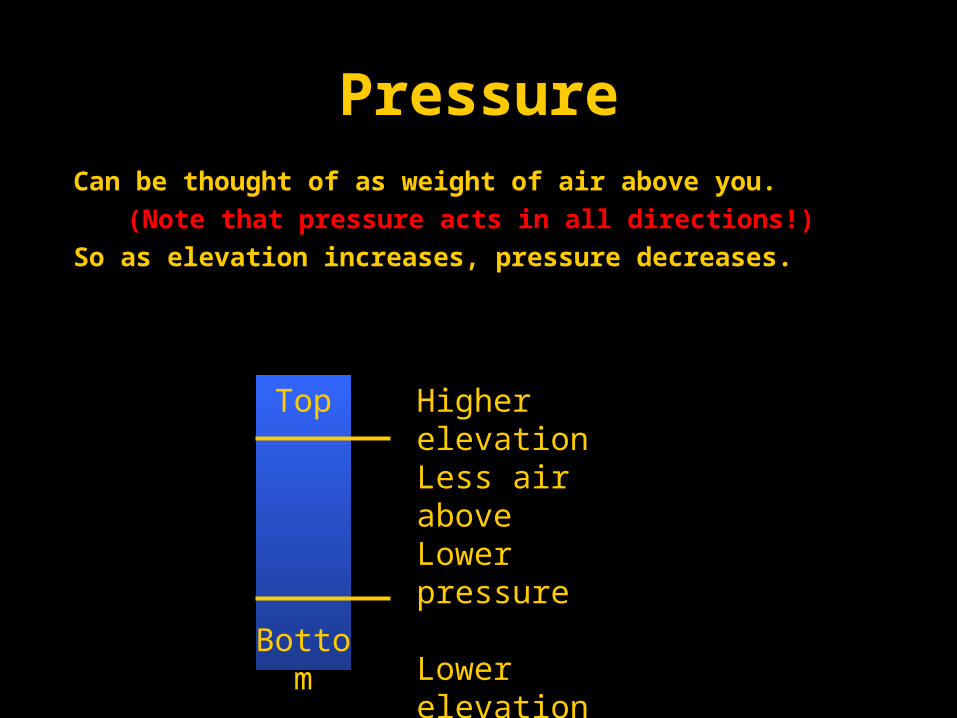
Can be thought of as weight of air above you.
(Note that pressure acts in all directions!)
So as elevation increases, pressure decreases.
Higher elevation Less air aboveLower pressure
Lower elevation More air above Higher pressureBottom
Top
7
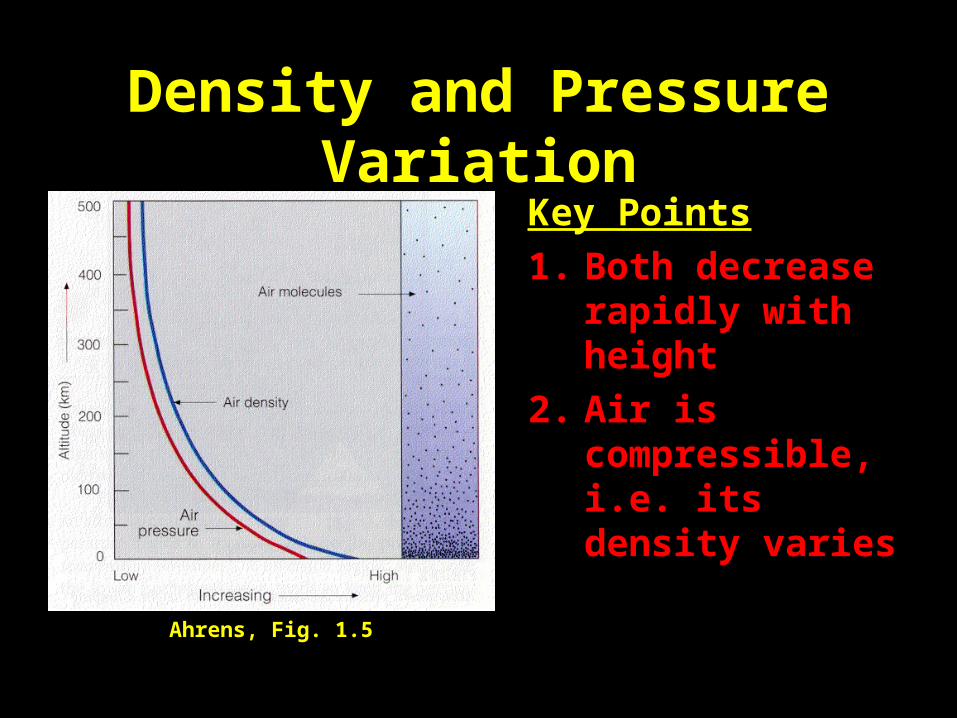
Density and Pressure VariationKey Points
1. Both decrease rapidly with height
2. Air is compressible, i.e. its density varies
Ahrens, Fig. 1.5
8
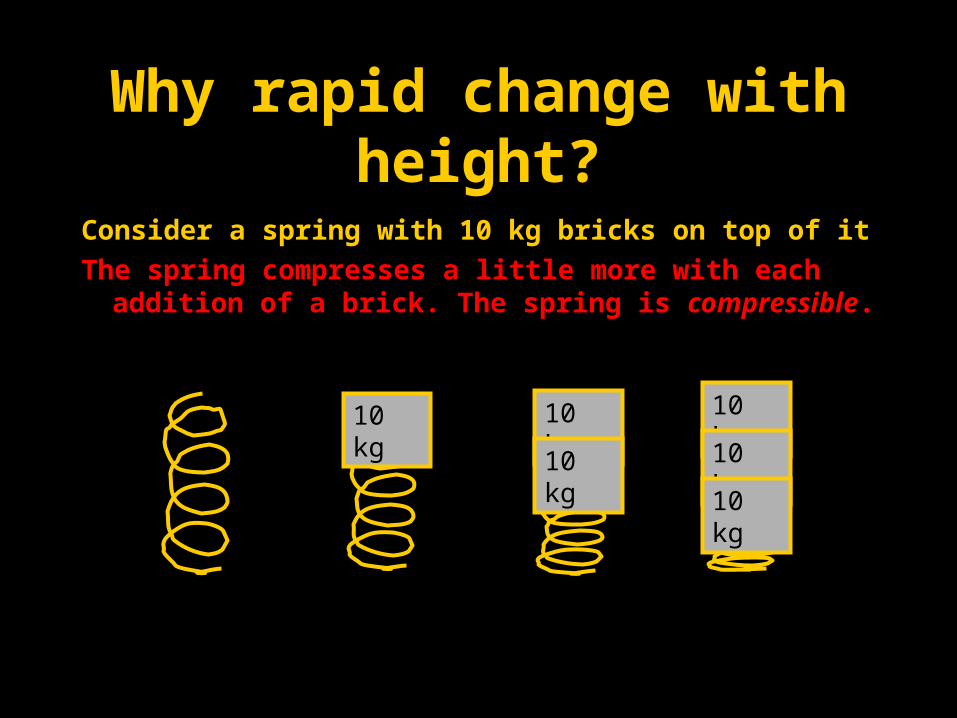
Why rapid change with height?
Consider a spring with 10 kg bricks on top of it
The spring compresses a little more with each addition of a brick. The spring is compressiblecompressible.
10 kg 10 kg
10 kg
10 kg
10 kg
10 kg
9
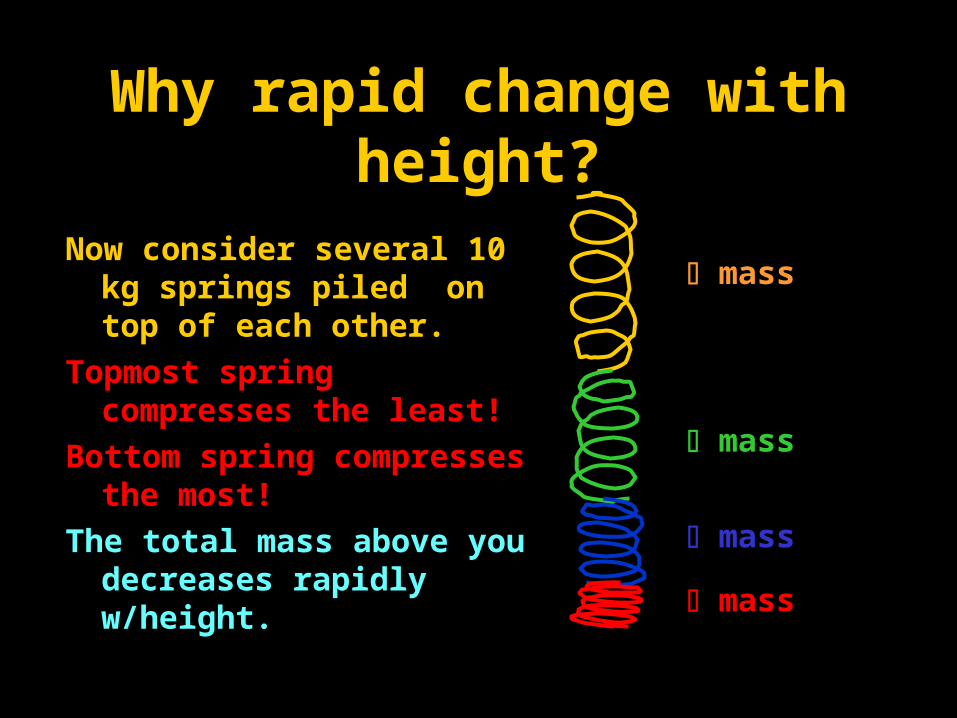
Why rapid change with height?
Now consider several 10 kg springs piled on top of each other.
Topmost spring compresses the least!
Bottom spring compresses the most!
The total mass above you decreases rapidly w/height.
massmass
massmass
massmass
massmass
10
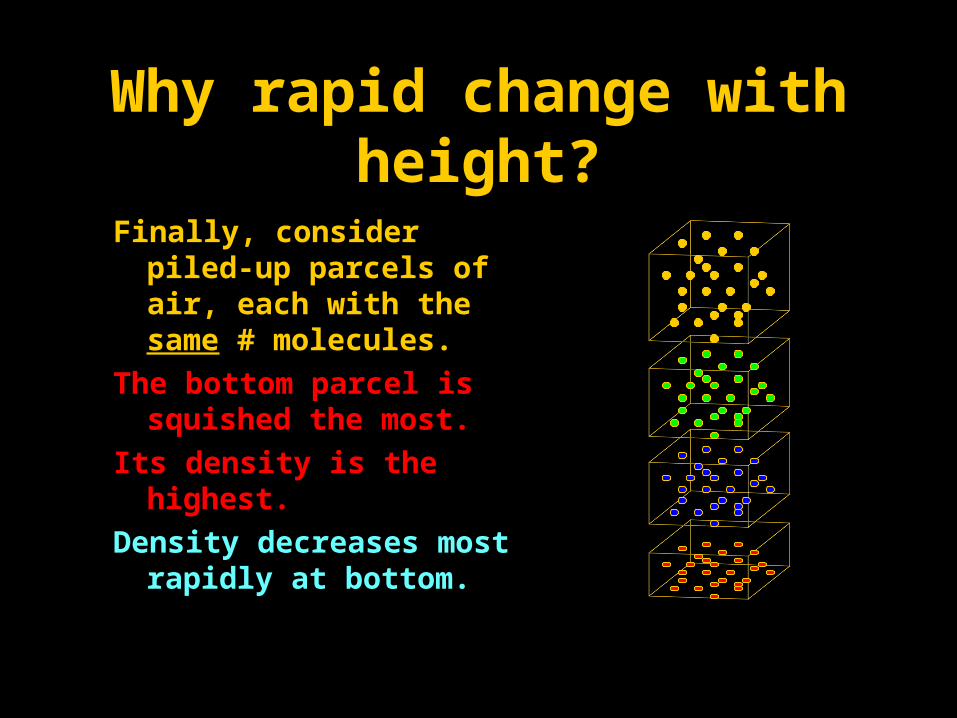
Why rapid change with height?
Finally, consider piled-up parcels of air, each with the same # molecules.
The bottom parcel is squished the most.
Its density is the highest.
Density decreases most rapidly at bottom.
11
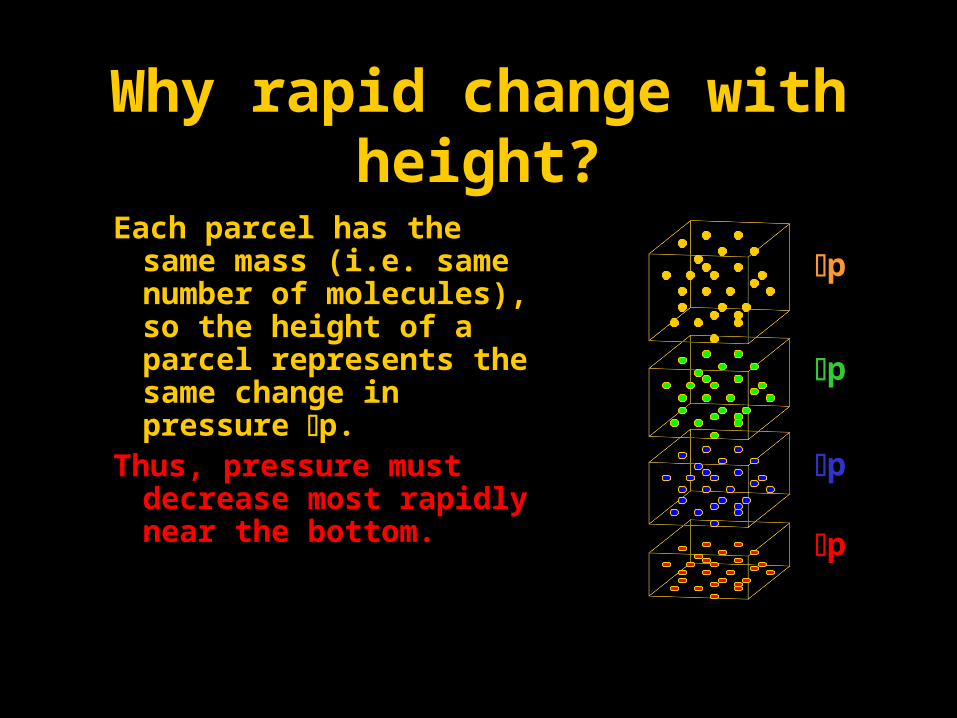
Why rapid change with height?
Each parcel has the same mass (i.e. same number of molecules), so the height of a parcel represents the same change in pressure p.
Thus, pressure must decrease most rapidly near the bottom. pp
pp
pp
pp
12
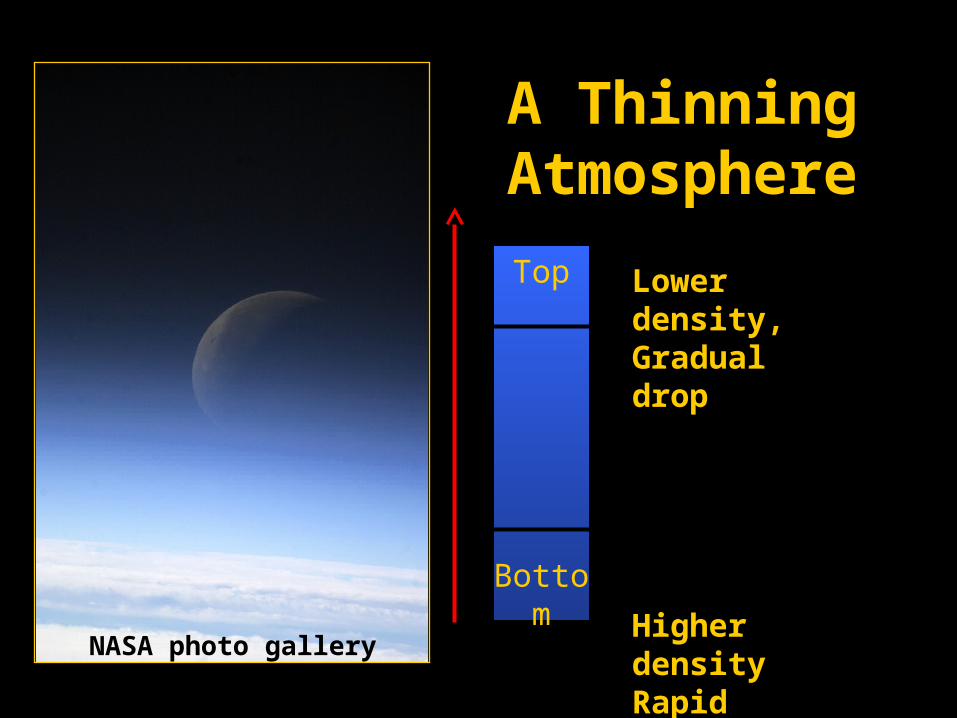
A Thinning Atmosphere
Bottom
Top Lower density, Gradual drop
Higher densityRapid decrease
NASA photo gallery
13
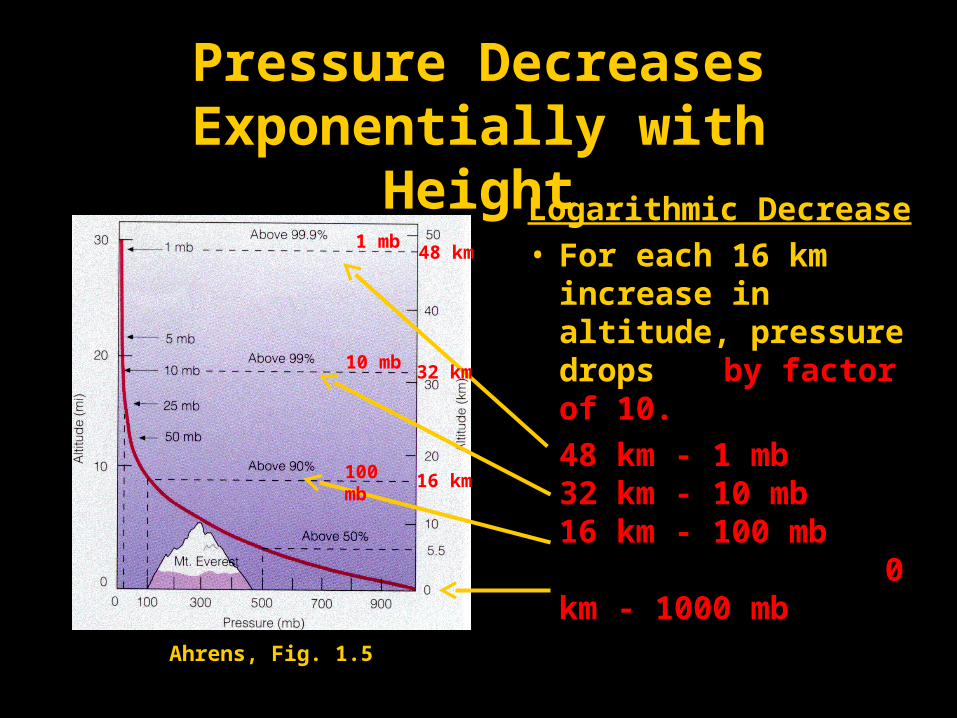
Pressure Decreases Exponentially with Height
Logarithmic Decrease• For each 16 km
increase in altitude, pressure drops
by factor of 10.
48 km - 1 mb 32 km - 10 mb 16 km - 100 mb 0 km - 1000 mb
100 mb
10 mb
1 mb
16 km
32 km
48 km
Ahrens, Fig. 1.5
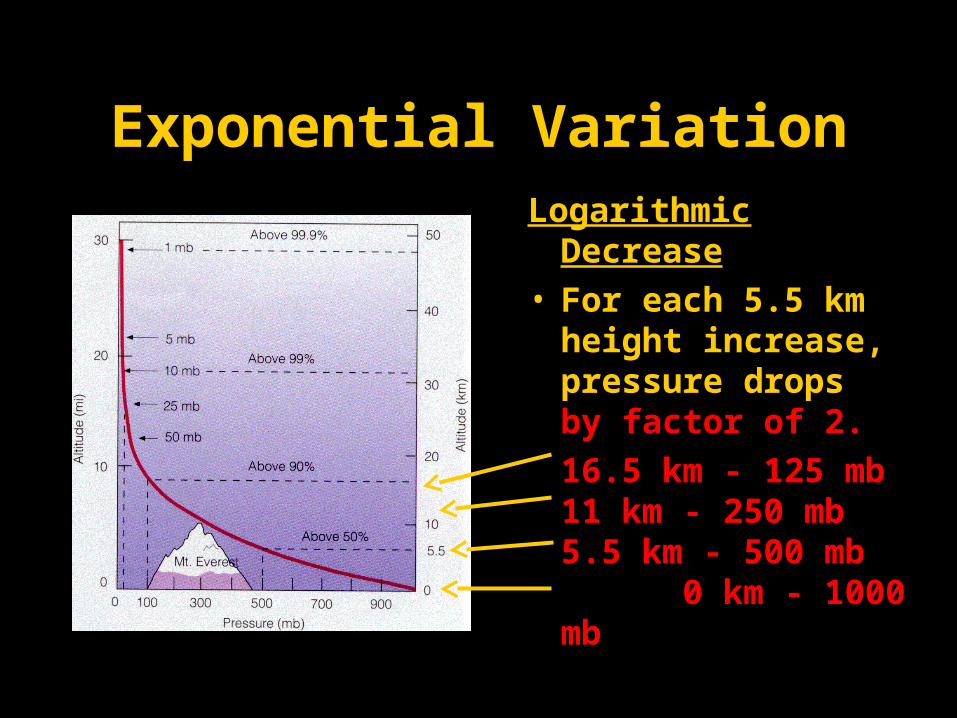
14
Exponential VariationLogarithmic Decrease• For each 5.5 km height
increase, pressure drops by factor of 2.
16.5 km - 125 mb 11 km - 250 mb 5.5 km - 500 mb 0 km - 1000 mb
15
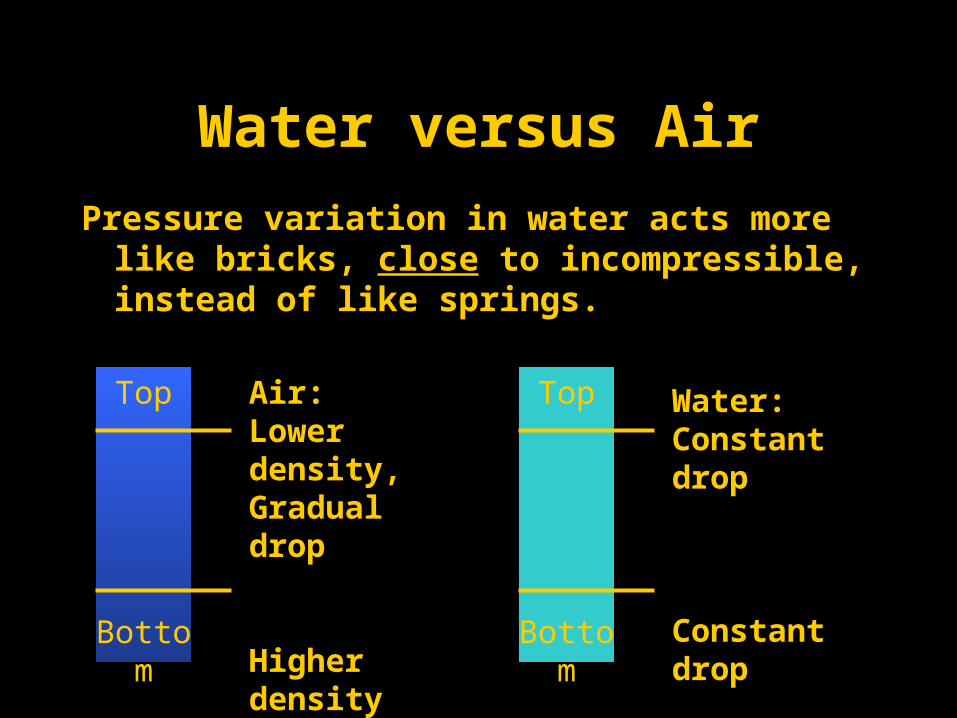
Water versus Air
Pressure variation in water acts more like bricks, close to incompressible, instead of like springs.
Air:Lower density, Gradual drop
Higher densityRapid decrease Bottom
Top
Bottom
Top Water:Constant drop
Constant drop
16
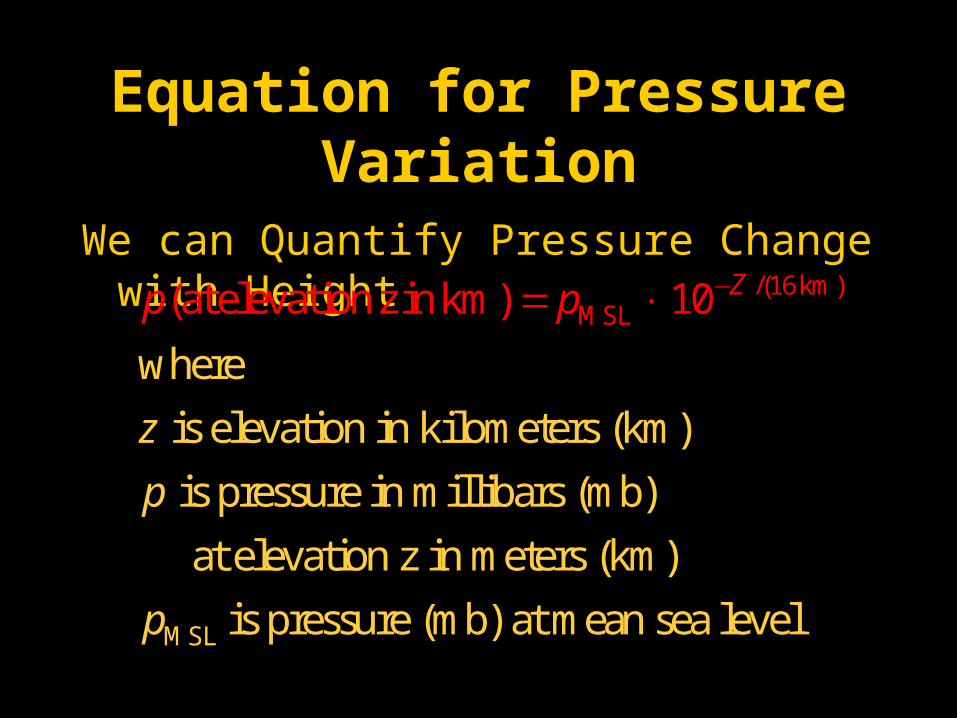
Equation for Pressure Variation
We can Quantify Pressure Change with Height /(16km)
MSL
MSL
where
is elevation in kilometers (km)
is pressure in millibars (mb)
at elevation z in meters (km)
is pre
(at elevation zin km)
ssure (mb
1
) at mean sea l
0
leve
Z
z
p
p
p
p −= ×
17
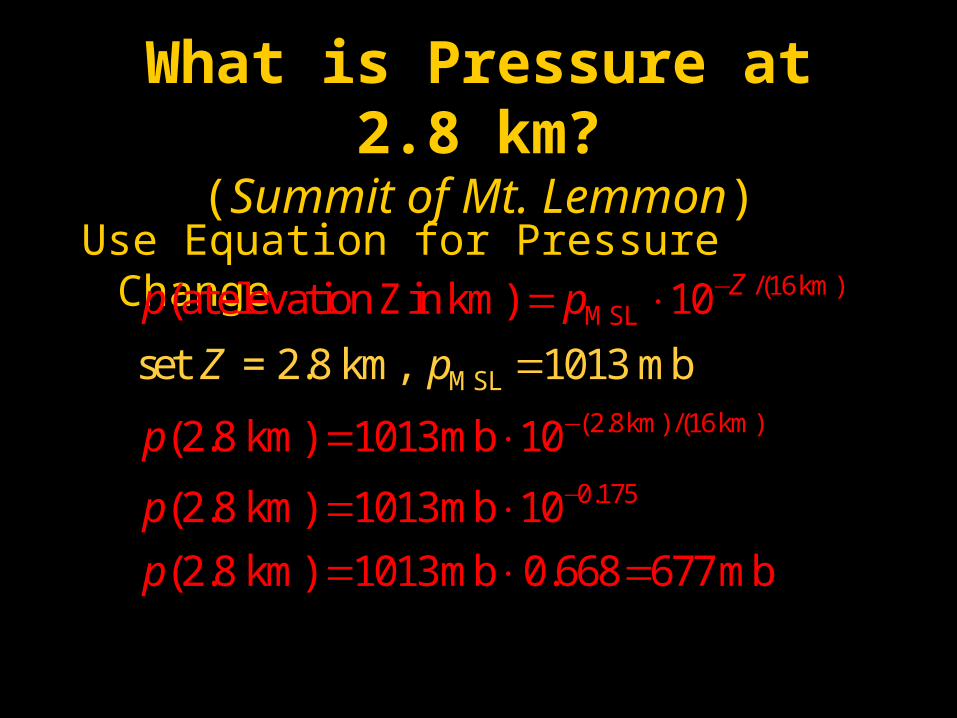
What is Pressure at 2.8 km?(Summit of Mt. Lemmon)
Use Equation for Pressure Change/(16 km)
MSL
(2.8km) /(16 km)
0.175
MSL
(at elevation Zin km) 10
(2.8 km) 1013mb 10
(2.8 km) 1013mb
set = 2.8 km, 10
10
(2.8 km) 1013mb 0.668 677mb
13 mb
Zp p
p
p
p
Z
p
−
−
−
= ×
= ×
= ×= × =
=
18
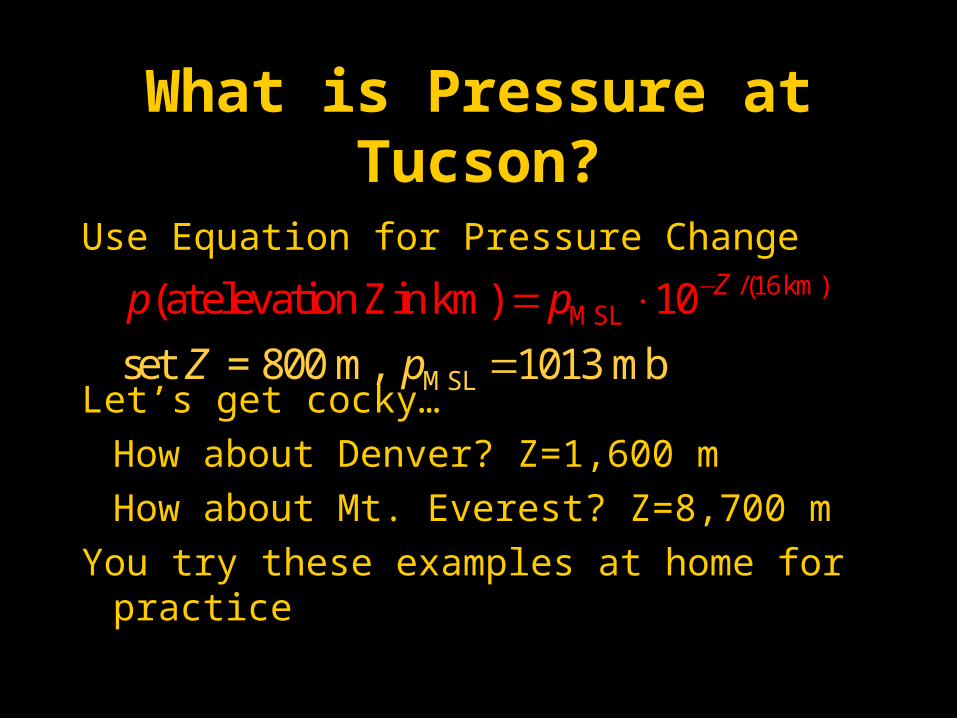
What is Pressure at Tucson?
Use Equation for Pressure Change
Let’s get cocky…
How about Denver? Z=1,600 m
How about Mt. Everest? Z=8,700 m
You try these examples at home for practice
/(16km)M
MS
S
L
L(at e
set =
levation Zin
800 m
km) 10
, 1013 mb
Z
Z p
p p −= ×=
19
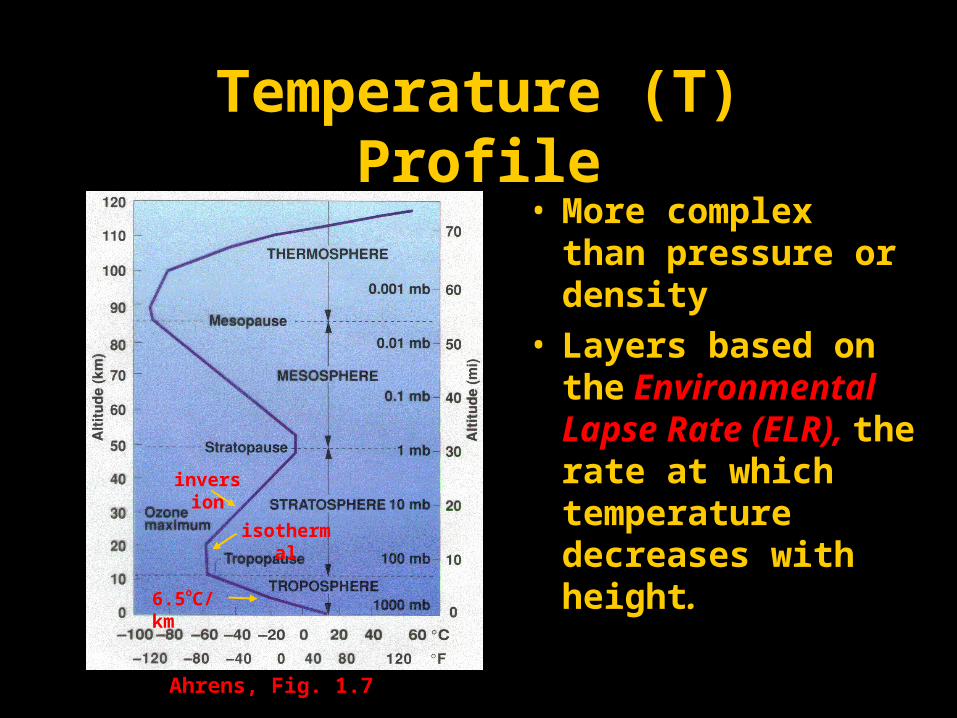
Temperature (T) Profile• More complex than
pressure or density • Layers based on the
Environmental Lapse Rate (ELR), the rate at which temperature decreases with height. inversion
isothermal
6.5oC/km
Ahrens, Fig. 1.7
20
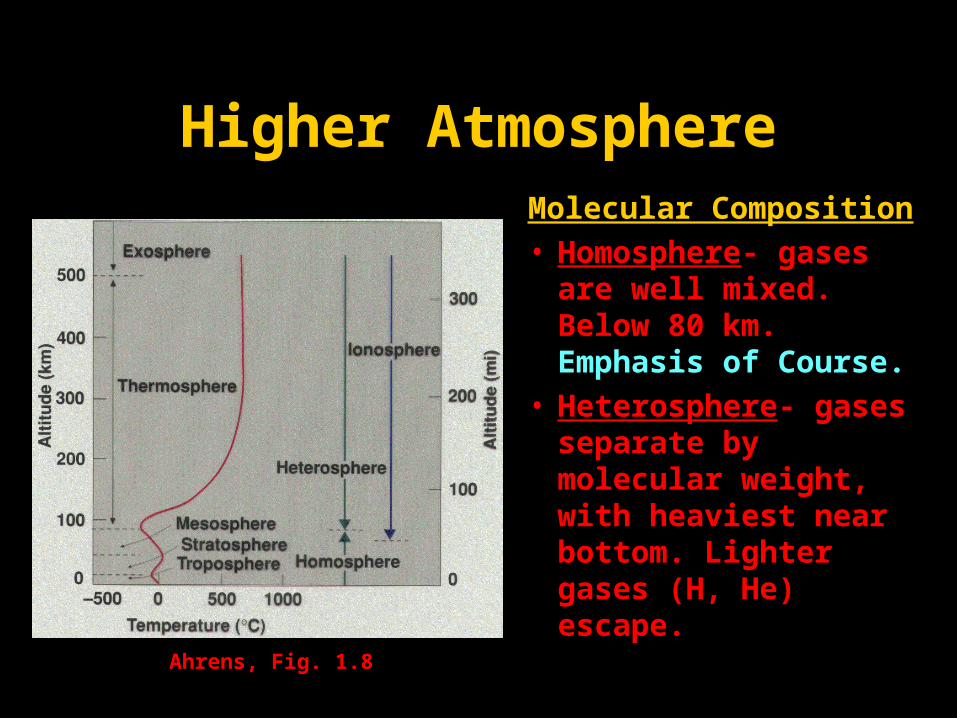
Higher AtmosphereMolecular Composition• Homosphere- gases
are well mixed. Below 80 km. Emphasis of Course.
• Heterosphere- gases separate by molecular weight, with heaviest near bottom. Lighter gases (H, He) escape.
Ahrens, Fig. 1.8
21
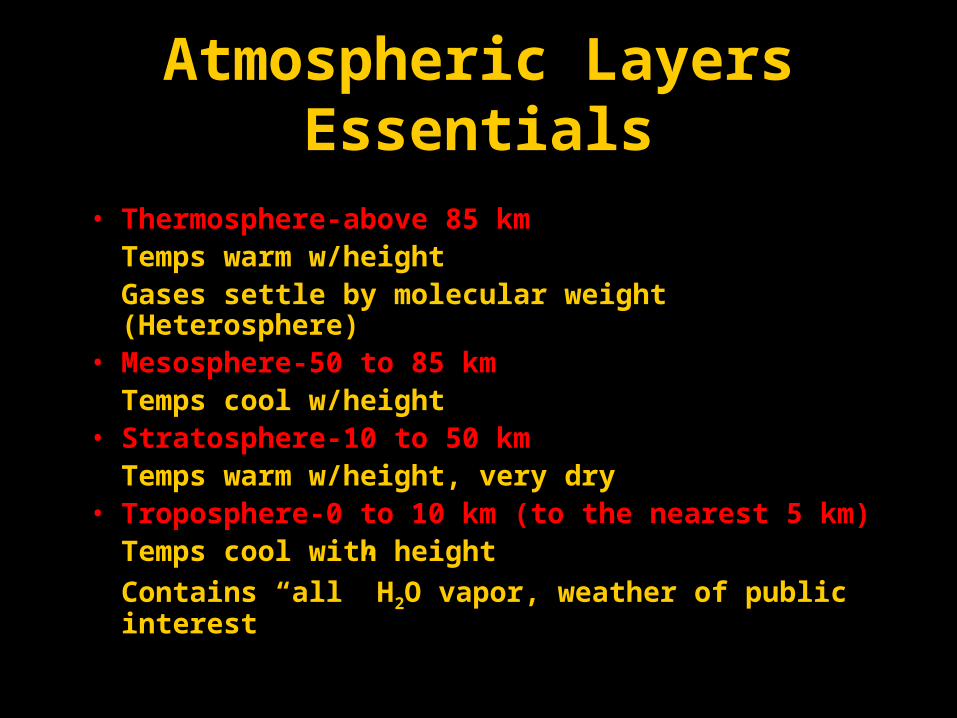
Atmospheric Layers Essentials
• Thermosphere-above 85 kmTemps warm w/height Gases settle by molecular weight (Heterosphere)
• Mesosphere-50 to 85 km Temps cool w/height
• Stratosphere-10 to 50 km Temps warm w/height, very dry
• Troposphere-0 to 10 km (to the nearest 5 km)Temps cool with height
Contains “all” H2O vapor, weather of public interest
22
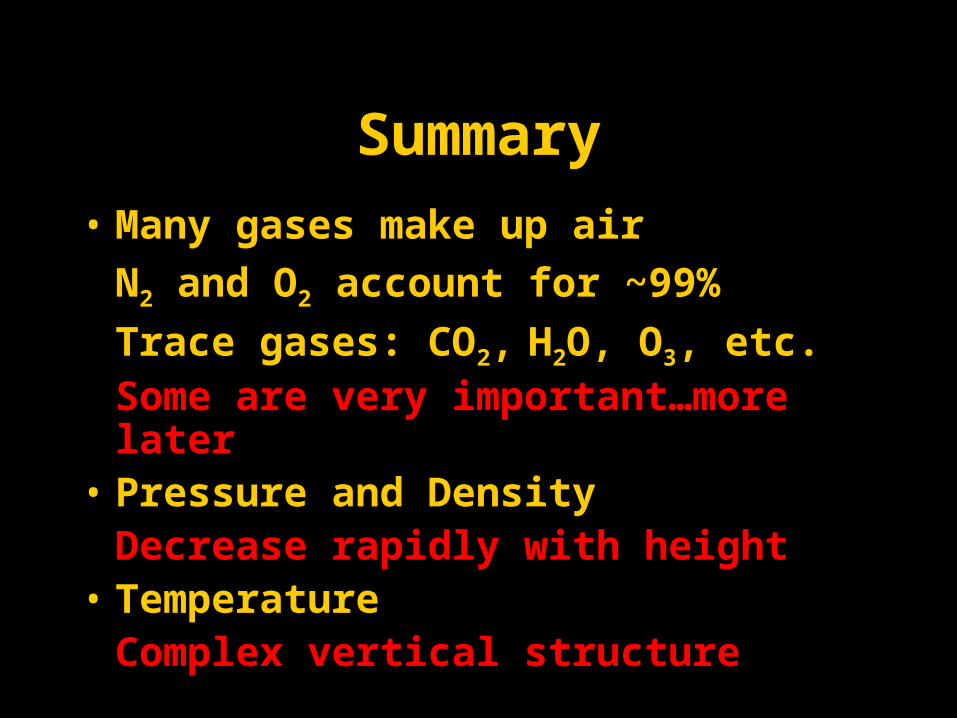
Summary
• Many gases make up air
N2 and O2 account for ~99%
Trace gases: CO2, H2O, O3, etc.Some are very important…more
later• Pressure and Density
Decrease rapidly with height• Temperature
Complex vertical structure
23
Climate and Weather
“Climate is what you expect.
Weather is what you get.”-Robert A. Heinlein
24
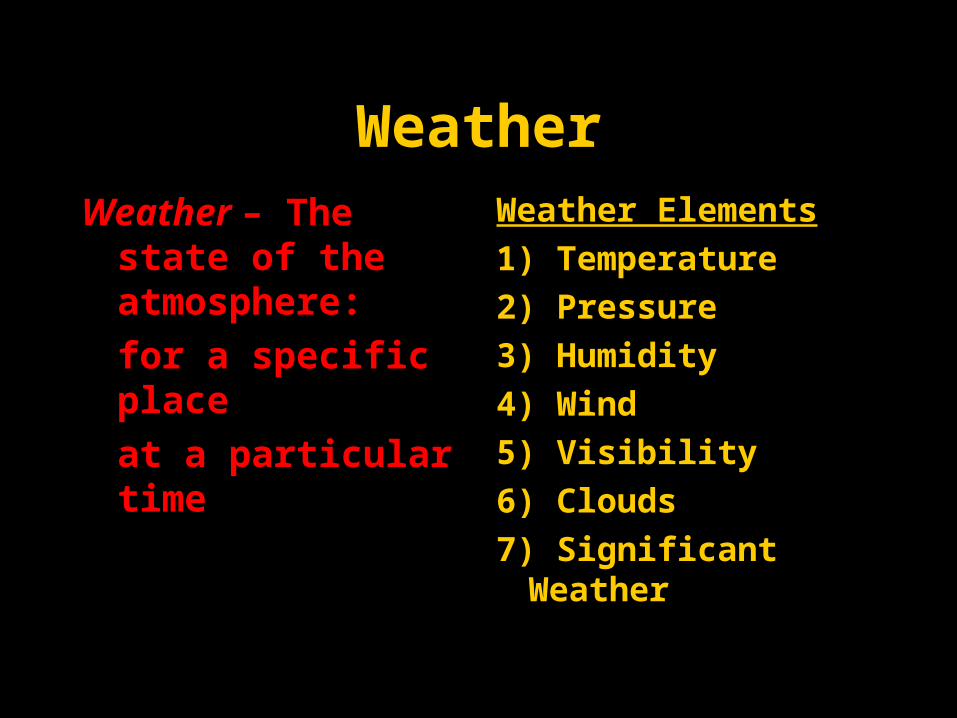
WeatherWeather – The state of
the atmosphere:
for a specific place
at a particular time
Weather Elements
1) Temperature
2) Pressure
3) Humidity
4) Wind
5) Visibility
6) Clouds
7) Significant Weather
25
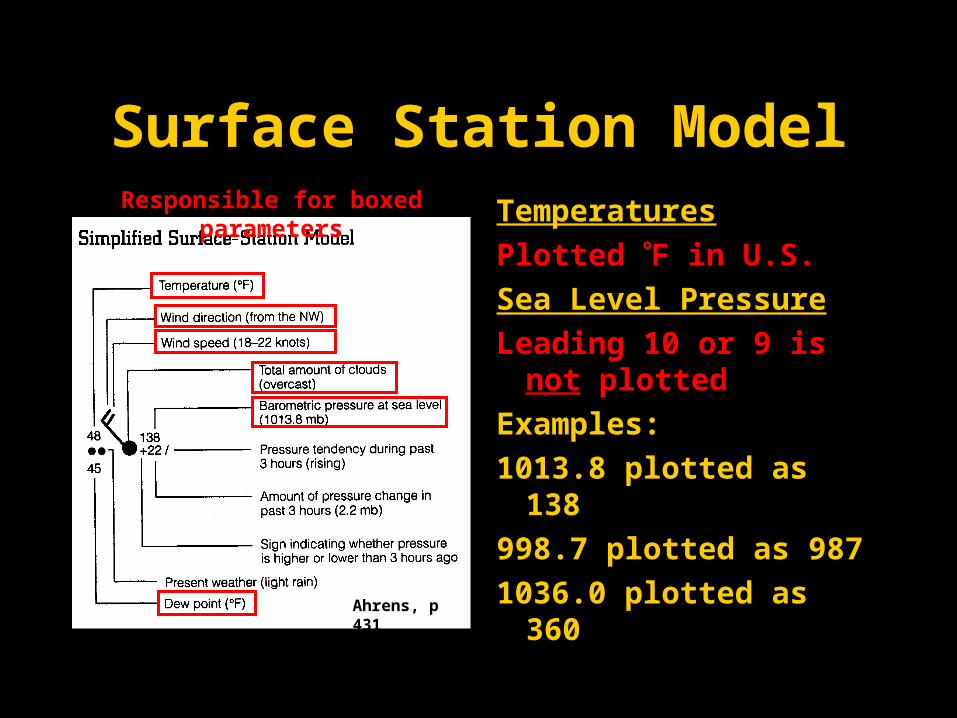
Surface Station Model
Temperatures
Plotted F in U.S.
Sea Level Pressure
Leading 10 or 9 is not plotted
Examples:
1013.8 plotted as 138
998.7 plotted as 987
1036.0 plotted as 360Ahrens, p 431
Responsible for boxed parameters
26
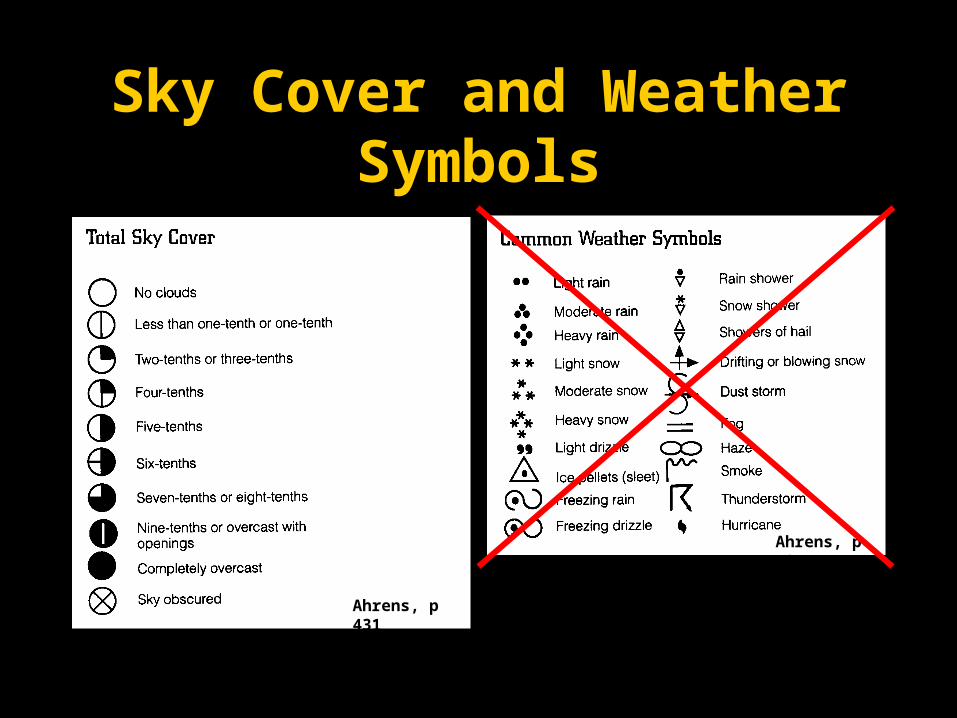
Sky Cover and Weather Symbols
Ahrens, p 431
Ahrens, p 431
28
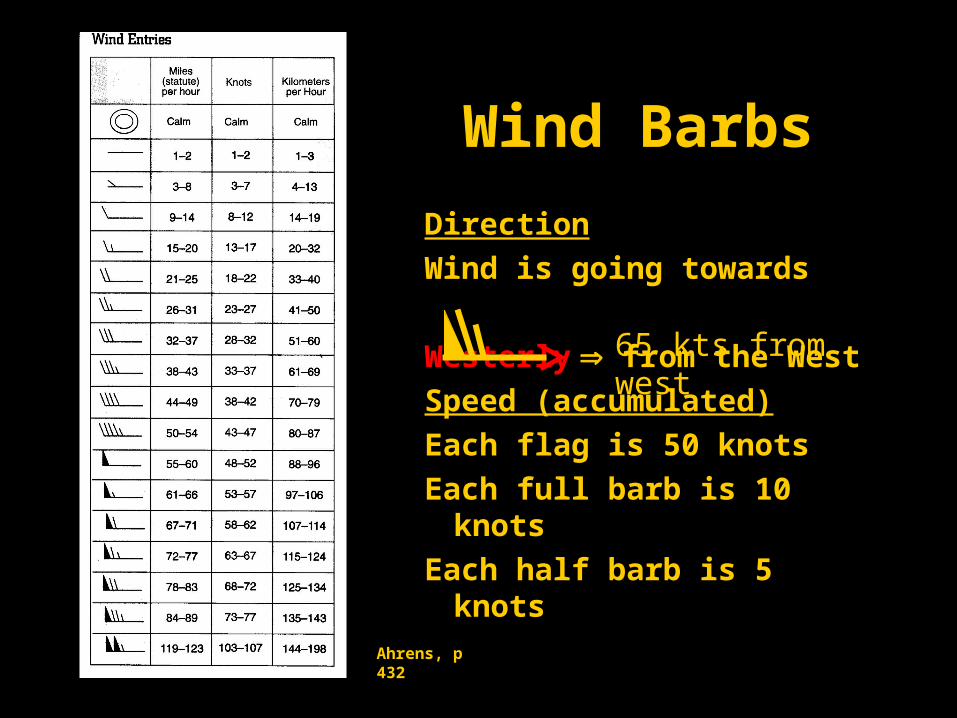
Wind Barbs
Direction
Wind is going towards
WesterlyWesterly from the West
Speed (accumulated)
Each flag is 50 knots
Each full barb is 10 knots
Each half barb is 5 knotsAhrens, p 432
65 kts from west
29
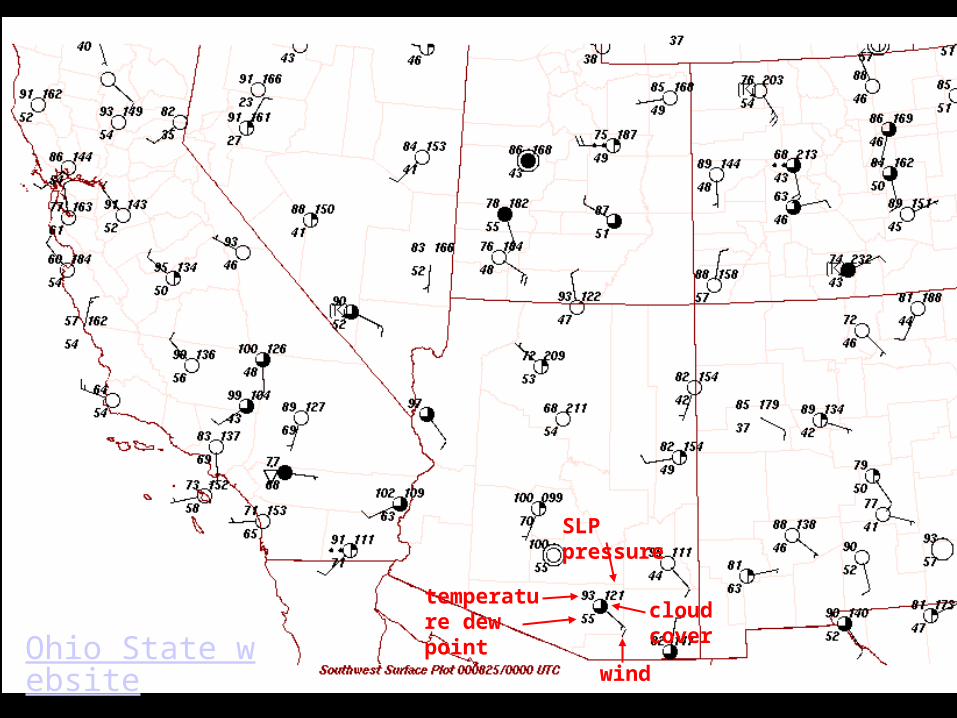
temperature dew point
SLP pressure
wind
cloud cover
Ohio State website
30
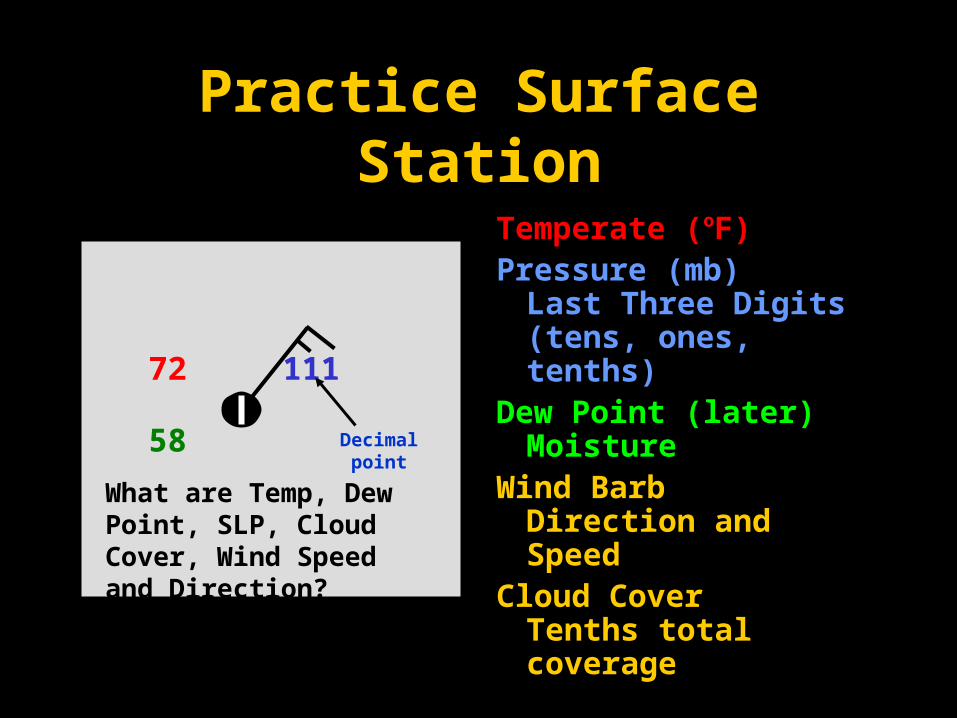
Practice Surface Station
Temperate (oF)Pressure (mb) Last
Three Digits (tens, ones, tenths)
Dew Point (later) Moisture
Wind Barb Direction and Speed
Cloud Cover Tenths total coverage
Ahrens, p 431
72
58
111
Decimal point
What are Temp, Dew Point, SLP, Cloud Cover, Wind Speed and Direction?
31
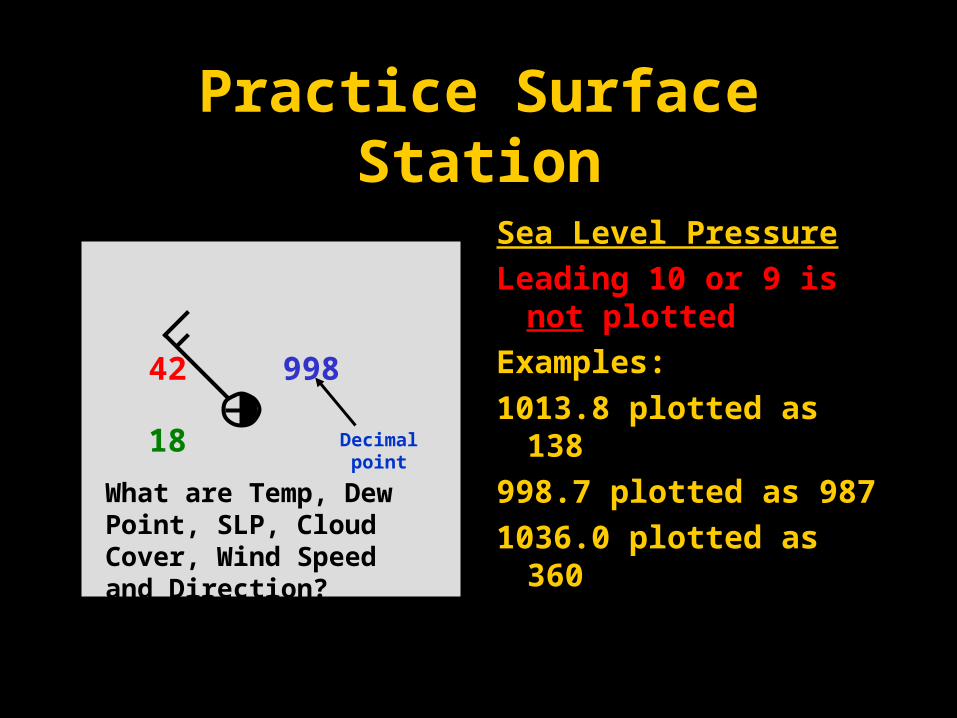
Practice Surface Station
Sea Level Pressure
Leading 10 or 9 is not plotted
Examples:
1013.8 plotted as 138
998.7 plotted as 987
1036.0 plotted as 360Ahrens, p 431
42
18
998
Decimal point
What are Temp, Dew Point, SLP, Cloud Cover, Wind Speed and Direction?
32
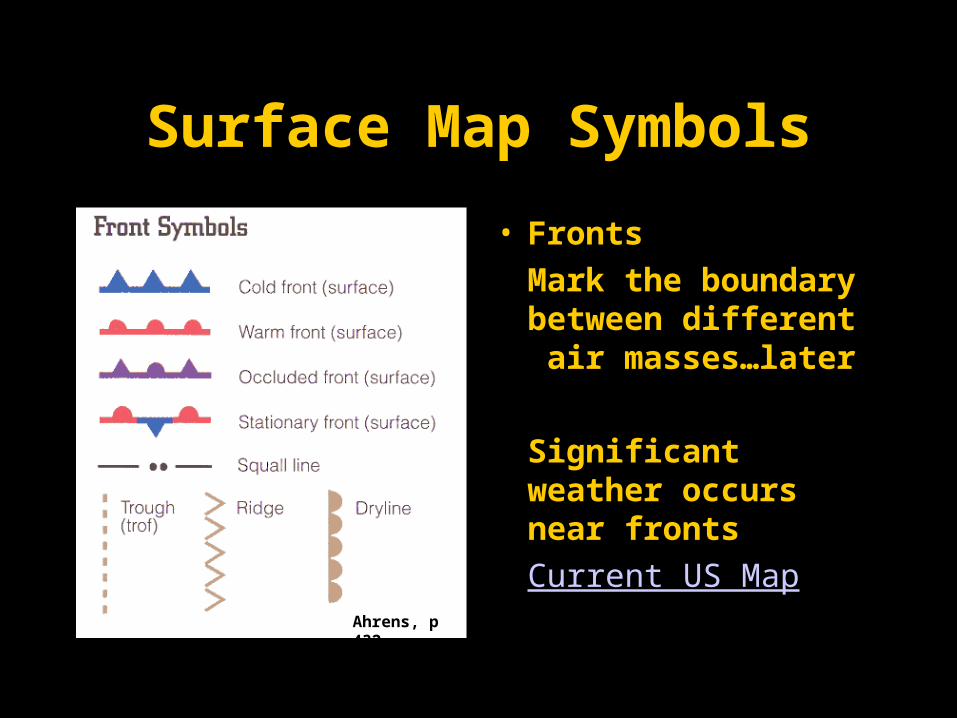
Surface Map Symbols
• Fronts
Mark the boundary between different air masses…later
Significant weather occurs near fronts
Current US MapAhrens, p 432
33
35
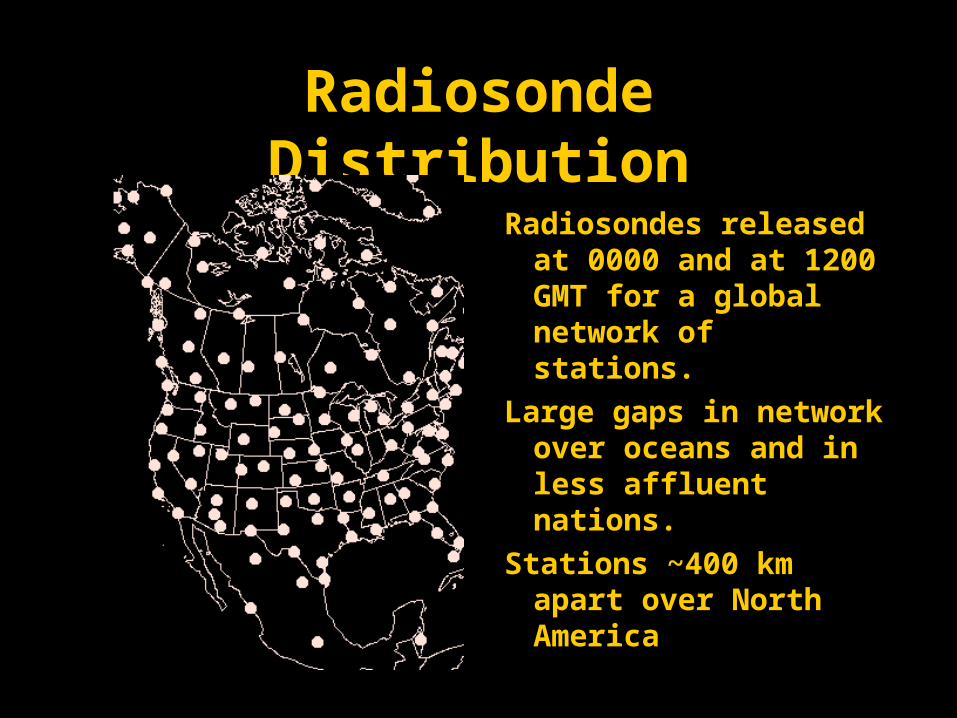
Radiosonde Distribution
Radiosondes released at 0000 and at 1200 GMT for a global network of stations.
Large gaps in network over oceans and in less affluent nations.
Stations ~400 km apart over North America
36
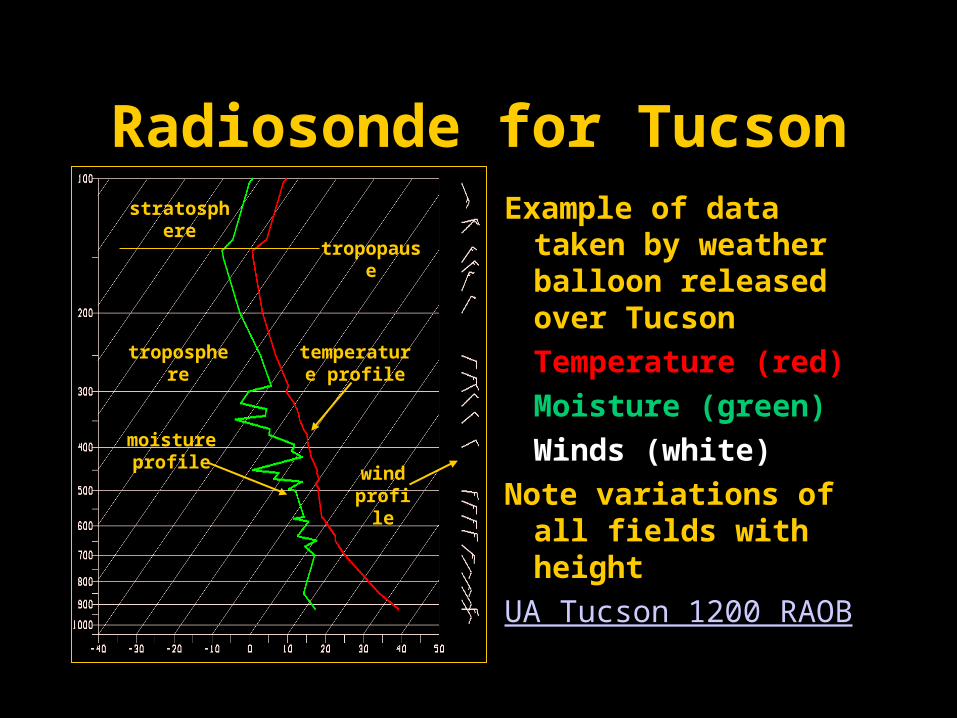
Radiosonde for TucsonExample of data taken
by weather balloon released over Tucson
Temperature (red)
Moisture (green)
Winds (white)
Note variations of all fields with height
UA Tucson 1200 RAOB
troposphere
stratosphere
tropopause
temperature profile
moisture profile
wind profile
39
Climate
Climate - Average weather and range of weather, computed over many years.
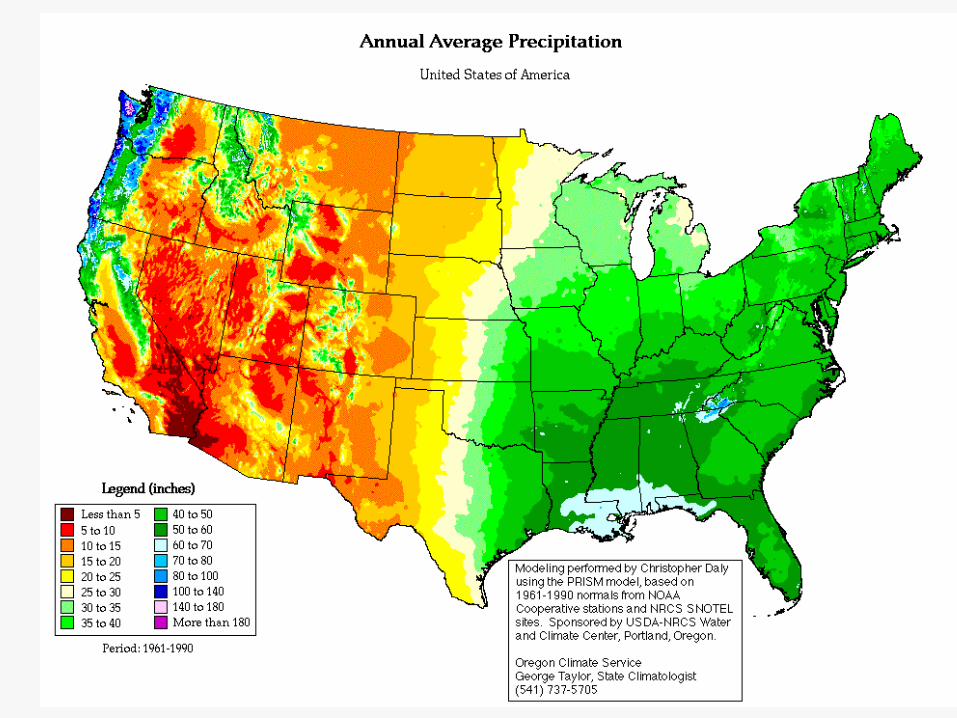
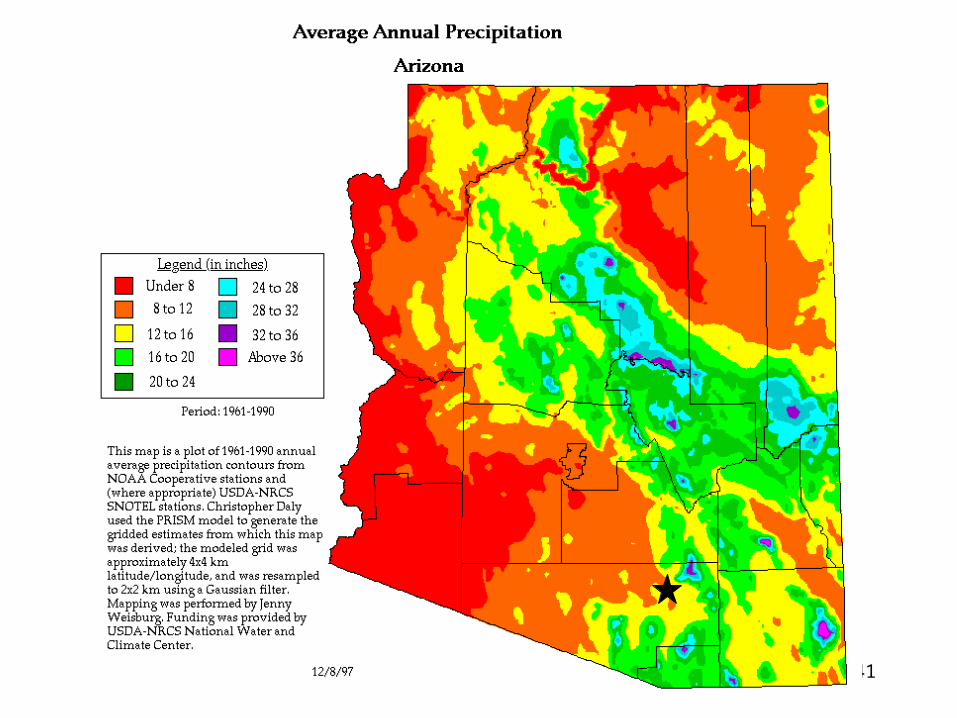
Whole year (mean annual precipitation for Tucson, 1970-present)
Season (Winter: Dec-Jan-Feb)
Month (January rainfall in Tucson)
Date (Average, record high and low temperatures for Jan 1 in Tucson)
40
41
42
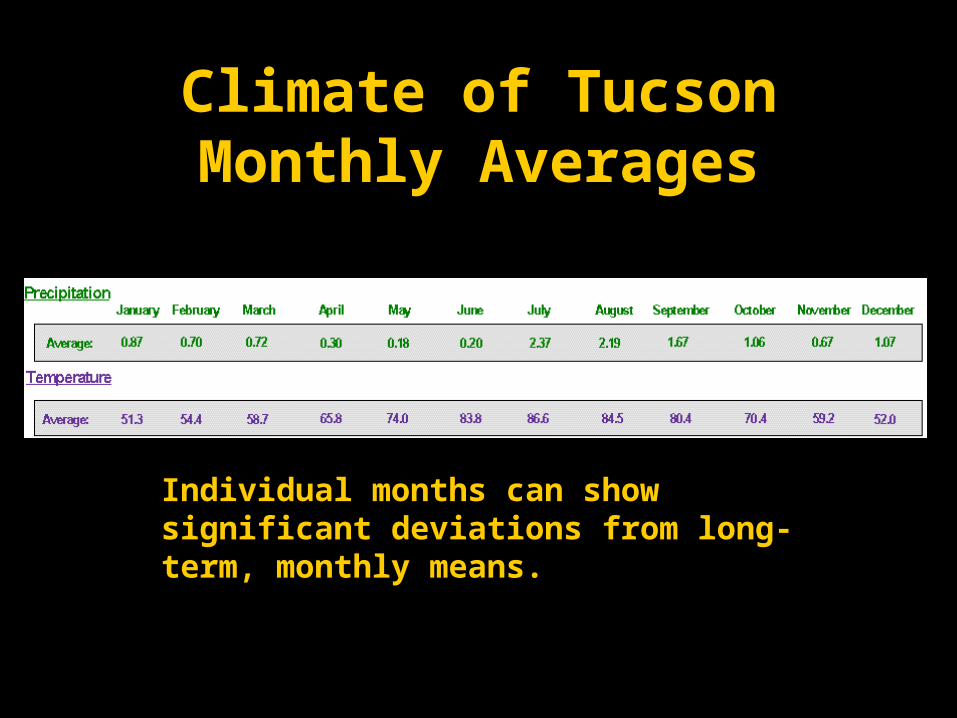
Climate of TucsonMonthly Averages
Individual months can show significant deviations from long-term, monthly means.
43
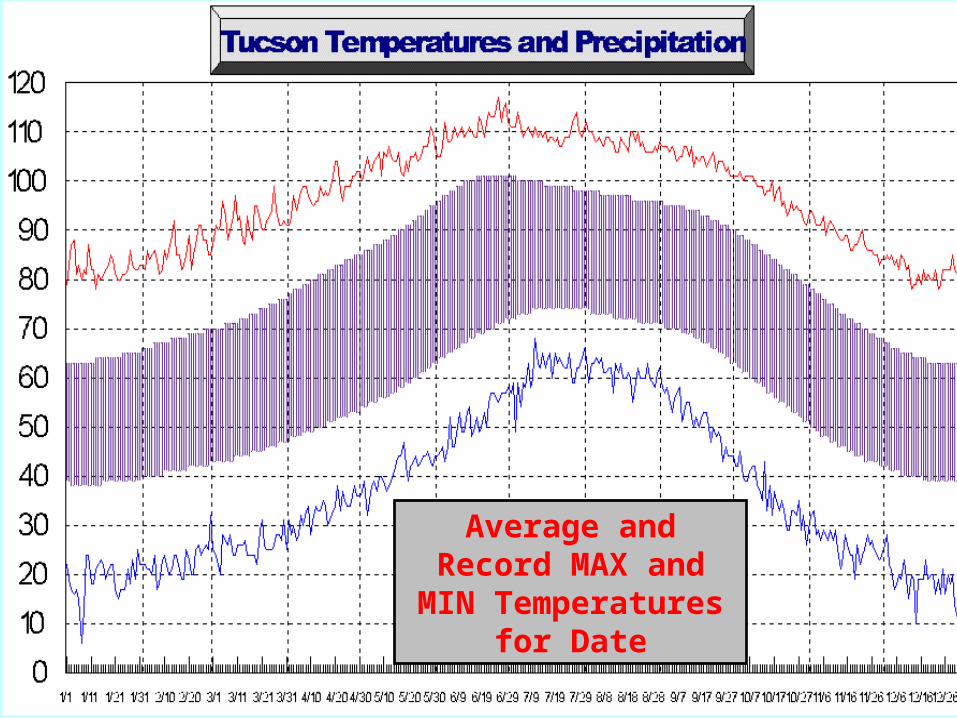
Average and Record MAX and MIN
Temperatures for Date
44
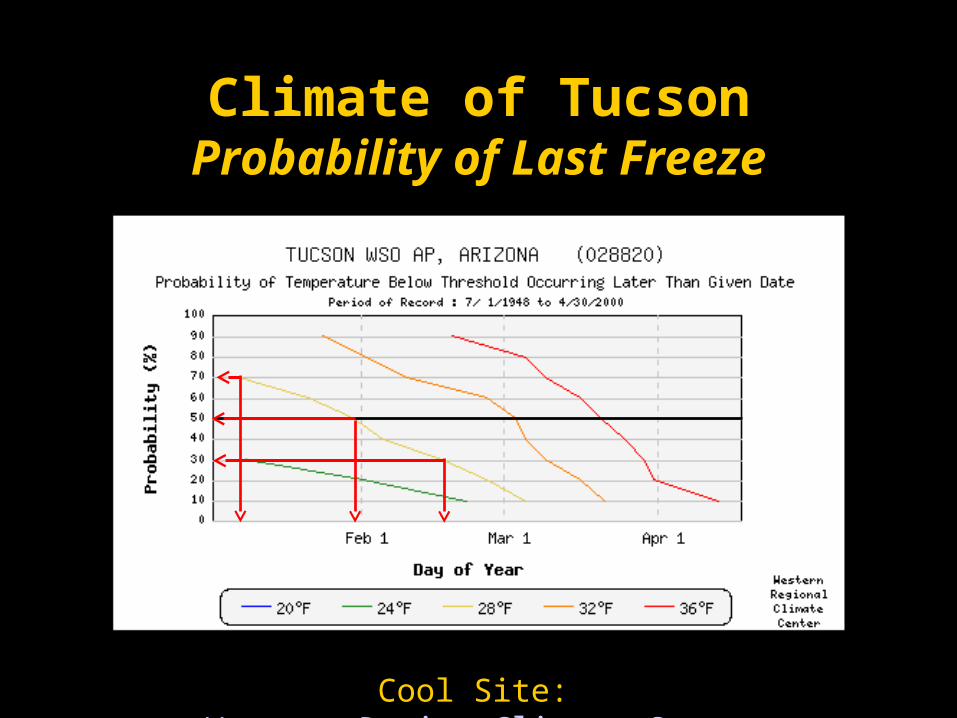
Climate of TucsonProbability of Last Freeze
Cool Site: Western Region Climate Center
45
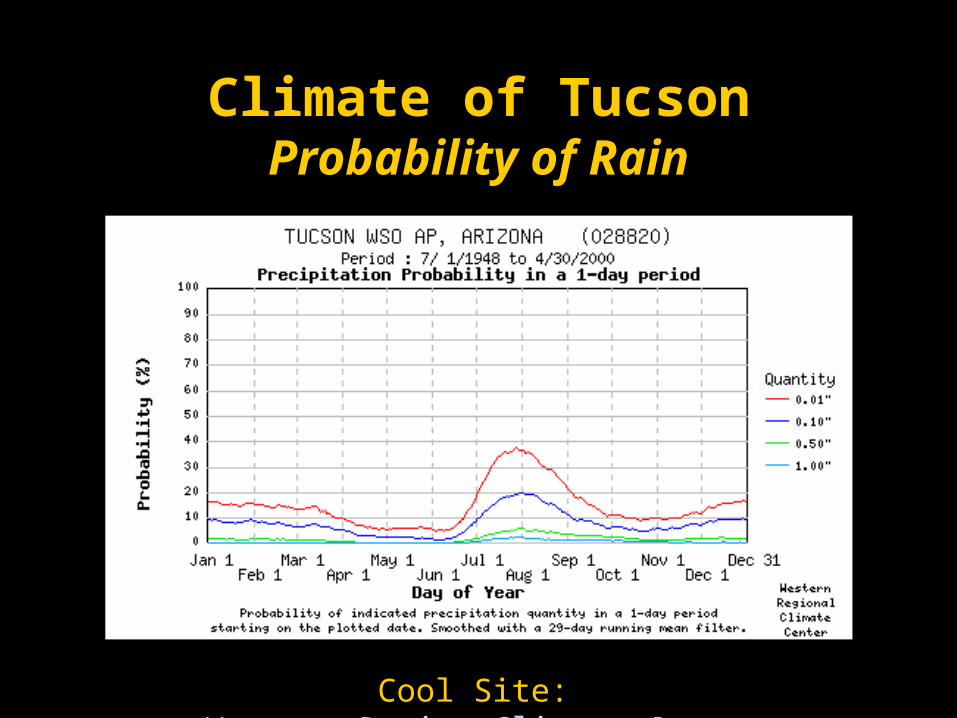
Climate of TucsonProbability of Rain
Cool Site: Western Region Climate Center
46
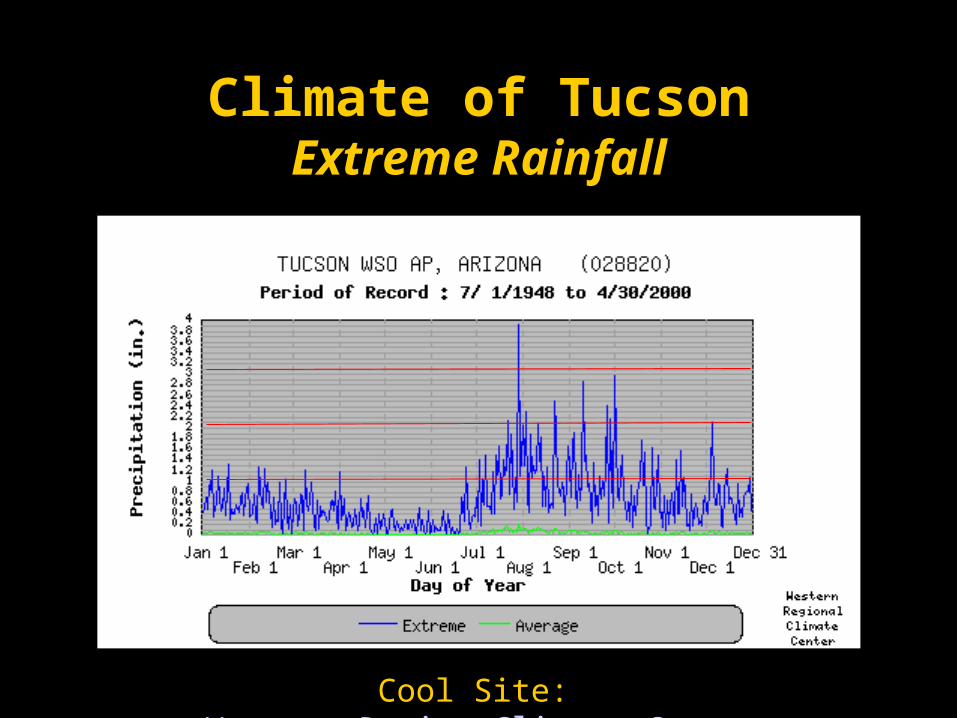
Climate of TucsonExtreme Rainfall
Cool Site: Western Region Climate Center
47
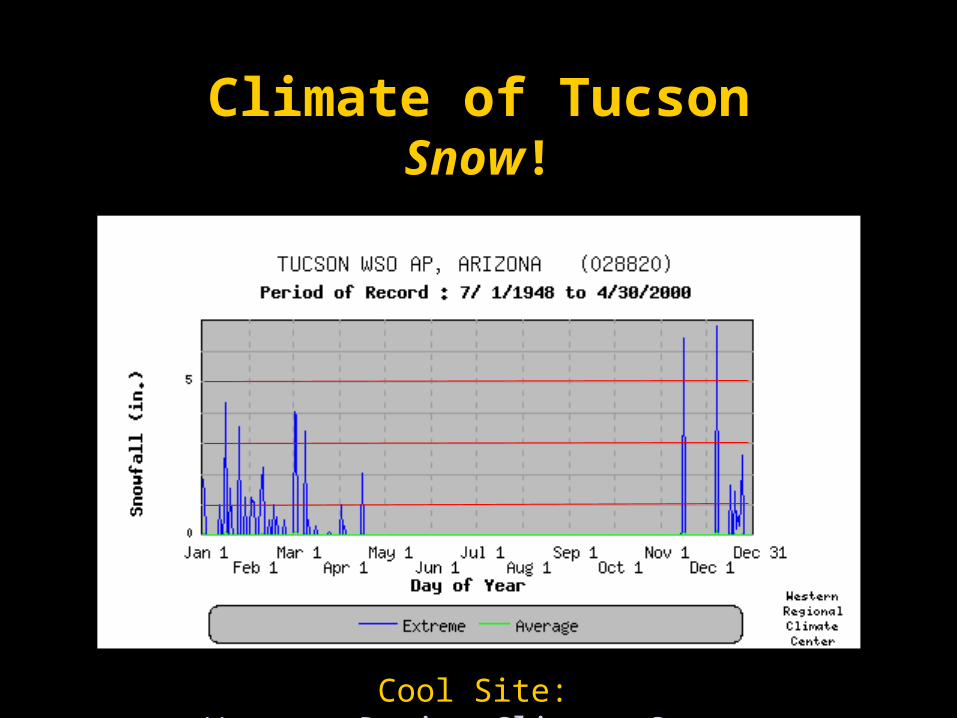
Climate of TucsonSnow!
Cool Site: Western Region Climate Center
48
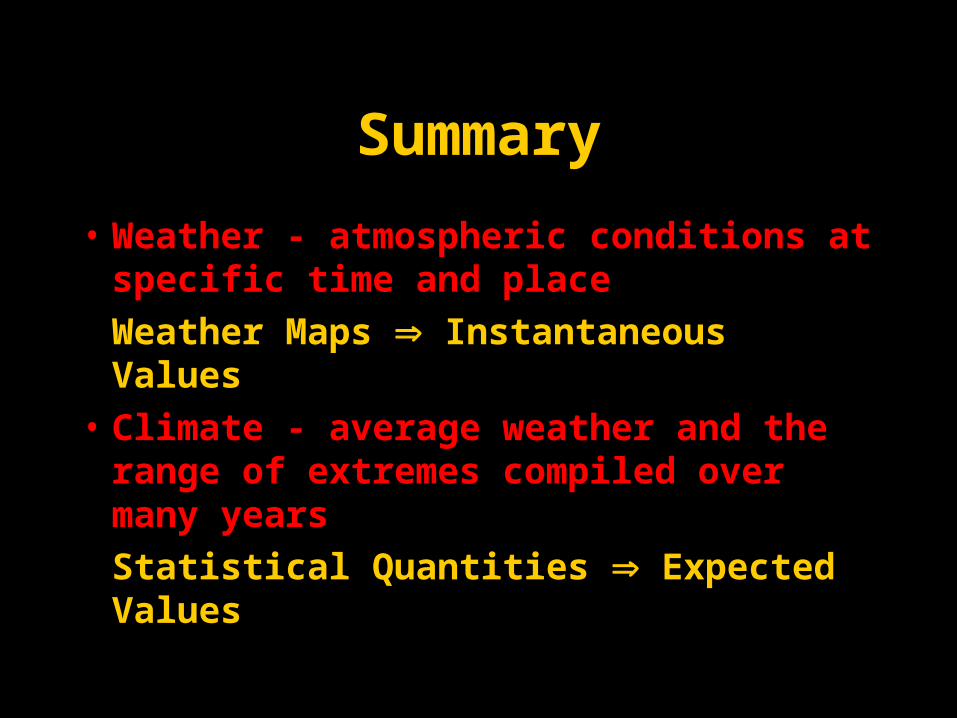
Summary
• Weather - atmospheric conditions at specific time and place
Weather Maps Instantaneous Values
• Climate - average weather and the range of extremes compiled over many years
Statistical Quantities Expected Values
49
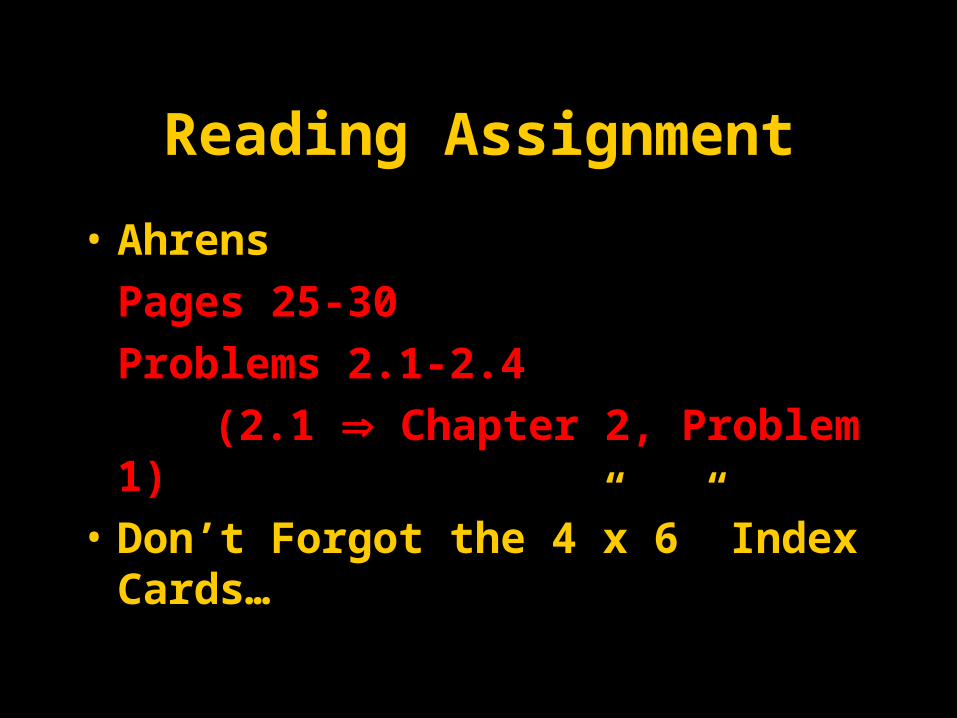
Reading Assignment
• Ahrens
Pages 25-30
Problems 2.1-2.4
(2.1 Chapter 2, Problem 1)
• Don’t Forgot the 4”x 6” Index Cards…