Embed Size (px)
Citation preview
1
NCPP “QED”Workshop24 August 2013Boulder, CO
Evaluating gridded
observations: questions from
the NC-CSC
Andrea J. Ray, Ph.D.,NOAA Earth System Research Lab
Thanks to: P. Shafroth, L Perry, Amy Symstad, J. Morisette, North Central Climate Science Center
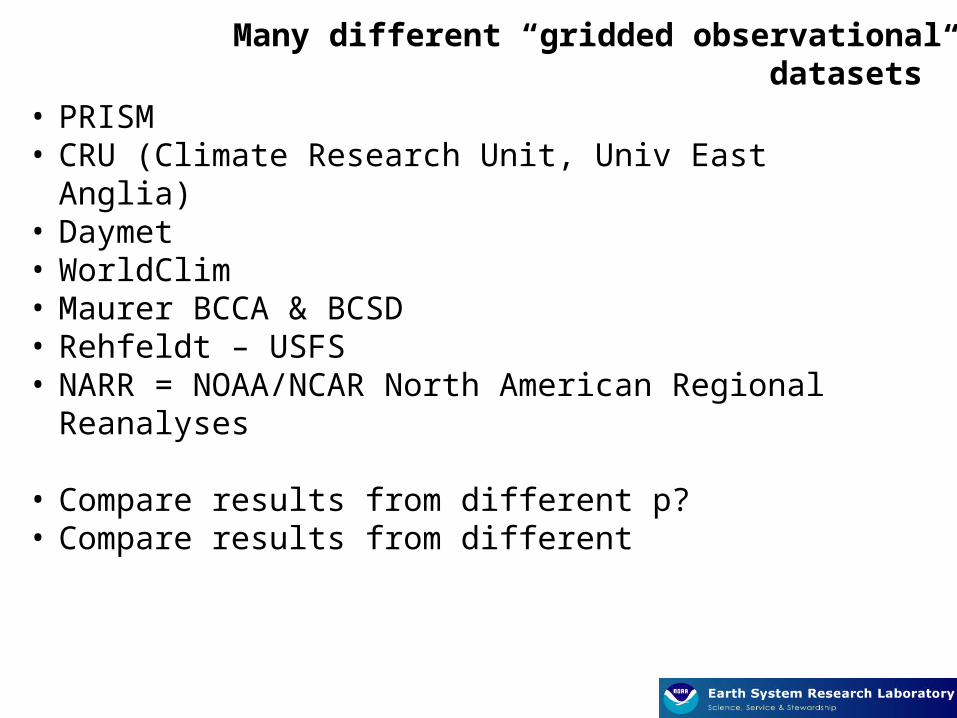
Many different “gridded observational datasets”
• PRISM• CRU (Climate Research Unit, Univ East Anglia)• Daymet• WorldClim• Maurer BCCA & BCSD• Rehfeldt – USFS• NARR = NOAA/NCAR North American Regional
Reanalyses
• Compare results from different p?• Compare results from different
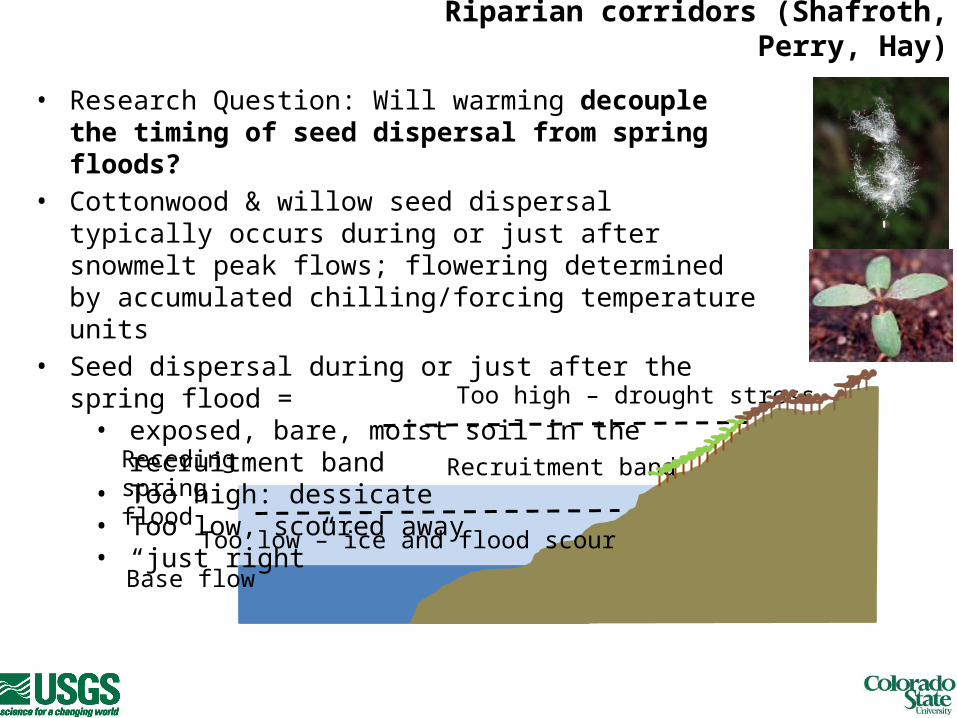
• Research Question: Will warming decouple the timing of seed dispersal from spring floods?
• Cottonwood & willow seed dispersal typically occurs during or just after snowmelt peak flows; flowering determined by accumulated chilling/forcing temperature units
• Seed dispersal during or just after the spring flood =• exposed, bare, moist soil in the recruitment
band• Too high: dessicate• Too low, scoured away• “just right”
Base flow
Recruitment band
Too high – drought stress
Too low – ice and flood scour
Receding spring flood
Riparian corridors (Shafroth, Perry, Hay)
444
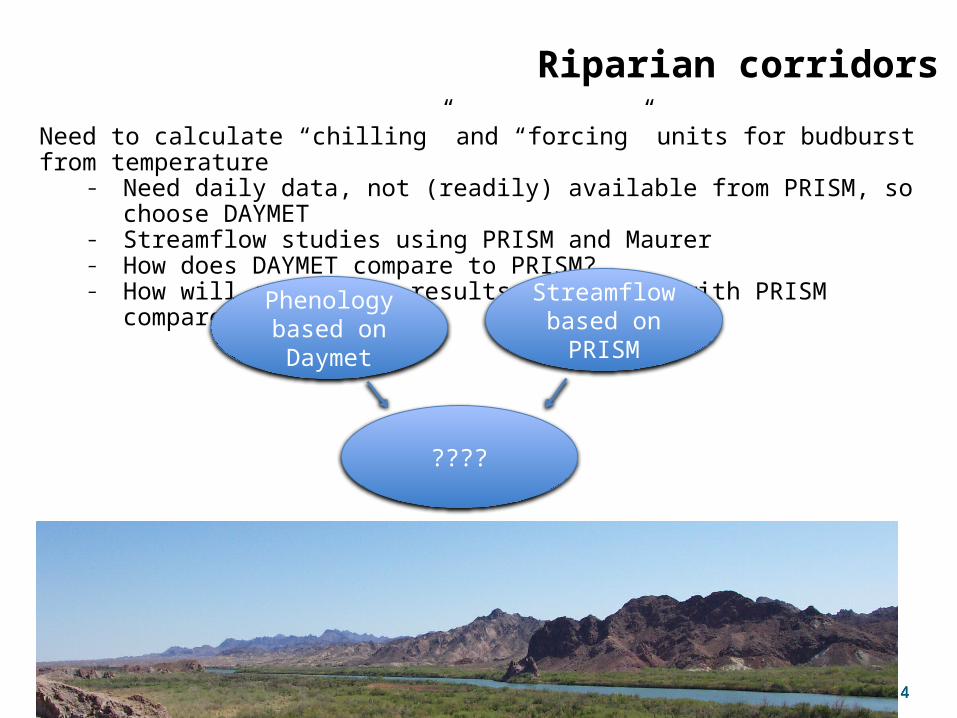
Riparian corridors
Need to calculate “chilling” and “forcing” units for budburst from temperature
– Need daily data, not (readily) available from PRISM, so choose DAYMET
– Streamflow studies using PRISM and Maurer– How does DAYMET compare to PRISM?– How will streamflow results calculated with PRISM compare?
????
Phenology based on Daymet
Streamflow based on
PRISM

Daymet vs PRISM• Daymet generally warmer,
but not consistently across these sites
WY NE
CO
Fort Collins, ColoradoMarch 7, 2013EPA logo
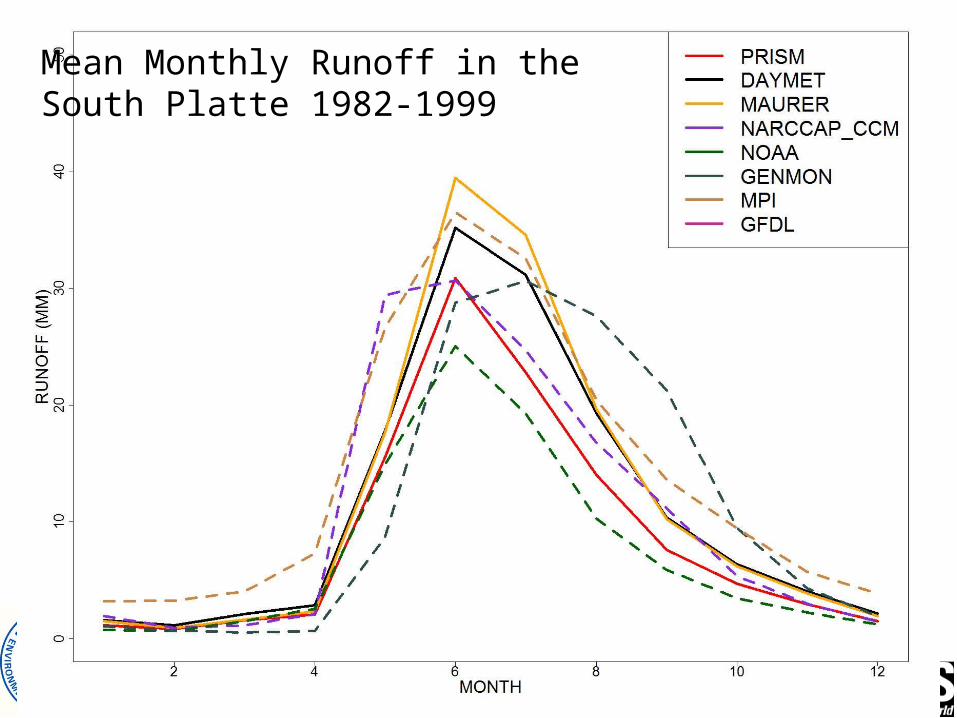
Mean Monthly Runoff in the South Platte 1982-1999
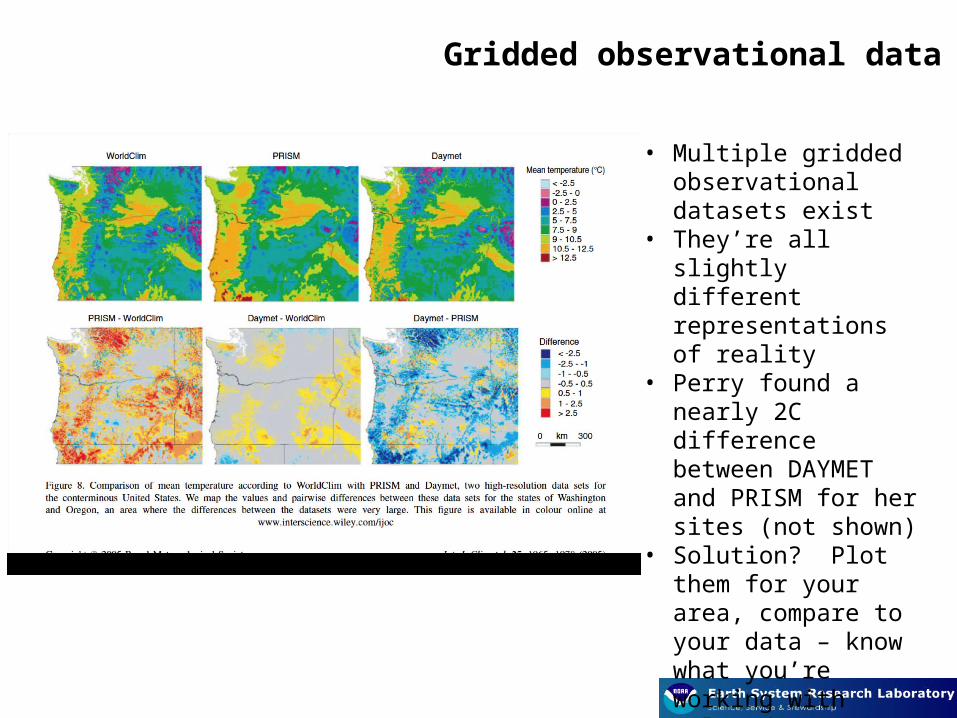
Gridded observational data
• Multiple gridded observational datasets exist
• They’re all slightly different representations of reality
• Perry found a nearly 2C difference between DAYMET and PRISM for her sites (not shown)
• Solution? Plot them for your area, compare to your data – know what you’re working with
• Related question: what if your observations don’t match?
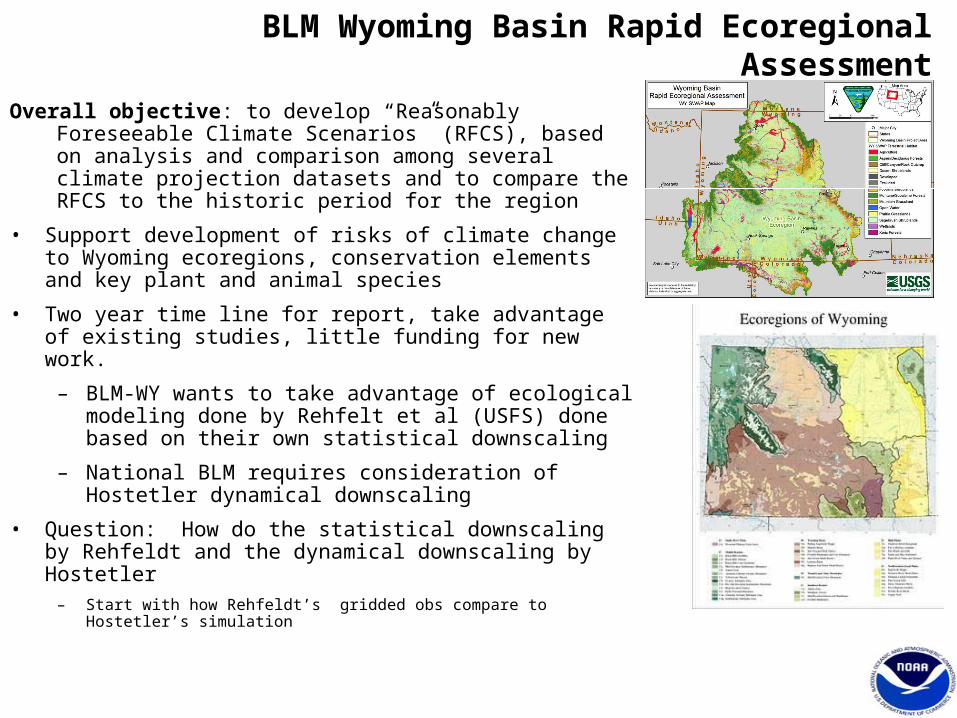
Overall objective: to develop “Reasonably Foreseeable Climate Scenarios” (RFCS), based on analysis and comparison among several climate projection datasets and to compare the RFCS to the historic period for the region
• Support development of risks of climate change to Wyoming ecoregions, conservation elements and key plant and animal species
• Two year time line for report, take advantage of existing studies, little funding for new work.
– BLM-WY wants to take advantage of ecological modeling done by Rehfelt et al (USFS) done based on their own statistical downscaling
– National BLM requires consideration of Hostetler dynamical downscaling
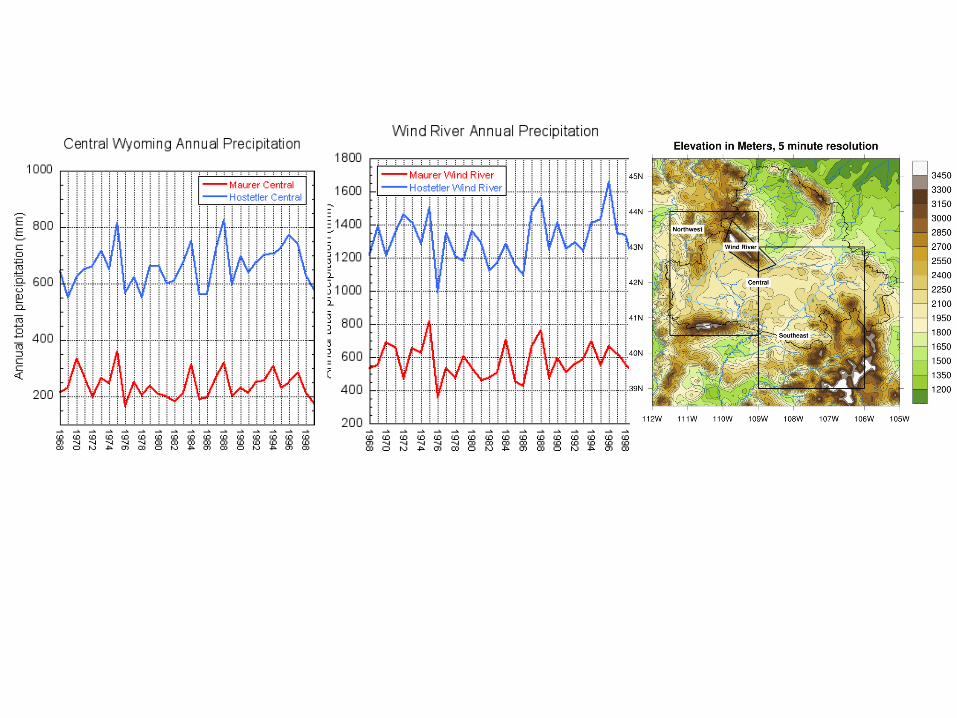
• Question: How do the statistical downscaling by Rehfeldt and the dynamical downscaling by Hostetler– Start with how Rehfeldt’s gridded obs compare to Hostetler’s
simulation
BLM Wyoming Basin Rapid Ecoregional Assessment
Questions on “gridded observational datasets”
• Need consistency – or at least an understanding of bias to integrate results from different parts of studies?• Riparian forests example
• Need consistency – or at least an understanding of bias compare existing results from different studies being aggregated into an assessment• Wyoming Basin REA example

Challenge: Comparing results from different GCMs & their downscaling
• Many ecological and hydrological studies published – the basis for work like REAs• Each have made choices, sometimes arbitrary -- but how to compare results• WY REA, for example wants to use Rehfeldt, but he downscaled different GCMs from
Hostetler, which they’re required to consider• Solution?
• We’re comparing Hostetler & Rehfeldt downscaling for particular variables• If the variables themselves have differences, e.g. warmer/cooler/drier, we’ll have
documented the source• Another solution: Consider products that have been used/evaluated in many projects• Statistical products:
“Maurer” – the basis for the Reclamation “SECURE Water Act” report,and extensively analyzed – IMHO the gold standard for now – downscaled many GCMS and ensemble members/GCM; has been run thru a hydrologic model, so available for hydroclimate variables; already being used in DOI policy & planning. Available from several portals, with visualization tools Climate Wizard, GeoDataPortal
Other options: Hayhoe’s downscaling to stations & other products, used in the National Climate Assessment; WorldClim – widely used, less evaluated
• Dynamical products covering North America NARCCAP, North American Regional Climate Change Assessment Program,
http://www.narccap.ucar.edu. IMHO the gold standard for now – 6 GCMs and multiple RCMs; used in the 2013 National Climate Assessment
Other options: Hostetler, aka “USGS Dynamical downscaling,” http://pubs.usgs.gov/of/2011/1238/; http://regclim.coas.oregonstate.edu; caveat: only 3 GCMs, 1RCM; BLM requiring its use in REAs*
Fort Collins, ColoradoMarch 7, 2013EPA logo
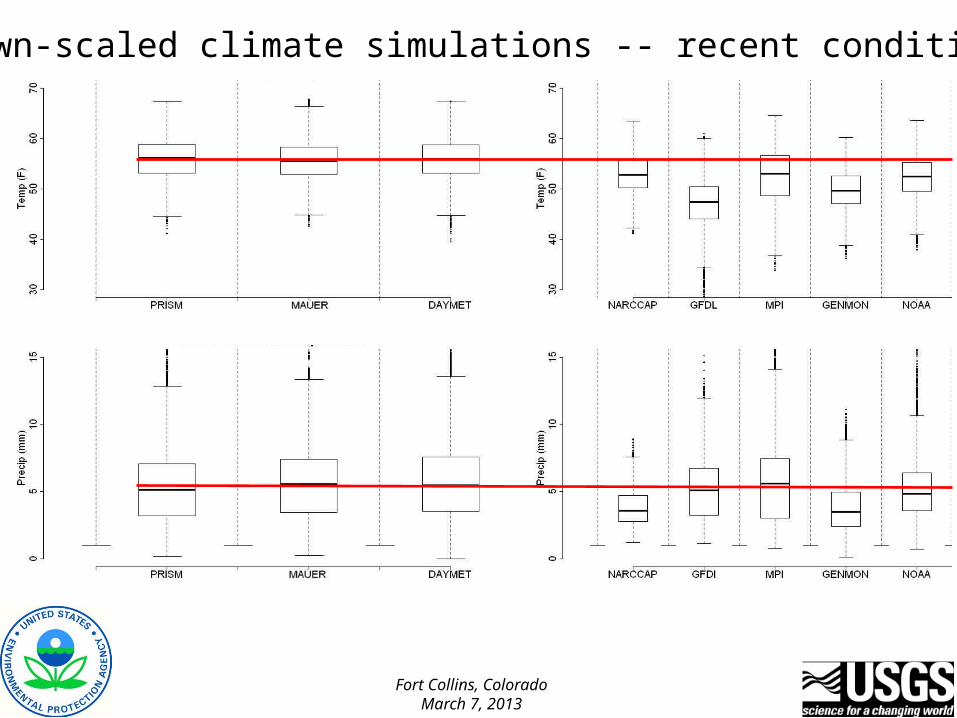
Down-scaled climate simulations -- recent conditions
14
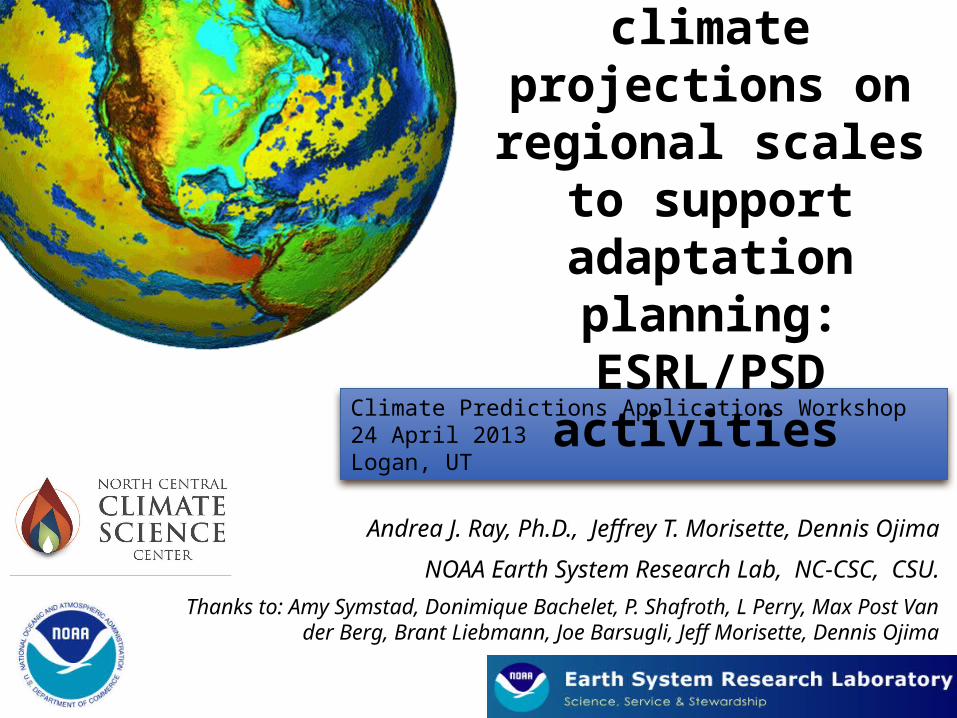
Climate Predictions Applications Workshop24 April 2013Logan, UT
Delivering climate
projections on regional scales
to support adaptation planning: ESRL/PSD activities
Andrea J. Ray, Ph.D., Jeffrey T. Morisette, Dennis Ojima
NOAA Earth System Research Lab, NC-CSC, CSU.
Thanks to: Amy Symstad, Donimique Bachelet, P. Shafroth, L Perry, Max Post Van der Berg, Brant Liebmann, Joe Barsugli, Jeff Morisette, Dennis
Ojima

EXTRAS
“Tiles”
• Ecologists • Edge effects• Solution????
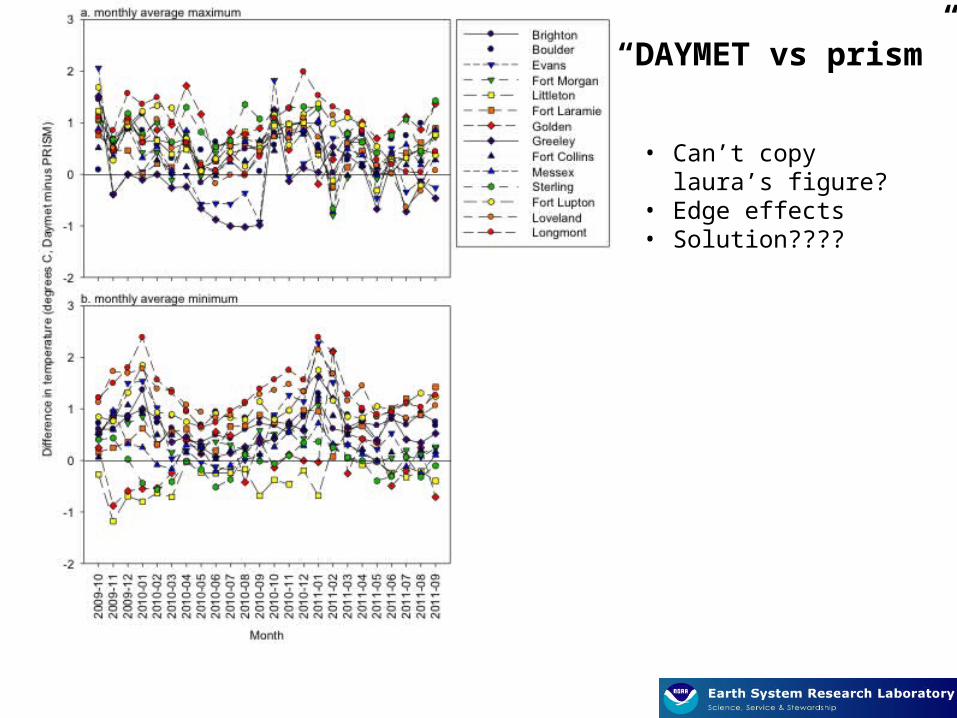
“DAYMET vs prism”
• Can’t copy laura’s figure?• Edge effects• Solution????
“DRAFT”
• Ecologists • Edge effects• Solution????
Climate projections & gridded observational data are widely available from multiple sites However, little consistent information on evaluations, guidance on use, or “translational
information” Give them the same critical eye as ecological data you use – PLOT & explore the
data just as you would biological data {GRAPHIC from daymet and from Laura} Climate scientists need to do a better job of explaining what different products
should and shouldn’t be used for. Results of objective & quantitative evaluation Narratives, which may include qualitative and quantitative aspects of data use; e.g.,
expert guidance on the suitability of the data for an application; also narratives that provide summary information of how the climate has changed or how it will change
Guidance on appropriate uses & interpretation Characterize & interpret uncertainty
“Time series” data into the future, using the projections as “predictions” The sequence of events matters for a lot of ecological studies -- Neither ensemble means
or simply selecting one or a few runs is a good choice GRAPHIC
Hostetler/USGS Dynamical Downscaling – being used a lot in ecological studies how do the 3 GCM selected runs compare {GRAPHIC} Consider this for any GCMS your project is using Comparing results among available analysis projects
“situate” one or more models in the context of others (Lukas’ Mauer plots)
General questions/needs across the projects
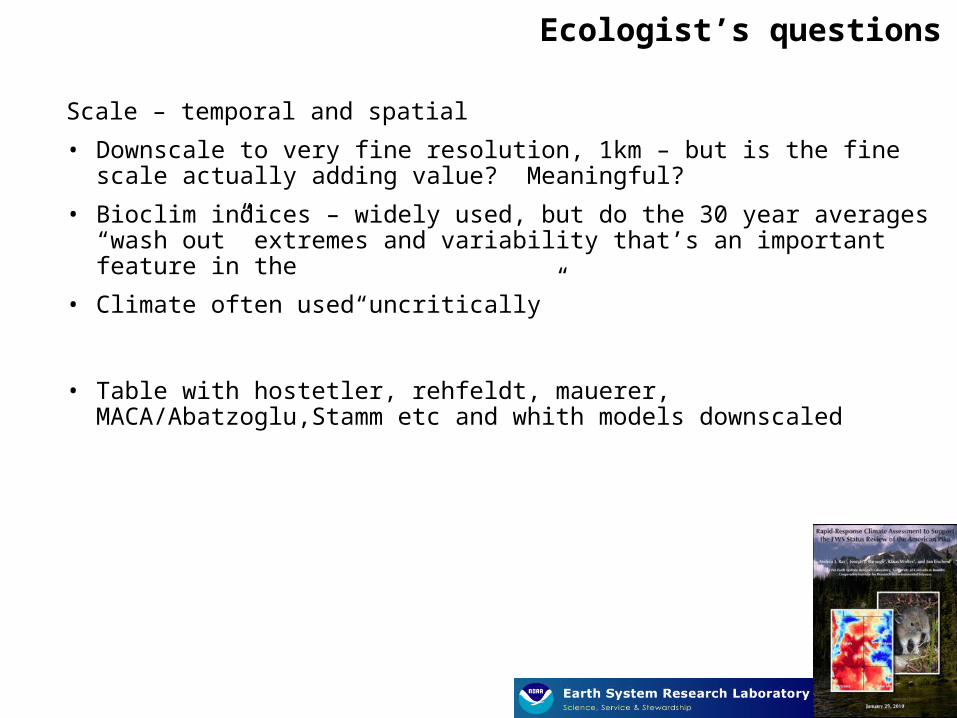
Scale – temporal and spatial
• Downscale to very fine resolution, 1km – but is the fine scale actually adding value? Meaningful?
• Bioclim indices – widely used, but do the 30 year averages “wash out” extremes and variability that’s an important feature in the
• Climate often used“uncritically”
• Table with hostetler, rehfeldt, mauerer, MACA/Abatzoglu,Stamm etc and whith models downscaled
Ecologist’s questions


![Ncpp Block[1]](https://img.pdfslide.net/doc/110x75/5571fb95497959916995470d/ncpp-block1.jpg)


![NCPP Single[1]](https://img.pdfslide.net/doc/110x75/577cdb8d1a28ab9e78a87cda/ncpp-single1.jpg)

