Embed Size (px)
Citation preview

July 27, 2019
BSE Limited
1
Listing Department
nk
National Stock Exchange of India Limited Listing Department
Phiroze Jeejeebhoy Towers Dalal Street
Exchange Plaza, 5th floor Plot No. C/1, G Block
Mumbai 400 001 Bandra-Kurla Complex Sandra (East) Mumbai 400 051
Dear Sir,
Sub: Earnings call for quarter results ended June 30, 2019
This is further to our letter dated July 26, 2019 on the captioned subject.
Please find attached the investor presentation and the opening remarks for the analyst call for the 01-2020 results. The same has also been uploaded on the website of the Bank and can be accessed on the link https:ljwww.icicibank.com/aboutus/qfr.page?#toptitle.
Yours faithfully, For ICICI Bank Limited
Vivek Ranjan Chief Manager
Encl: As above
iCICI Bank limited ICICI Bank Towers, Bandra-Kurla Complex, Mumbai 400 051, India.
Tel.: (91-22) 2653 1414 Fax: (91-22) 2653 1122 Website www.icicibank.com CIN :L65190GJ1994PLC021012
Regd. Office : ICICI Bank Tower, Near Chakli Circle, Old Padra Road, Vadodara 390 007, India.

Q1-2020:
Performance review
July 27, 2019
/CIC/Bank

Certain statements in this release relating to a future period of time (including inter alia concerning our future
business plans or growth prospects) are forward-looking statements intended to qualify for the 'safe harbor'
under applicable securities laws including the US Private Securities Litigation Reform Act of 1995. Such
forward-looking statements involve a number of risks and uncertainties that could cause actual results to
differ materially from those in such forward-looking statements. These risks and uncertainties include, but are
not limited to statutory and regulatory changes, international economic and business conditions; political or
economic instability in the jurisdictions where we have operations, increase in non-performing loans,
unanticipated changes in interest rates, foreign exchange rates, equity prices or other rates or prices, our
growth and expansion in business, the adequacy of our allowance for credit losses, the actual growth in
demand for banking products and services, investment income, cash flow projections, our exposure to
market risks, changes in India’s sovereign rating, as well as other risks detailed in the reports filed by us with
the United States Securities and Exchange Commission. Any forward-looking statements contained herein
are based on assumptions that we believe to be reasonable as of the date of this release. ICICI Bank
undertakes no obligation to update forward-looking statements to reflect events or circumstances after the
date thereof. Additional risks that could affect our future operating results are more fully described in our
filings with the United States Securities and Exchange Commission. These filings are available at
www.sec.gov.
2
3
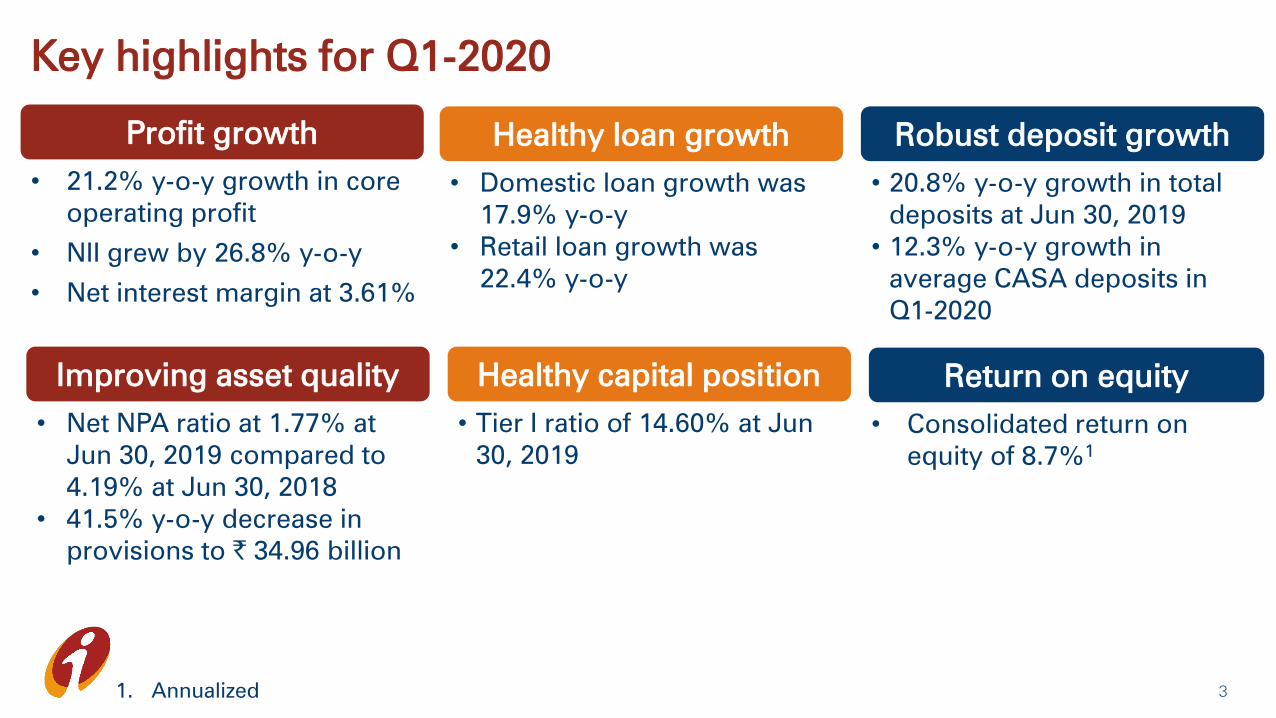
Key highlights for Q1-2020
Profit growth
• 21.2% y-o-y growth in core
operating profit
• NII grew by 26.8% y-o-y
• Net interest margin at 3.61%
Improving asset quality
• Net NPA ratio at 1.77% at
Jun 30, 2019 compared to
4.19% at Jun 30, 2018
• 41.5% y-o-y decrease in
provisions to ` 34.96 billion
Robust deposit growth
• 20.8% y-o-y growth in total
deposits at Jun 30, 2019
• 12.3% y-o-y growth in
average CASA deposits in
Q1-2020
Healthy loan growth
• Domestic loan growth was
17.9% y-o-y
• Retail loan growth was
22.4% y-o-y
Return on equity
• Consolidated return on
equity of 8.7%1
Healthy capital position
• Tier I ratio of 14.60% at Jun
30, 2019
1. Annualized

Strong operating performance
4

Profit & loss statement
5
FY2019 Q1-2019 Q4-2019 Q1-2020 Q1-o-Q1
growth
Net interest income1
270.15 61.02 76.20 77.37 26.8%
Non-interest income 131.46 30.85 34.65 32.47 5.3%
- Fee income 119.89 27.54 31.78 30.39 10.3%
- Dividend income from subsidiaries 10.78 3.172
2.69 1.91 (39.7)%
- Others 0.79 0.14 0.18 0.17 21.4%
Core operating income 401.61 91.87 110.85 109.84 19.6%
Operating exp. 180.89 41.45 50.08 48.74 17.6%
- Employee exp. 68.08 15.14 18.99 19.533
29.0%
- Non-employee exp. 112.81 26.31 31.09 29.21 11.0%
Core operating profit 220.72 50.42 60.77 61.10 21.2%
Core operating profit excl. dividend
from subsidiaries
209.94 47.25 58.08 59.19 25.3%
(` billion)
1. Interest on income tax refund of ` 1.84 bn in Q1-2020 (FY2019: ` 4.48 bn, Q1-2019: ` 0.08 bn, Q4-2019: ` 4.14 bn)
2. Includes dividend income of ` 2.51 billion from ICICI Life; final dividend from ICICI Life and ICICI Securities for
FY2019 is expected to be received in Q2-2020
3. In addition to the annual increment in salaries and increase in number of employees year-on-year, increase in
employee expenses reflects the lower provisions on retirals in Q1-2019 due to increase in yields
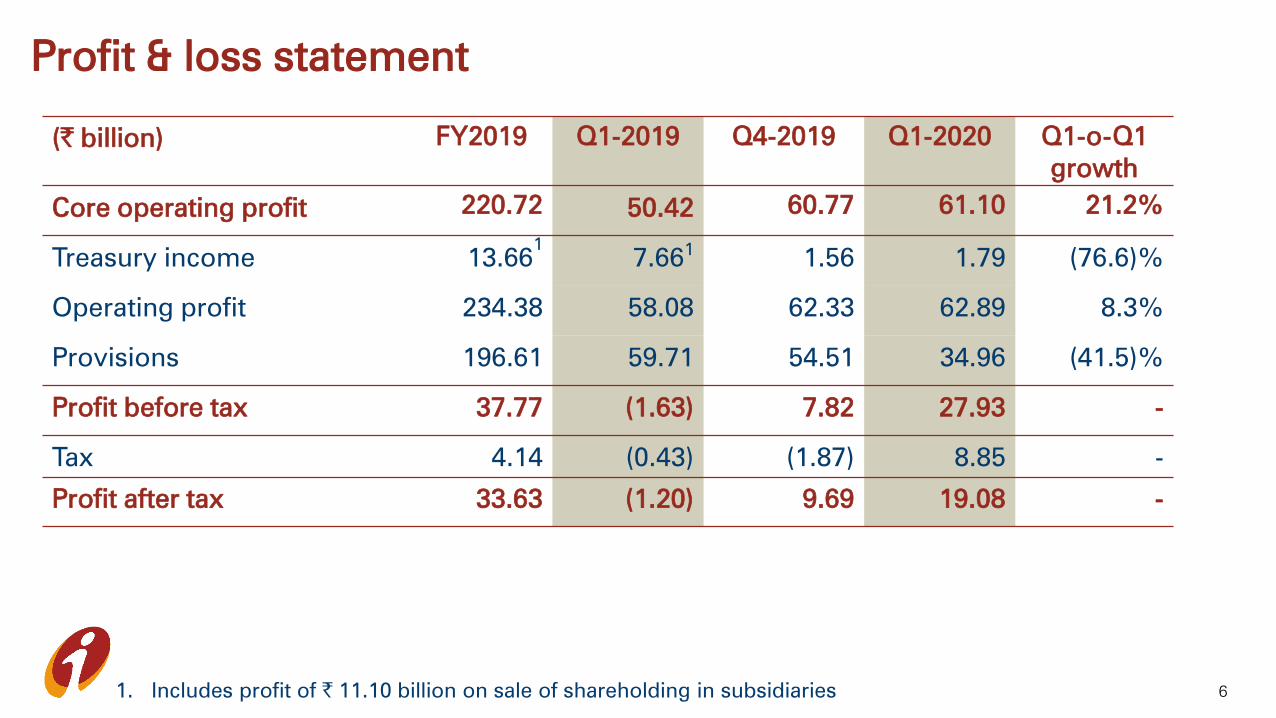
Profit & loss statement
6
(` billion) FY2019 Q1-2019 Q4-2019 Q1-2020 Q1-o-Q1
growth
Core operating profit 220.72 50.42 60.77 61.10 21.2%
Treasury income 13.661
7.661
1.56 1.79 (76.6)%
Operating profit 234.38 58.08 62.33 62.89 8.3%
Provisions 196.61 59.71 54.51 34.96 (41.5)%
Profit before tax 37.77 (1.63) 7.82 27.93 -
Tax 4.14 (0.43) (1.87) 8.85 -
Profit after tax 33.63 (1.20) 9.69 19.08 -
1. Includes profit of ` 11.10 billion on sale of shareholding in subsidiaries

Key ratios
7
Percent FY2019 Q1-2019 Q4-2019 Q1-2020
Net interest margin1
3.42 3.19 3.72 3.61
Cost to income 44.82
46.92
44.5 43.7
Provisions/core operating profit 89.1 118.4 89.7 57.2
Provisions/average advances3
3.67 4.74 3.92 2.40
Return on average assets3
0.39 - 0.43 0.81
Standalone return on equity3
3.2 - 3.6 7.0
Consolidated return on equity3
3.8 - 4.1 8.7
Weighted average EPS (`)3
5.2 (0.8) 6.1 11.90
Book value (`) 168.1 163.8 168.1 171.1
1. Includes interest on income tax refund of ` 1.84 bn in Q1-2020 (FY2019: ` 4.48 bn, Q1-2019: ` 0.08 bn,
Q4-2019: ` 4.14 bn)
2. Excludes gain on sale of stake in subsidiaries
3. Annualised for all interim periods

Balance sheet growth
8

Robust deposit growth
9
(` billion) Jun 30, 2018 Mar 31, 2019 Jun 30, 2019 Y-o-Y
growth
% share at
Jun 30, 2019
CASA 2,762.93 3,239.40 2,988.77 8.2% 45.2%
- Current 766.89 962.69 804.01 4.8% 12.1%
- Savings 1,996.04 2,276.71 2,184.76 9.5% 33.1%
Term 2,705.85 3,289.80 3,618.55 33.7% 54.8%
Total deposits 5,468.78 6,529.20 6,607.32 20.8% 100.0%
Q1-2019 Q4-2019 Q1-2020
Average CASA ratio 46.1% 44.6% 43.4% - -
• 12.3% y-o-y growth in average CASA deposits in Q1-2020
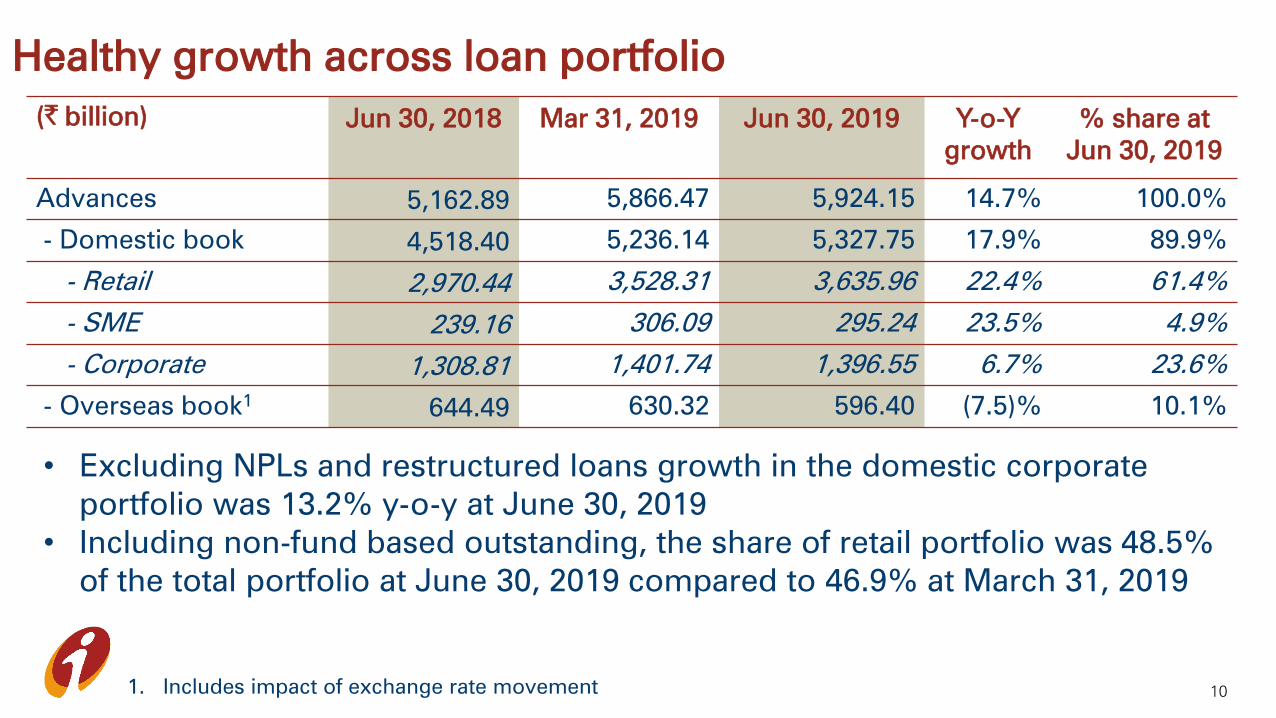
Healthy growth across loan portfolio
10
(` billion) Jun 30, 2018 Mar 31, 2019 Jun 30, 2019 Y-o-Y
growth
% share at
Jun 30, 2019
Advances 5,162.89 5,866.47 5,924.15 14.7% 100.0%
- Domestic book 4,518.40 5,236.14 5,327.75 17.9% 89.9%
- Retail 2,970.44 3,528.31 3,635.96 22.4% 61.4%
- SME 239.16 306.09 295.24 23.5% 4.9%
- Corporate 1,308.81 1,401.74 1,396.55 6.7% 23.6%
- Overseas book1
644.49 630.32 596.40 (7.5)% 10.1%
• Excluding NPLs and restructured loans growth in the domestic corporate
portfolio was 13.2% y-o-y at June 30, 2019
• Including non-fund based outstanding, the share of retail portfolio was 48.5%
of the total portfolio at June 30, 2019 compared to 46.9% at March 31, 2019
1. Includes impact of exchange rate movement

Retail portfolio
11
(` billion) Jun 30,
2018
Mar 31,
2019
Jun 30,
2019
Y-o-Y
growth
% share at
Jun 30, 2019
Home loans 1,544.55 1,782.36 1,839.30 19.1% 50.6%
Vehicle loans2
476.56 556.66 560.58 17.6% 15.4%
Business banking 132.42 188.45 193.45 46.1% 5.3%
Rural loans 427.35 499.60 500.33 17.1% 13.8%
Personal loans 223.41 310.15 344.42 54.2% 9.5%
Credit cards 103.04 123.04 136.94 32.9% 3.8%
Others3
63.10 68.05 60.94 (3.4)% 1.7%
Total retail loans1
2,970.44 3,528.31 3,635.96 22.4% 100.0%
1. Includes buyouts of ` 84.27 billion at Jun 30, 2019 (` 77.41 billion at Mar 31, 2019)
2. Includes auto finance (Jun 30, 2019: ` 314.78 billion), commercial business (Jun 30, 2019: ` 232.61 billion)
and two wheeler loans (Jun 30, 2019: ` 13.19 billion)
3. Includes dealer funding loans (Jun 30, 2019: ` 42.84 billion), loans against securities and others (Jun 30,
2019: ` 18.10 billion)

Technology capabilities
12
1. Includes internet, mobile, POS, touch banking, phone banking and debit cards e-commerce transactions
2. Application program interface
Growth in average monthly transaction volume
12% y-o-y
Debit cards
32% y-o-y
Credit cards
141% y-o-y
Mobile banking
Digital leadership
The Forrester Banking Wave™
iMobile named as India’s top mobile
banking app
Digital adoption
RFID tags (FASTags)
63% market share by issuance
Savings account transactions
through digital channels1
87% in Q1-2020 Over 550 APIs2
API2
based banking across
domains

Digital banking initiative
13
‘InstaBIZ’
Comprehensive digital banking platform for
MSMEs and self-employed customers
• Over 115 products and services, digitally and
secured, on the mobile app and web portal
including
– instant overdraft facility and business loans
– bulk collection and payment of funds
– automatic bank reconciliation
– import/export transactions
• First digital banking platform to enable instant
payment of GST

Digital partnerships
14
ICICI Bank’s first co-branded multi-currency travel card
with Goibibo
• Accepted across 200 countries and 46 million merchants
globally, load the card with upto 15 currencies
• Instantly convert money from one currency to another
online and reload currency into the card using the Bank’s
mobile and internet banking platform
• Offers exclusive benefits including travel privileges upto `20,000 and comprehensive travel insurance
Existing
partnerships
Amazon MakeMyTrip

Improving asset quality trends
15
Reduction in net NPAs
16
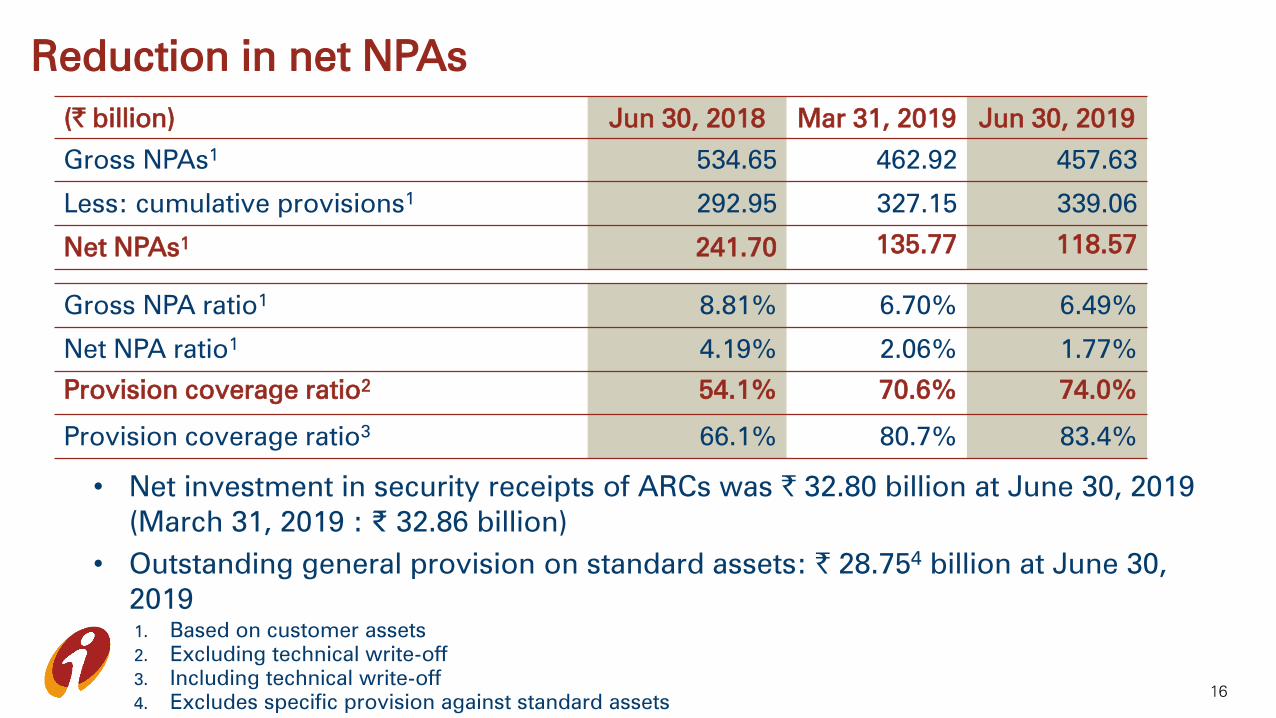
(` billion) Jun 30, 2018 Mar 31, 2019 Jun 30, 2019
Gross NPAs1
534.65 462.92 457.63
Less: cumulative provisions1
292.95 327.15 339.06
Net NPAs1
241.70 135.77 118.57
Gross NPA ratio1
8.81% 6.70% 6.49%
Net NPA ratio1
4.19% 2.06% 1.77%
Provision coverage ratio2
54.1% 70.6% 74.0%
Provision coverage ratio3
66.1% 80.7% 83.4%
1. Based on customer assets
2. Excluding technical write-off
3. Including technical write-off
4. Excludes specific provision against standard assets
• Net investment in security receipts of ARCs was ` 32.80 billion at June 30, 2019
(March 31, 2019 : ₹ 32.86 billion)
• Outstanding general provision on standard assets: ` 28.754
billion at June 30,
2019

Decline in Corporate and SME NPA additions
17
1. Based on customer assets
2. Includes slippages of ` 4.52 billion from the kisan credit card portfolio
NPA movement1
(` billion) FY2019 Q1-2019 Q4-2019 Q1-2020
Opening gross NPA 540.63 540.63 515.91 462.92
Add: gross additions 110.39 40.36 35.47 27.79
- Retail 35.96 11.20 8.23 15.112
- Corporate and SME 74.43 29.16 27.24 12.68
Less: recoveries & upgrades 47.16 20.36 15.22 9.31
Net additions 63.23 20.00 20.25 18.48
Less: write-offs 112.49 25.98 73.24 22.00
: sale of NPAs 28.45 - - 1.77
Closing gross NPAs 462.92 534.65 462.92 457.63

Movement of NPA1
181. Based on customer assets
(` billion) Q1-2020
Gross additions 27.79
- Retail 15.11
- Corporate and SME 12.68
- BB and below portfolio
of which: Devolvement of non-fund based o/s to existing NPAs 5.43
- Slippages from restructured loans 1.86
Other BB and below 4.34
- Others 1.05

Movement in Corporate and SME BB and below
19
(` billion)
1,2,3,4 1,2,3,4
1. Fund-based and non-fund based outstanding
2. Excludes banks
3. Excludes investments
4. Excludes fund-based outstanding to NPAs
5. Includes cases downgraded from investment grade and classified as NPL during Q1-2020
5
5

Exposure to power sector
20
(` billion) Mar 31,
2019
Jun 30,
2019
Share at Jun
30, 2019 (%)
Borrowers classified as NPA or part of BB and
below portfolio1
114.05 111.79 29%
Other borrowers 259.86 279.26 71%
Total 373.91 391.04 100%
• Of the other borrowers aggregating ` 279.26 billion, excluding exposure to State
Electricity Boards, ~80% was rated A- and above
1. Including loans restructured or under a RBI resolution scheme

NBFCs, HFCs and builder portfolio
21
Outstanding (` billion) Mar 31, 2019 Jun 30, 2019
NBFCs1
293.68 264.85
HFCs1
138.58 155.16
Builder portfolio (construction finance, lease rental
discounting, term loans and working capital loans)
196.33 202.49
1. Includes loans, investment and non-fund based outstanding

Improving rating profile of overall loan book
22
Rating category1,2
Mar 31, 2016 Mar 31, 2017 Mar 31, 2018 Mar 31, 2019 Jun 30, 2019
AA- and above 30.6% 37.2% 42.4% 45.1% 44.7%
A+, A, A- 21.3% 19.0% 20.1% 22.0% 22.4%
A- and above 51.9% 56.2% 62.5% 67.1% 67.1%
BBB+,BBB, BBB- 27.8% 28.7% 27.5% 28.2% 29.2%
BB and below3 19.6% 14.6% 9.4% 4.5% 3.5%
Unrated 0.7% 0.5% 0.6% 0.2% 0.2%
Total 100.0% 100.0% 100.0% 100.0% 100.0%
Total net advances (`billion)
4,353 4,642 5,124 5,866 5,924
1. Based on internal ratings
2. For retail loans, ratings have been undertaken at the product level
3. Includes net non-performing loans
• 88.5% of the disbursements in Q1-2020 in the domestic and international
corporate portfolio was to corporates rated A- and above
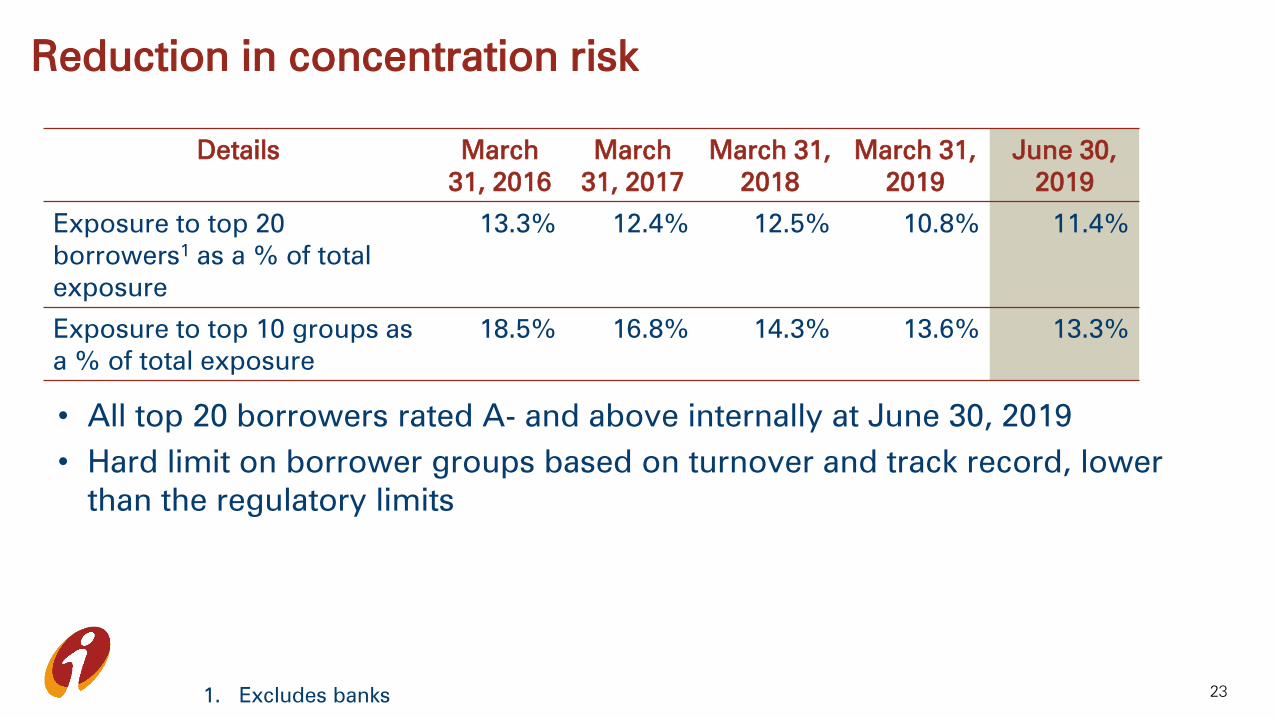
Reduction in concentration risk
23
• All top 20 borrowers rated A- and above internally at June 30, 2019
• Hard limit on borrower groups based on turnover and track record, lower
than the regulatory limits
Details March
31, 2016
March
31, 2017
March 31,
2018
March 31,
2019
June 30,
2019
Exposure to top 20
borrowers1
as a % of total
exposure
13.3% 12.4% 12.5% 10.8% 11.4%
Exposure to top 10 groups as
a % of total exposure
18.5% 16.8% 14.3% 13.6% 13.3%
1. Excludes banks

Capital
24
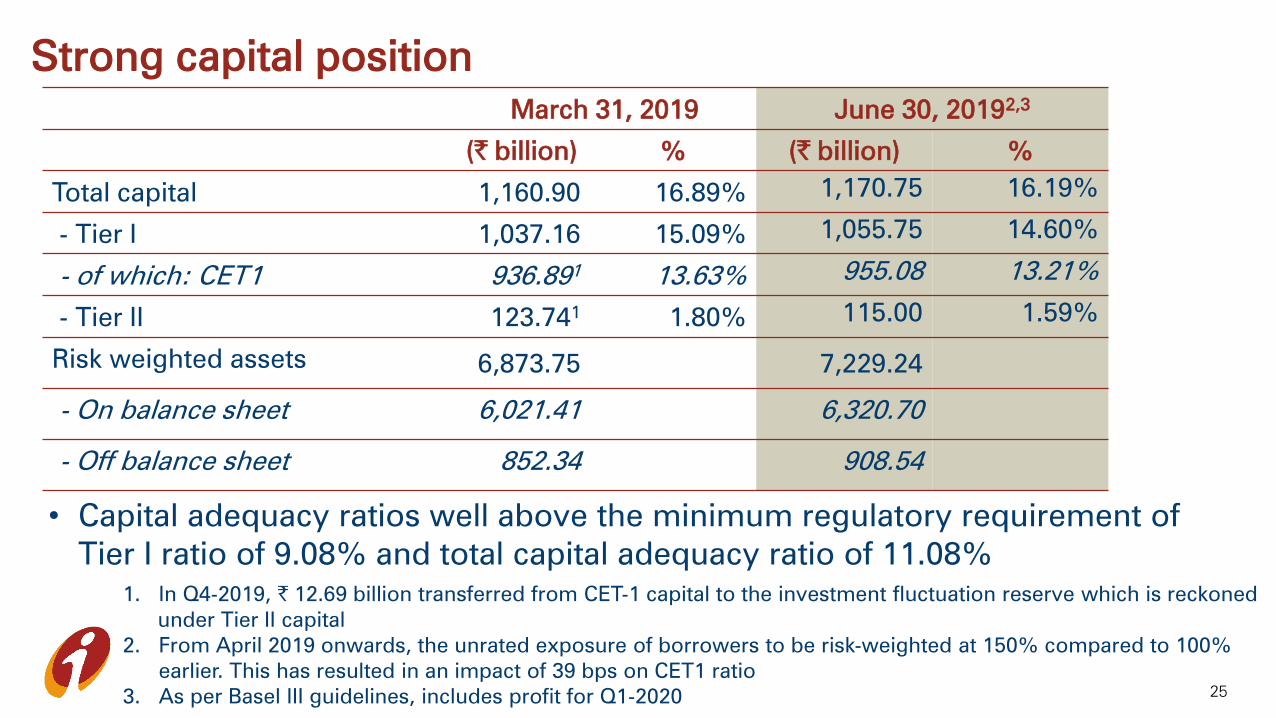
Strong capital position
25
March 31, 2019 June 30, 20192,3
(` billion) % (` billion) %
Total capital 1,160.90 16.89% 1,170.75 16.19%
- Tier I 1,037.16 15.09% 1,055.75 14.60%
- of which: CET1 936.891
13.63% 955.08 13.21%
- Tier II 123.741
1.80% 115.00 1.59%
Risk weighted assets 6,873.75 7,229.24
- On balance sheet 6,021.41 6,320.70
- Off balance sheet 852.34 908.54
1. In Q4-2019, ` 12.69 billion transferred from CET-1 capital to the investment fluctuation reserve which is reckoned
under Tier II capital
2. From April 2019 onwards, the unrated exposure of borrowers to be risk-weighted at 150% compared to 100%
earlier. This has resulted in an impact of 39 bps on CET1 ratio
3. As per Basel III guidelines, includes profit for Q1-2020
• Capital adequacy ratios well above the minimum regulatory requirement of
Tier I ratio of 9.08% and total capital adequacy ratio of 11.08%

Subsidiaries
26

Profit after tax of subsidiaries
27
Profit after tax (` billion) FY2019 Q1-2019 Q4-2019 Q1-2020
ICICI Prudential Life Insurance 11.41 2.82 2.61 2.85
ICICI Lombard General Insurance 10.49 2.89 2.28 3.10
ICICI Prudential Asset Management1
6.83 0.76 2.17 2.19
ICICI Securities (Consolidated)1
4.91 1.34 1.22 1.14
ICICI Securities Primary Dealership1,2
0.78 (0.33) 0.24 0.69
ICICI Home Finance1
0.44 0.23 (0.03) (0.06)
ICICI Venture 0.70 0.03 0.69 0.22
ICICI Bank UK (USD million) (52.9) 1.8 (25.3) 10.1
ICICI Bank Canada (CAD million) 52.4 14.0 12.6 11.8
1. As per Ind AS
2. Represents total comprehensive income

Insurance subsidiaries
28
ICICI Prudential Life Insurance
• Protection annualised premium equivalent (APE) grew by 87.7% y-o-y to `2.14 billion in Q1-2020
• Share of protection in the new business mix based on APE increased from
8.2% in Q1-2019 to 14.6% in Q1-2020
• Value of New Business (VNB) grew by 26.6% y-o-y to ` 3.09 billion in Q1-
2020; VNB margins increased from 17.0% in FY2019 to 21.0% in Q1-2020
ICICI Lombard General Insurance
• Combined ratio was 100.4% in Q1-2020 compared to 98.8% in Q1-2019
– Excluding the impact of cyclone Fani, the combined ratio was 99.7% in Q1-2020
• Return on average equity was 23.0%1
in Q1-2020
1. Annualised

Environmental and social initiatives
29

Environmental and social initiatives (1/2)
30
Creating a positive impact while building a sustainable business and
ensuring value creation for all stakeholdersFocus
• Sound risk management practices underlying the business strategy of
growing core operating profits
• Committed to supporting environment-friendly projects based on
appropriate assessment of risks
• Continuous efforts towards operational efficiency and minimising impact
on environment
o The Bank is ensuring IGBC1
green building features in all new offices and
branches at the time of set up; nine offices awarded Platinum rating by IGBC
• Continued efforts towards providing skill training and sustainable
livelihood opportunities through ICICI Foundation
• Meeting the complete financial requirements of the rural customers and
their ecosystem
Key
priorities
1. Indian Green Building Council
31
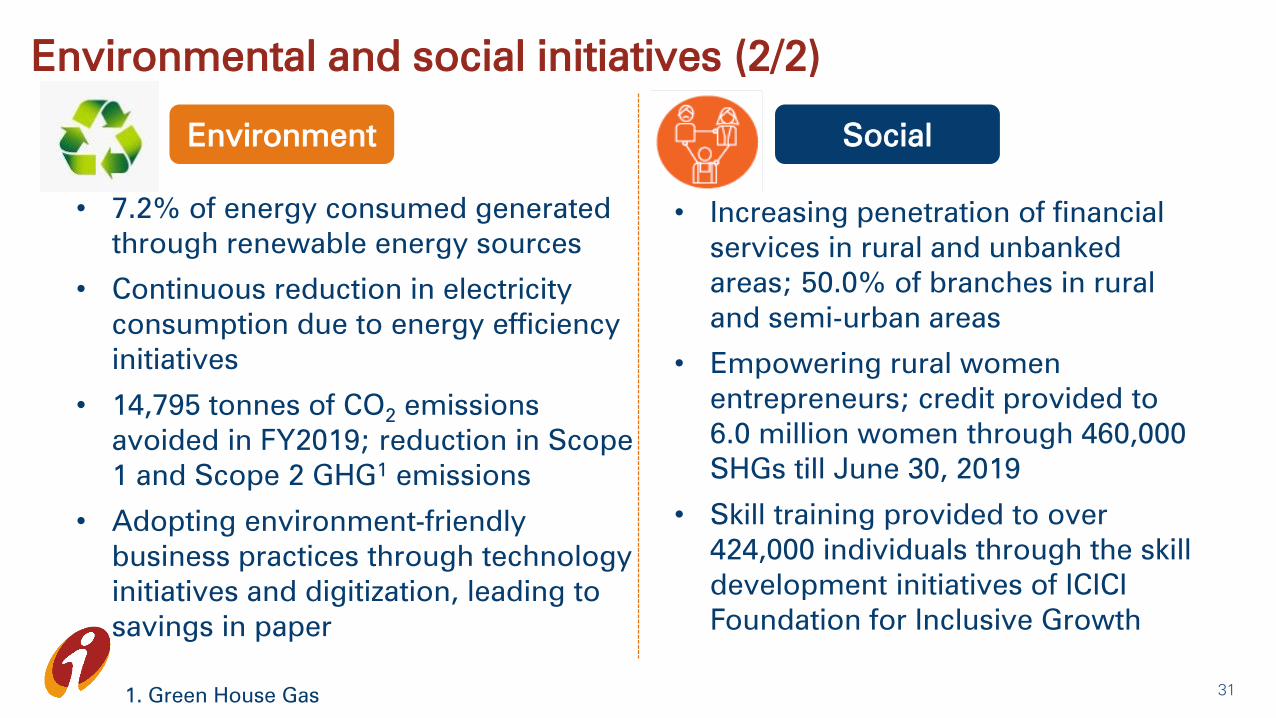
Environmental and social initiatives (2/2)
• 7.2% of energy consumed generated
through renewable energy sources
• Continuous reduction in electricity
consumption due to energy efficiency
initiatives
• 14,795 tonnes of CO2
emissions
avoided in FY2019; reduction in Scope
1 and Scope 2 GHG1
emissions
• Adopting environment-friendly
business practices through technology
initiatives and digitization, leading to
savings in paper
Environment Social
• Increasing penetration of financial
services in rural and unbanked
areas; 50.0% of branches in rural
and semi-urban areas
• Empowering rural women
entrepreneurs; credit provided to
6.0 million women through 460,000
SHGs till June 30, 2019
• Skill training provided to over
424,000 individuals through the skill
development initiatives of ICICI
Foundation for Inclusive Growth
1. Green House Gas

Thank you
/CIC/Bank

Additional financial information
33

Yield, cost and margin
34
Movement in yield, costs & margins
(Percent)1
FY2019 Q1-2019 Q4-2019 Q1-2020
Yield on total interest-earning assets 8.03 7.69 8.45 8.40
- Yield on advances 8.96 8.71 9.29 9.36
Cost of funds 5.10 4.99 5.20 5.23
- Cost of deposits 4.87 4.81 5.00 5.08
Net interest margin 3.42 3.19 3.72 3.61
- Domestic 3.77 3.54 4.12 3.93
- Overseas 0.30 0.30 0.03 0.33
Interest on income tax refund of ` 1.84 bn in Q1-2020 (FY2019: ` 4.48 bn, Q1-2019: `0.08 bn, Q4-2019: ` 4.14 bn)
1. Annualised for all interim periods

Unconsolidated segment-wise PBT
35
Profit before tax
(` billion)
FY2019 Q1-2019 Q4-2019 Q1-2020
Retail 82.23 20.47 21.03 19.68
Wholesale (102.42) (36.75) (27.90) (5.06)
Treasury 51.65 14.16 9.87 10.77
Others 6.31 0.49 4.82 2.54
Total 37.77 (1.63) 7.82 27.93

Consolidated profit & loss statement
36
(` billion) FY2019 Q1-2019 Q4-2019 Q1-2020 Y-o-Y
growth
Net interest income 328.04 74.56 91.51 93.57 25.5%
Non-interest income 593.25 124.36 172.81 135.03 8.6%
- Fee income 143.63 34.17 36.96 36.97 8.2%
- Premium income 420.94 80.29 130.29 92.67 15.4%
- Other income 28.68 9.90 5.56 5.39 (45.6)%
Total income 921.29 198.92 264.32 228.60 14.9%
Operating expenses 642.59 131.66 190.12 150.93 14.6%
Operating profit 278.70 67.26 74.20 77.67 15.5%
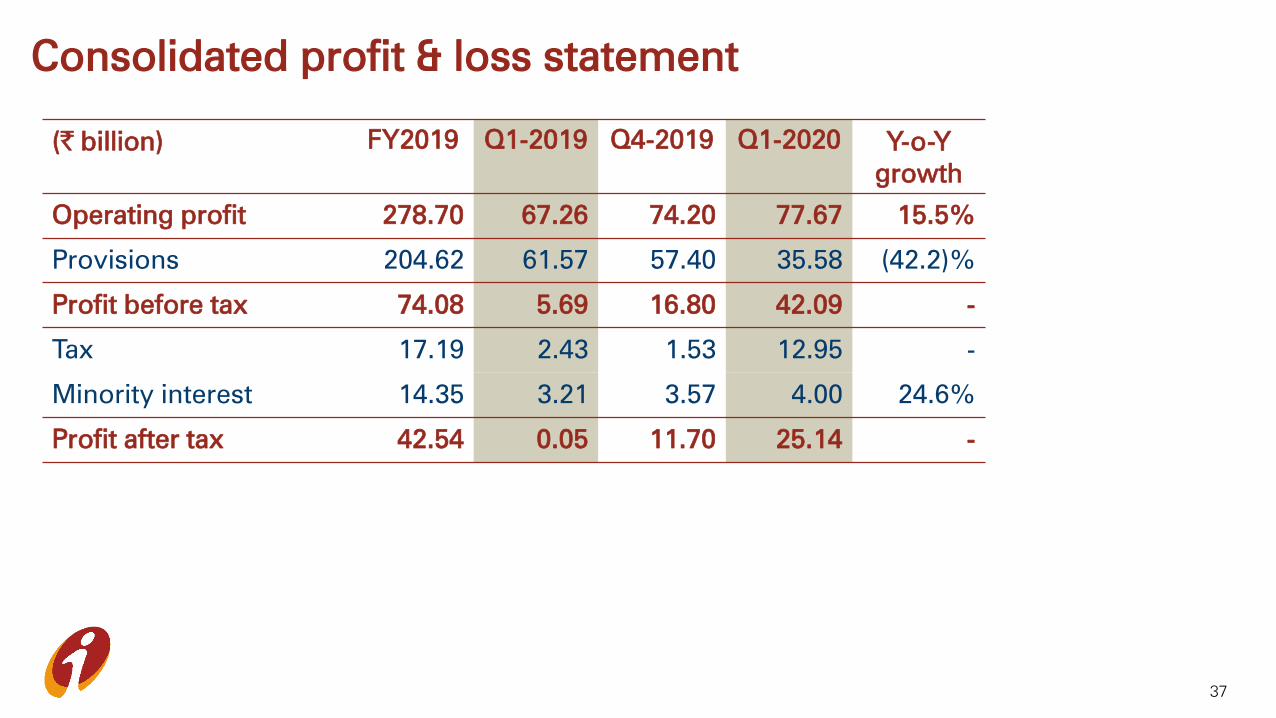
Consolidated profit & loss statement
37
(` billion) FY2019 Q1-2019 Q4-2019 Q1-2020 Y-o-Y
growth
Operating profit 278.70 67.26 74.20 77.67 15.5%
Provisions 204.62 61.57 57.40 35.58 (42.2)%
Profit before tax 74.08 5.69 16.80 42.09 -
Tax 17.19 2.43 1.53 12.95 -
Minority interest 14.35 3.21 3.57 4.00 24.6%
Profit after tax 42.54 0.05 11.70 25.14 -

Key ratios (consolidated)
38
Percent FY2019 Q1-2019 Q4-2019 Q1-2020
Return on average networth1,2
3.8 - 4.1 8.7
Weighted average EPS2
6.6 - 7.4 15.7
Book value (`) 177 172 177 181
1. Based on quarterly average networth
2. Annualised for all interim periods

Balance sheet: liabilities
(` billion) Jun 30, 2018 Mar 31, 2019 Jun 30, 2019
Net worth 1,053.42 1,083.68 1,104.00
- Equity capital 12.87 12.89 12.91
- Reserves 1,040.55 1,070.79 1,091.09
Deposits 5,468.78 6,529.20 6,607.32
- Savings 1,996.04 2,276.71 2,184.76
- Current 766.89 962.69 804.01
- Term 2,705.85 3,289.80 3,618.55
Borrowings1 1,619.70 1,653.20 1,567.20
Other liabilities 309.38 378.51 359.01
Total liabilities 8,451.28 9,644.59 9,637.53
39
• Credit/deposit ratio of 81.4% on the domestic balance sheet at Jun 30, 2019
1. Including impact of rupee depreciation
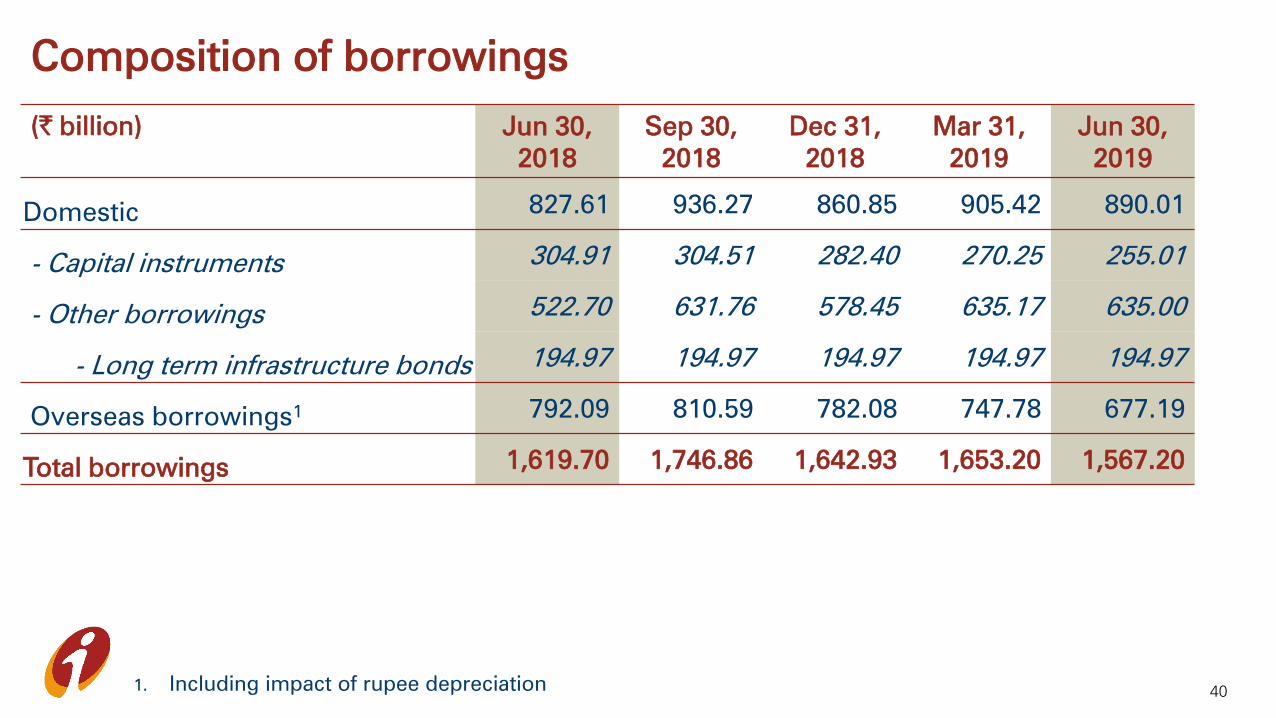
Composition of borrowings
40
(` billion) Jun 30,
2018
Sep 30,
2018
Dec 31,
2018
Mar 31,
2019
Jun 30,
2019
Domestic827.61 936.27 860.85 905.42 890.01
- Capital instruments304.91 304.51 282.40 270.25 255.01
- Other borrowings522.70 631.76 578.45 635.17 635.00
- Long term infrastructure bonds 194.97 194.97 194.97 194.97 194.97
Overseas borrowings1 792.09 810.59 782.08 747.78 677.19
Total borrowings1,619.70 1,746.86 1,642.93 1,653.20 1,567.20
1. Including impact of rupee depreciation

Balance sheet: assets
(` billion) Jun 30, 2018 Mar 31, 2019 Jun 30, 2019
Cash & bank balances 632.95 802.96 657.48
Investments 1,863.60 2,077.33 2,199.96
- SLR investments 1,337.82 1,479.10 1,533.75
- Equity investment in subsidiaries 98.03 98.03 98.03
Advances 5,162.89 5,866.47 5,924.15
Fixed & other assets1
791.84 897.83 855.94
- RIDF 2and related 258.40 292.55 291.41
Total assets 8,451.28 9,644.59 9,637.53
41
1. Non-banking assets (net of provisions) acquired in satisfaction of claims of ` 6.66 billion at June 30, 2019
(March 31, 2019: ` 10.04 billion; June 30, 2018: ` 19.53 billion)
2. Rural Infrastructure Development Fund
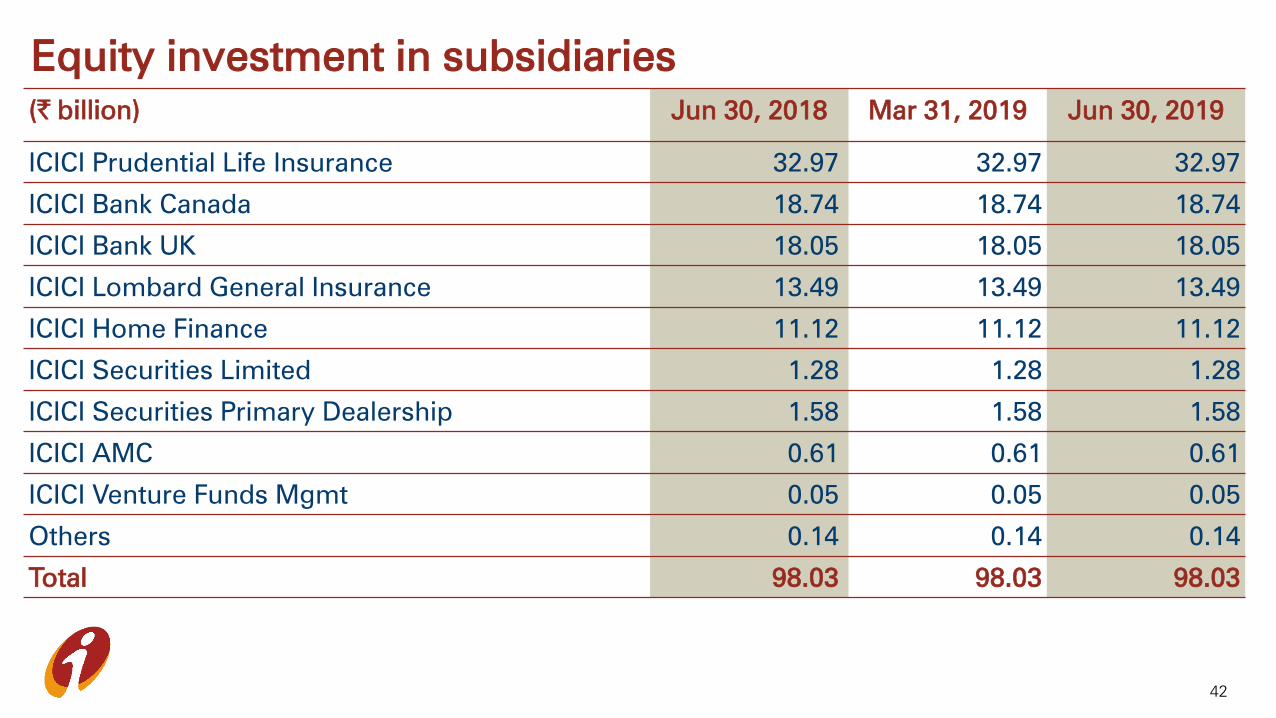
Equity investment in subsidiaries
(` billion) Jun 30, 2018 Mar 31, 2019 Jun 30, 2019
ICICI Prudential Life Insurance 32.97 32.97 32.97
ICICI Bank Canada 18.74 18.74 18.74
ICICI Bank UK 18.05 18.05 18.05
ICICI Lombard General Insurance 13.49 13.49 13.49
ICICI Home Finance 11.12 11.12 11.12
ICICI Securities Limited 1.28 1.28 1.28
ICICI Securities Primary Dealership 1.58 1.58 1.58
ICICI AMC 0.61 0.61 0.61
ICICI Venture Funds Mgmt 0.05 0.05 0.05
Others 0.14 0.14 0.14
Total 98.03 98.03 98.03
42

Consolidated balance sheet
(` billion) Jun 30, 2018 Mar 31, 2019 Jun 30, 2019
Cash & bank balances 701.33 873.91 731.54
Investments 3,621.47 3,982.01 4,233.89
Advances 5,722.39 6,469.62 6,259.17
Fixed & other assets 942.71 1,062.40 1,010.12
Total assets 10,987.90 12,387.94 12,504.72
Net worth 1,107.60 1,142.53 1,167.52
Minority interest 60.80 65.81 67.43
Deposits 5,736.36 6,813.17 6,910.34
Borrowings 2,098.19 2,103.24 2,082.15
Liabilities on policies in force 1,351.45 1,523.79 1,557.44
Other liabilities 633.50 739.40 719.84
Total liabilities 10,987.90 12,387.94 12,504.72
43

Retail NPAs
44
Retail NPAs (` billion) Jun 30, 2018 Mar 31, 2019 Jun 30, 2019
Gross retail NPAs 53.44 60.22 69.73
- as a % of gross retail advances 1.78% 1.69% 1.90%
Net retail NPAs 22.57 25.33 29.61
- as a % of net retail advances 0.76% 0.72% 0.81%

Corporate and SME: BB and below
45
(` billion) March 31,
2019
June 30,
2019
BB and below outstanding1,2,3,4,5
175.25 153.55
- Gross restructured loans 3.49 1.51
- Non-fund o/s to restructured loans 2.15 0.91
- Non-fund o/s to non-performing loans 42.206
36.276
- Other borrowers with o/s greater than ` 1.00 bn 78.00 71.897
- Other borrowers with o/s less than ` 1.00 bn 49.41 42.97
1. Fund-based and non-fund based outstanding
2. Excludes banks
3. Excludes investments
4. Excludes fund-based outstanding to NPAs
5. Excluded cases downgraded from investment grade and classified as NPL during the quarter
6. Provisions of ` 13.51 billion were held against non-fund o/s to non-performing loans at June 30, 2019
(Mar 31, 2019: ` 15.91 billion)
7. Includes fund based outstanding of ` 12.95 billion to borrowers where flexible structuring under 5/25
scheme has been implemented and fund based outstanding of ` 5.29 billion and non-fund based
outstanding of ` 15.75 billion to borrowers where S4A has been implemented

Portfolio composition over the years
46
% of total advances Mar 31,
2016
Mar 31,
2017
Mar 31,
2018
Mar 31,
2019
Jun 30,
2019
Retail 46.6% 51.8% 56.6% 60.2% 61.4%
SME 4.3% 4.8% 5.0% 5.2% 4.9%
Domestic corporate 27.5% 27.3% 25.8% 23.9% 23.6%
International1
21.6% 16.1% 12.6% 10.7% 10.1%
Total advances (` billion) 4,353 4,642 5,124 5,866 5,924
1. Includes impact of exchange rate movement

Sector-wise exposures
47
Top 10 sectors1: % of total
exposure of the Bank
Mar 31,
2016
Mar 31,
2017
Mar 31,
2018
Mar 31,
2019
Jun 30,
2019
Retail finance 27.1% 31.9% 34.2% 37.3% 38.5%
Services – finance 4.9% 6.2% 7.0% 7.3% 7.2%
Banks 8.0% 6.0% 8.4% 7.9% 7.1%
Electronics & engineering 7.3% 6.9% 6.7% 6.6% 6.5%
Crude petroleum/refining &
petrochemicals
5.7% 5.5% 5.6% 5.7% 5.9%
Road, port, telecom, urban
development & other infra
5.8% 5.3% 4.2% 4.6% 4.7%
Power 5.4% 5.1% 4.6% 3.3% 3.5%
Wholesale/retail trade 2.8% 2.5% 2.8% 3.1% 3.0%
Services - non finance 4.9% 4.0% 3.3% 3.1% 2.9%
Construction 3.4% 3.1% 3.2% 2.9% 2.8%
Total (` billion) 9,428 9,372 10,265 11,207 11,261
1. Top 10 based on position at June 30, 2019

Consolidated capital adequacy
48
Basel III (%) March 31, 2019 June 30, 20191
Total capital 16.47% 15.87%
- Tier I 14.73%2
14.27%
- Tier II 1.74%2
1.60%
1. As per Basel III guidelines, includes profit for Q1-2020
2. In Q4-2019, ` 12.69 billion transferred from CET-1 capital to the investment fluctuation reserve which is
reckoned under Tier II capital

Extensive franchise
49
Branches At Mar 31,
2017
At Mar 31,
2018
At Mar 31,
2019
At Jun 30,
2019
% share at
Jun 30, 2019
Metro 1,440 1,443 1,438 1,444 30%
Urban 990 991 991 992 20%
Semi urban 1,444 1,449 1,453 1,453 30%
Rural 976 984 992 993 20%
Total branches 4,850 4,867 4,874 4,882 100%
Total ATMs 13,882 14,367 14,987 15,101 -
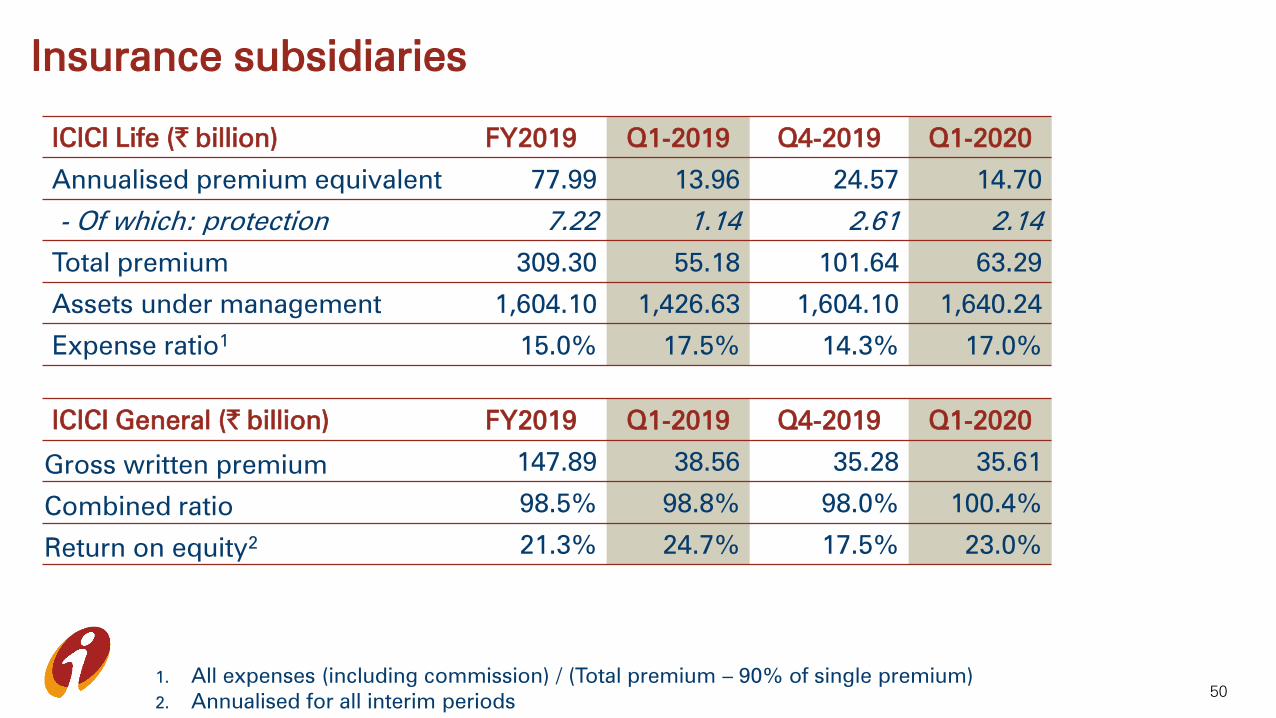
Insurance subsidiaries
50
ICICI Life (` billion) FY2019 Q1-2019 Q4-2019 Q1-2020
Annualised premium equivalent 77.99 13.96 24.57 14.70
- Of which: protection 7.22 1.14 2.61 2.14
Total premium 309.30 55.18 101.64 63.29
Assets under management 1,604.10 1,426.63 1,604.10 1,640.24
Expense ratio1
15.0% 17.5% 14.3% 17.0%
1. All expenses (including commission) / (Total premium – 90% of single premium)
2. Annualised for all interim periods
ICICI General (` billion) FY2019 Q1-2019 Q4-2019 Q1-2020
Gross written premium 147.89 38.56 35.28 35.61
Combined ratio 98.5% 98.8% 98.0% 100.4%
Return on equity2 21.3% 24.7% 17.5% 23.0%

ICICI Bank UK
51
(USD million) FY2019 Q1-2019 Q4-2019 Q1-2020
Net interest income70.5 16.7 19.9 17.0
Loans and advances2,442.5 2,348.6 2,442.5 2,342.0
Deposits2,140.8 1,768.5 2,140.8 2,241.7
- Retail term deposits677.1 280.6 677.1 729.1
Capital adequacy ratio16.8% 16.4% 16.8% 17.7%
- Tier I12.9% 14.0% 12.9% 13.9%
• Net impaired loans decreased from USD 63.1 million at March 31, 2019 to
USD 60.7 million at June 30, 2019

ICICI Bank UK1
52
1. At June 30, 2019
2. Includes cash & advances to banks, T Bills and reverse repo
3. Includes securities re-classified to loans & advances
Asset profileLiability profile
Total liabilities: USD 4.1 bnTotal assets: USD 4.1 bn
ICICI Bank Canada
53
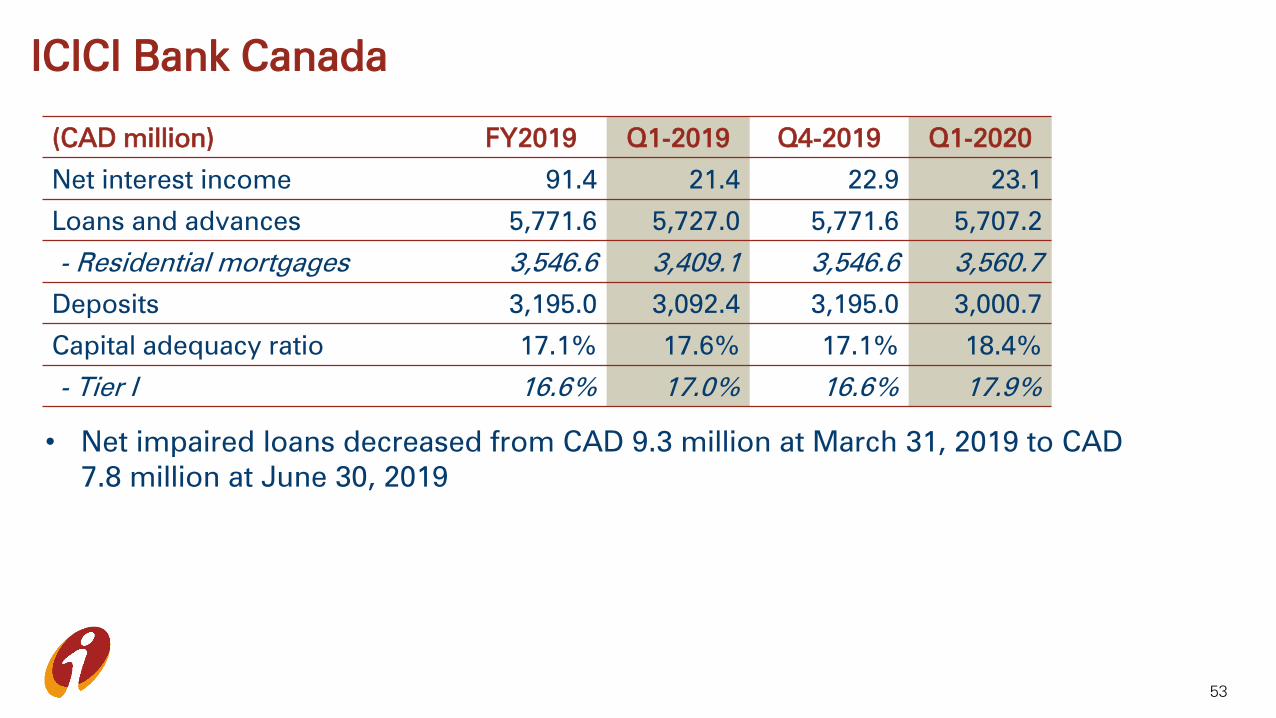
(CAD million) FY2019 Q1-2019 Q4-2019 Q1-2020
Net interest income 91.4 21.4 22.9 23.1
Loans and advances 5,771.6 5,727.0 5,771.6 5,707.2
- Residential mortgages 3,546.6 3,409.1 3,546.6 3,560.7
Deposits 3,195.0 3,092.4 3,195.0 3,000.7
Capital adequacy ratio 17.1% 17.6% 17.1% 18.4%
- Tier I 16.6% 17.0% 16.6% 17.9%
• Net impaired loans decreased from CAD 9.3 million at March 31, 2019 to CAD
7.8 million at June 30, 2019
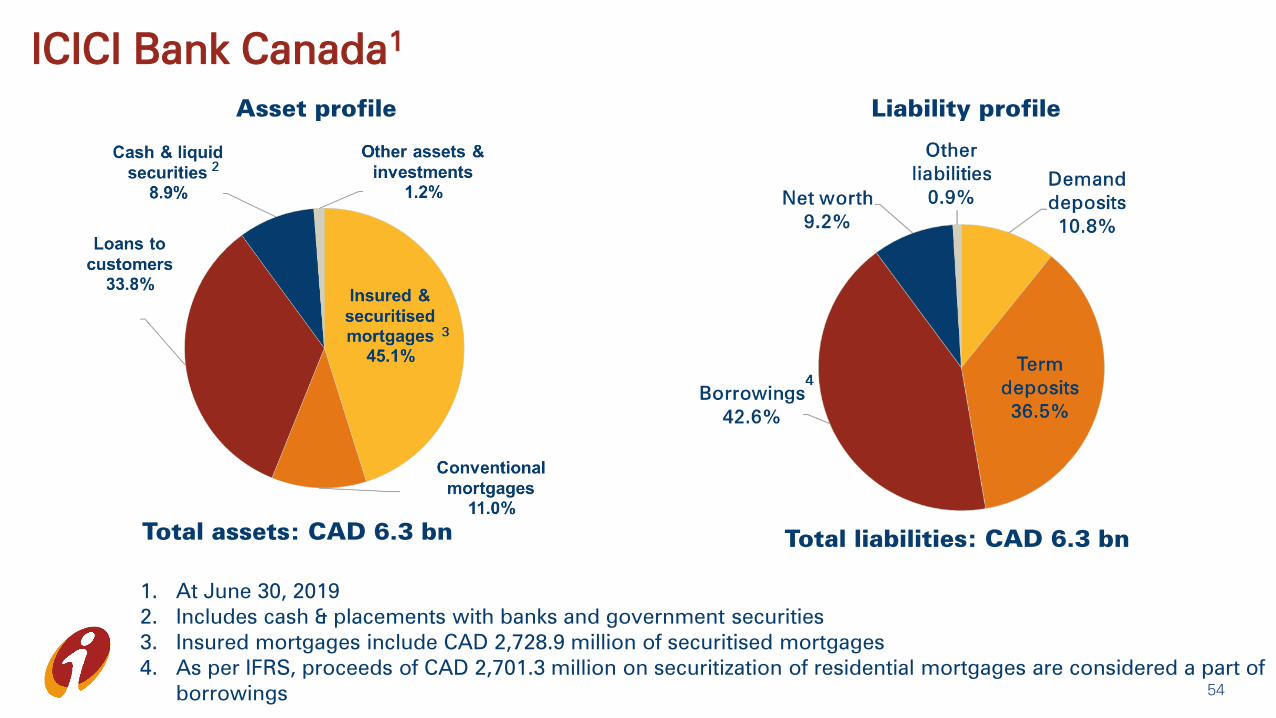
ICICI Bank Canada1
54
Liability profileAsset profile
Total liabilities: CAD 6.3 bnTotal assets: CAD 6.3 bn
1. At June 30, 2019
2. Includes cash & placements with banks and government securities
3. Insured mortgages include CAD 2,728.9 million of securitised mortgages
4. As per IFRS, proceeds of CAD 2,701.3 million on securitization of residential mortgages are considered a part of
borrowings

ICICI Home Finance1
55
(` billion) March 31, 2019 June 30, 2019
Loans and advances 133.33 141.71
Gross impaired loans (stage 3)2
7.44 7.65
Net impaired loans (stage 3) 4.46 4.57
Capital adequacy ratio3
17.98% 16.08%
1. As per Ind AS
2. Includes commercial real estate loans of ` 4.72 billion at June 30, 2019 (March 31, 2019: ` 4.84 billion)
3. As per NHB guidelines

1
Analyst call on July 27, 2019: opening remarks
Certain statements in this release relating to a future period of time (including inter
alia concerning our future business plans or growth prospects) are forward-looking
statements intended to qualify for the 'safe harbor' under applicable securities laws
including the US Private Securities Litigation Reform Act of 1995. Such forward-
looking statements involve a number of risks and uncertainties that could cause
actual results to differ materially from those in such forward-looking statements.
These risks and uncertainties include, but are not limited to statutory and regulatory
changes, international economic and business conditions; political or economic
instability in the jurisdictions where we have operations, increase in non-
performing loans, unanticipated changes in interest rates, foreign exchange rates,
equity prices or other rates or prices, our growth and expansion in business, the
adequacy of our allowance for credit losses, the actual growth in demand for
banking products and services, investment income, cash flow projections, our
exposure to market risks, changes in India’s sovereign rating, as well as other risks
detailed in the reports filed by us with the United States Securities and Exchange
Commission. Any forward-looking statements contained herein are based on
assumptions that we believe to be reasonable as of the date of this release. ICICI
Bank undertakes no obligation to update forward-looking statements to reflect
events or circumstances after the date thereof. Additional risks that could affect our
future operating results are more fully described in our filings with the United States
Securities and Exchange Commission. These filings are available at www.sec.gov.

2
Mr. Bakhshi’s opening remarks
Good evening to all of you and welcome to the ICICI Bank
Earnings Call to discuss the Q1-2020 results. Joining us today on
this call are our Executive Directors – Vishakha and Anup;
Executive Director Designate – Sandeep Batra; Group Chief
Financial Officer – Rakesh and our Head of Investor Relations -
Anindya.
Our core operating profit increased by 21.2% year-on-year to
61.10 billion Rupees in Q1 of 2020. The core operating profit,
excluding dividend income from subsidiaries, increased by
25.3% year-on-year to 59.19 billion Rupees in Q1 of 2020.
We continued to see healthy growth in our funding. As we had
expected and indicated earlier, the growth in term deposits has
outpaced the growth in CASA deposits reflecting the systemic
trends and the growth opportunity on the credit side for well-
capitalised banks with strong customer franchises. Total deposits
grew by 20.8% year-on-year, from 5.5 trillion Rupees to 6.6 trillion
Rupees as of June 30, 2019. The average CASA deposits
increased by 12.3% year-on-year in Q1 of 2020.
On the assets side, the domestic loan book grew by 17.9% year-
on-year at June 30, 2019 driven by retail loans, which grew by
22.4% year-on-year. The overall loan growth was 14.7% year-on-
year.

3
The Bank continued its digital initiatives with the launch of
‘Instabiz’, designed specially for MSMEs and self-employed
customers, to enable them to undertake their business banking
transactions digitally. Customers can avail as many as over 115
products and services in a digital and secure manner on their
mobile phone or through internet banking.
During the quarter, the Bank’s iMobile app was named the top
mobile banking app in India in a report published by Forrester.
With respect to asset quality, the gross NPA additions during the
quarter were 27.79 billion Rupees.
We had mentioned on our previous call that credit costs in
FY2020 are expected to reduce significantly compared to FY2019
and be in the range of 1.2% to 1.3% of average advances. There
would be variance in credit costs across quarters based on the
timing of ageing based provisions on existing NPAs and the
resolution of NPAs. Provisions as a percentage of average
advances reduced from 3.67% in FY2019 to 2.40% in Q1 of 2020.
While the NPA additions and gross provisions for the quarter
were in line with expectations, recoveries were lower especially
due to delay in resolution of a steel account in NCLT. The
provision coverage ratio excluding technical write-offs increased
from 54.1% as of June 30, 2018 to 74.0% as of June 30, 2019.
The net NPA ratio declined from 4.19% at June 30, 2018 to 1.77%
at June 30, 2019. The corporate and SME BB and below portfolio
was 153.55 billion Rupees compared to 246.29 billion Rupees as
of June 30, 2018.

4
As we have mentioned in the past, we are not targeting any
particular level of loan growth. Our focus is on growing the core
operating profit in a risk calibrated manner. We are seeking to
improve our share of profitable market opportunities by making
our delivery to the customer more seamless and frictionless
through digitization and process improvements.
In wholesale banking, we continue to focus on lending to higher
rated corporates and maintaining limits on concentration risk. In
Q1-2020, about 88.5% of the disbursements in the domestic and
international corporate portfolio were to corporates rated A- and
above. We are further refining our approach towards longer term
exposures.
Our SME portfolio is relatively small and we have scope to
increase penetration in this segment, covering both credit as well
as deposits and transaction banking. We focus on granular and
collateralized lending. We have recently reorganised our SME
business, with the retail business group focusing on enterprises
having a turnover of less than 2.5 billion Rupees, the mid-market
group focusing on enterprises with turnover of 2.5 to 7.5 billion
Rupees and enterprises with turnover greater than 7.5 billion
Rupees being aligned with the corporate banking group.
Our business banking portfolio primarily comprises secured
small ticket lending. We see this as a segment with high potential
for growth, given our historically lower presence in this segment.

5
The introduction of the Goods & Services Tax has given an
impetus to formalization and the ability to assess credit in this
segment. We are expanding our digital offerings for small
business customers.
The home loan portfolio comprising mortgages and loan against
property accounts for about 50% of our retail portfolio and 31%
of our overall loan portfolio. This portfolio has performed well
across cycles. We monitor the risk of construction delays in
properties we have financed and also monitor builders across
various micro-markets. The credit filters are re-calibrated
regularly based on the results of this exercise. The loan-against-
property portfolio is granular, with conservative loan-to-value
and lending based on cash flows of business/individuals with
limited reliance on the value of collateral.
Among the other non-mortgage retail products, the rural portfolio
accounts for about 8% of the overall loan portfolio. Within this,
gold loans comprise about 2% of the total portfolio and kisan
credit cards comprise about 3% of the total loan portfolio. Auto
loans and commercial business loans, which includes
commercial vehicle financing, account for 5% and 4% of the
overall portfolio respectively.
Personal loans and credit cards are about 8% of our overall
portfolio. We have grown this portfolio from a low base primarily
through cross-sell. The portfolio largely comprises salaried
customers. We use multiple credit filters to assess the customer’s

6
overall credit behaviour. These include models to identify and
exclude customers who can potentially get over-leveraged.
Based on portfolio analytics, we implement necessary mitigants
such as revising target income segments and calibrating sourcing
from identified segments or locations. The credit quality of the
personal loan and credit card book continues to remain stable.
Our approach to retail credit is based on assessment of risk
across customer segments and profiles, and product categories,
in a granular and focused manner. Overall, the credit quality of
the retail book has held up well. Based on credit bureau data, our
delinquency levels across various products are below industry
average. We expect the credit costs to remain within our
tolerance levels and our overall outlook on credit costs.
We continue to be focused on achieving a consolidated return on
equity of 15.0% by the quarter ended June 2020.
With these opening remarks, I will now hand the call over to
Rakesh.

7
Mr. Jha’s remarks
Thank you, Sandeep. I will talk about the P&L details, our
performance on growth, credit quality, performance of
subsidiaries and capital during Q1 of 2020.
A. P&L Details
Net interest income increased by 26.8% to 77.37 billion Rupees,
driven by both loan growth and an increase in margins. The net
interest margin was at 3.61% this quarter compared to 3.72% in
Q4 of 2019 and 3.19% in Q1 of 2019. There was interest on
income tax refund of 1.84 billion Rupees this quarter compared
to 4.14 billion Rupees in Q4 of 2019 and 0.08 billion Rupees in Q1
of 2019. The impact of interest on income tax refund on net
interest margin was about 9 basis points this quarter compared
to about 20 basis points in Q4 of 2019. The impact of interest
collection from NPAs was about 8 basis points this quarter
compared to 5 basis points in Q4 of 2019.
The domestic NIM was at 3.93% in Q1 of 2020 compared to
4.12% in Q4 of 2019 and 3.54% in Q1 of 2019. International
margins were at 0.33% in Q1 of 2020 compared to 0.03% in Q4
of 2019 and 0.30% in Q1 of 2019. The Bank recently reduced its
MCLR by 10 basis points across tenors.

8
Total non-interest income was 34.26 billion Rupees in Q1 of 2020
compared to 38.51 billion Rupees in Q1 of 2019.
Fee income grew by 10.3% year-on-year to 30.39 billion
Rupees in Q1 of 2020. Retail fee income grew by 6.6%
year-on-year and constituted about 72% of overall fees
in Q1 of 2020. The lower growth in retail fee income was
due to decrease in fee income from distribution of third
party products. Excluding income from distribution of
mutual funds, fee income grew by 14.3% in Q1 of 2020.
Treasury recorded a profit of 1.79 billion Rupees this
quarter compared to 7.66 billion Rupees in Q1 of 2019.
Treasury income in Q1 of 2019 last year included gains
of 11.10 billion Rupees from sale of 2% stake in ICICI Life.
Dividend income from subsidiaries was 1.91 billion
Rupees in Q1 of 2020 compared to 3.17 billion Rupees in
Q1 of 2019. Dividend income from subsidiaries in Q1 of
2019 included dividend from ICICI Prudential Life
Insurance.
On Costs: The Bank’s operating expenses increased by 17.6%
year-on-year in Q1 of 2020. The cost-to-income ratio, excluding
gains from stake sale in subsidiaries, was 43.7% in Q1 of 2020
compared to 46.9% in Q1 of 2019 and 44.8% in FY2019. During
the quarter, employee expenses increased by 29.0% year-on-
9
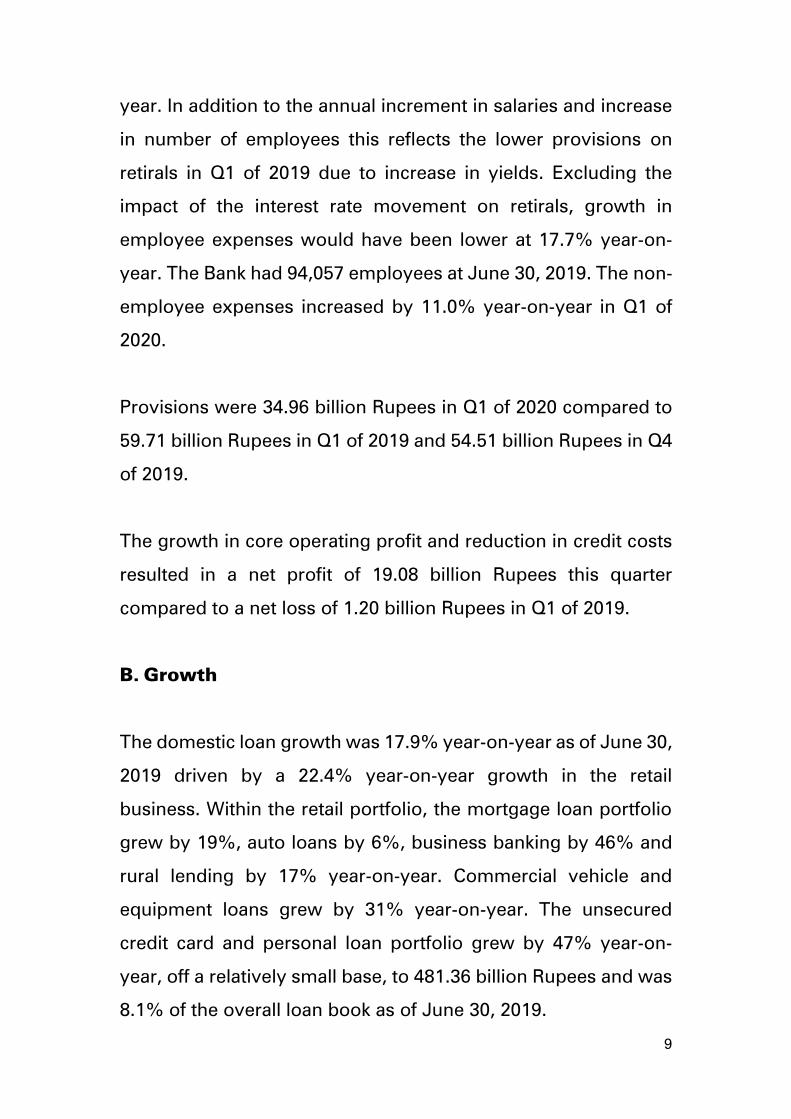
year. In addition to the annual increment in salaries and increase
in number of employees this reflects the lower provisions on
retirals in Q1 of 2019 due to increase in yields. Excluding the
impact of the interest rate movement on retirals, growth in
employee expenses would have been lower at 17.7% year-on-
year. The Bank had 94,057 employees at June 30, 2019. The non-
employee expenses increased by 11.0% year-on-year in Q1 of
2020.
Provisions were 34.96 billion Rupees in Q1 of 2020 compared to
59.71 billion Rupees in Q1 of 2019 and 54.51 billion Rupees in Q4
of 2019.
The growth in core operating profit and reduction in credit costs
resulted in a net profit of 19.08 billion Rupees this quarter
compared to a net loss of 1.20 billion Rupees in Q1 of 2019.
B. Growth
The domestic loan growth was 17.9% year-on-year as of June 30,
2019 driven by a 22.4% year-on-year growth in the retail
business. Within the retail portfolio, the mortgage loan portfolio
grew by 19%, auto loans by 6%, business banking by 46% and
rural lending by 17% year-on-year. Commercial vehicle and
equipment loans grew by 31% year-on-year. The unsecured
credit card and personal loan portfolio grew by 47% year-on-
year, off a relatively small base, to 481.36 billion Rupees and was
8.1% of the overall loan book as of June 30, 2019.

10
Excluding net NPAs and restructured loans at June 30, 2019,
growth in the domestic corporate portfolio was about 13.2%
year-on-year.
The total SME portfolio grew by 23.5% year-on-year at June 30,
2019. It now comprises 4.9% of the loan portfolio.
The net advances of the overseas branches decreased by 7.5%
year-on-year in Rupee terms and 8.2% year-on-year in US dollar
terms at June 30, 2019.
As a result of the above, the overall loan portfolio grew by 14.7%
year-on-year at June 30, 2019.
Retail loans as a proportion of total loans was 61.4% as of June
30, 2019. Including non-fund based outstanding, the share of the
retail portfolio was 48.5% of the total portfolio as of June 30,
2019. The international loan portfolio was 10.1% of the overall
loan book as of June 30, 2019.
Coming to the funding side: The term deposits increased by
33.7% year-on-year, from 2.71 trillion Rupees to 3.62 trillion
Rupees. CASA deposits grew by 8.2% year-on-year to 3.0 trillion
Rupees at June 30, 2019. On a daily average basis, the CASA
ratio was 43.4% in Q1 of 2020. As we had mentioned in our
previous earning call, the average CASA ratio is likely to decline
for the banking system, including us. We will be focused on

11
growing retail term deposits and our CASA deposits in absolute
terms. Our endeavour would be to maintain a healthy and stable
funding profile and our competitive advantage in cost of funds.
During the quarter, the peak interest rate on term deposits was
reduced by 20 basis points to 7.3%.
C. Credit Quality
The gross non-performing assets were 457.63 billion Rupees at
June 30, 2019 compared to 534.65 billion Rupees at June 30,
2018.
During the quarter, the retail portfolio saw gross NPA additions
of 15.11 billion Rupees and recoveries and upgrades of 5.09
billion Rupees. Gross retail NPA additions during the quarter
included slippages of about 4.5 billion Rupees from the kisan
credit card portfolio. We will continue to see higher NPA
additions from this portfolio in Q3 of this year and in the first and
third quarter next year.
Out of the corporate and SME gross NPA additions of 12.68
billion Rupees, 11.63 billion Rupees were from the BB and below
portfolio as of March 31, 2019. These include 5.43 billion Rupees
of devolvement of non-fund based outstanding to existing NPAs,
slippages from restructured loans of 1.86 billion Rupees and 4.34
billion Rupees from other loans rated BB and below.

12
The recoveries and upgrades were 9.31 billion Rupees in Q1 of
2020. The Bank sold gross NPAs aggregating 1.77 billion Rupees
for cash during Q1 of 2020. The gross NPAs written-off during the
quarter aggregated to 22.00 billion Rupees.
The net non-performing assets were 118.57 billion Rupees at
June 30, 2019 compared to 241.70 billion Rupees at June 30,
2018.
As of June 30, 2019, the loans and non-fund based outstanding
to borrowers rated BB and below (excluding NPAs) decreased
from 175.25 billion Rupees as of March 31, 2019 to 153.55 billion
Rupees at June 30, 2019. The gross fund-based and non-fund
based outstanding to standard restructured borrowers was 2.42
billion Rupees as of June 30, 2019 compared to 5.64 billion
Rupees as of March 31, 2019. The gross non-fund based
outstanding to non-performing loans, was 36.27 billion Rupees
as of June 30, 2019 compared to 42.20 billion Rupees as of March
31, 2019. The Bank holds provisions of 13.51 billion Rupees as of
June 30, 2019 against this non-fund based outstanding. The
balance 114.86 billion Rupees of fund-based and non-fund based
outstanding to borrowers rated BB and below at June 30, 2019
includes 71.89 billion Rupees related to cases with an outstanding
greater than 1.00 billion Rupees and 42.97 billion Rupees related
to cases with an outstanding of less than 1.00 billion Rupees. On
slide 19 of the presentation, we have provided the movement in
our BB and below portfolio during Q1 of 2020.

13
There were rating upgrades to the investment grade
categories and a net decrease in outstanding of 16.18 billion
Rupees. Upgrades include one account in the iron & steel
sector.
The rating downgrades from investment grade categories
were 7.16 billion Rupees. The downgrades from investment
grade categories were granular in nature.
Lastly, there was a reduction of 12.68 billion Rupees due to
slippage of some borrowers into the non-performing
category. This includes cases which were downgraded
from the investment grade category during the quarter.
The loan, investment and non-fund based outstanding to NBFCs
was 264.85 billion Rupees at June 30, 2019 compared to 293.68
billion Rupees at March 31, 2019. The loan, investment and non-
fund based outstanding to HFCs was 155.16 billion Rupees at
June 30, 2019 compared to 138.58 billion Rupees at March 31,
2019. The loans to NBFCs and HFCs were about 5% of our total
outstanding loans at June 30, 2019. The increase in outstanding
to HFCs is to companies which are well rated and owned by well-
established corporate groups.
The builder portfolio including construction finance, lease rental
discounting, term loans and working capital loans was 202.49
billion Rupees at June 30, 2019 compared to 196.33 billion
Rupees at March 31, 2019 and 169.90 billion Rupees at June 30,
2018.

14
D. Subsidiaries
The details of the financial performance of subsidiaries is covered
in slides 27 to 28 and 50 to 55 in the investor presentation. I will
briefly talk about the major highlights. The financials of ICICI
Securities, ICICI Securities Primary Dealership, ICICI AMC and
ICICI HFC have been prepared as per Ind AS. The financial
statements of these subsidiaries used for consolidated financials
have been prepared as per Indian GAAP.
Value of new business of ICICI Life increased by 26.6% year-on-
year to 3.09 billion Rupees in Q1 of 2020. The new business
margin increased to 21.0% in Q1 of 2020 from 17.0% in FY2019.
The protection based annualised premium equivalent increased
by 87.7% year-on-year to 2.14 billion Rupees and accounted for
14.6% of the total annualised premium equivalent in Q1 of 2020.
The profit after tax of ICICI General increased by 7.1% year-on-
year to 3.10 billion Rupees in Q1 of 2020. The company’s
combined ratio was 100.4% in Q1 of 2020 compared to 98.8% in
Q1 of 2019. The return on equity on an annualized basis was
23.0% in Q1 of 2020.
The profit after tax of ICICI AMC increased from 0.76 billion
Rupees in Q1 of 2019 to 2.19 billion Rupees in Q1 of 2020.
15
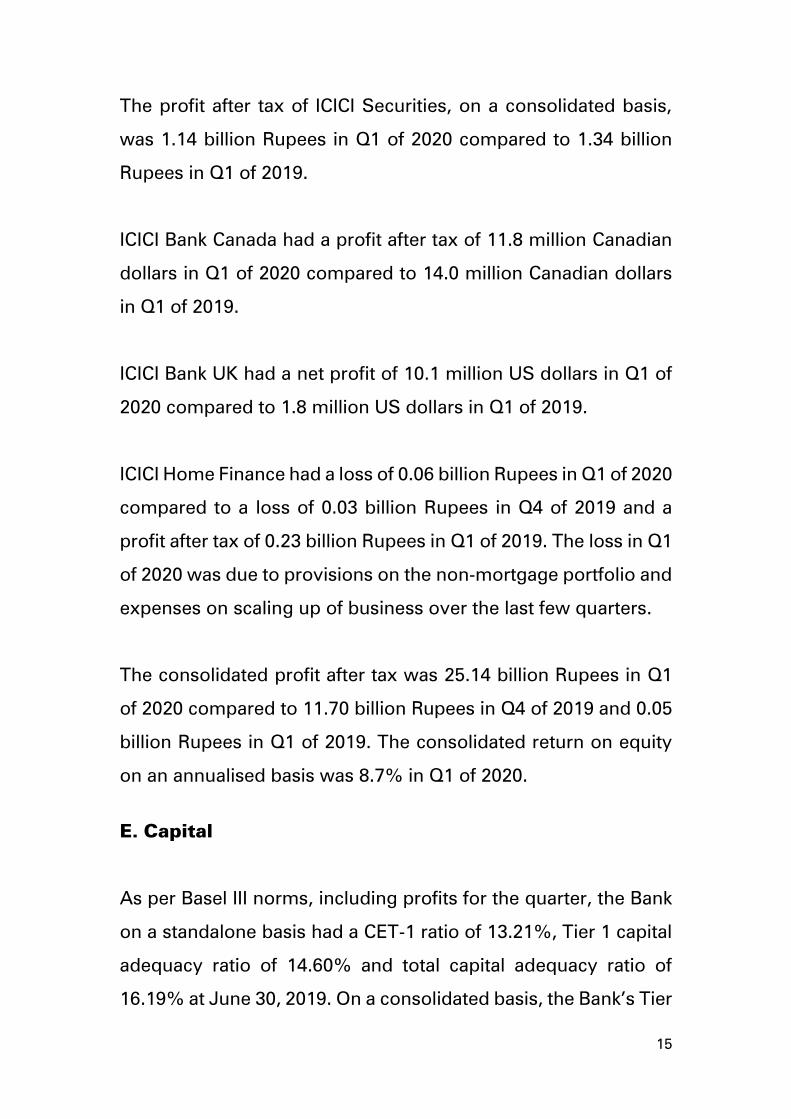
The profit after tax of ICICI Securities, on a consolidated basis,
was 1.14 billion Rupees in Q1 of 2020 compared to 1.34 billion
Rupees in Q1 of 2019.
ICICI Bank Canada had a profit after tax of 11.8 million Canadian
dollars in Q1 of 2020 compared to 14.0 million Canadian dollars
in Q1 of 2019.
ICICI Bank UK had a net profit of 10.1 million US dollars in Q1 of
2020 compared to 1.8 million US dollars in Q1 of 2019.
ICICI Home Finance had a loss of 0.06 billion Rupees in Q1 of 2020
compared to a loss of 0.03 billion Rupees in Q4 of 2019 and a
profit after tax of 0.23 billion Rupees in Q1 of 2019. The loss in Q1
of 2020 was due to provisions on the non-mortgage portfolio and
expenses on scaling up of business over the last few quarters.
The consolidated profit after tax was 25.14 billion Rupees in Q1
of 2020 compared to 11.70 billion Rupees in Q4 of 2019 and 0.05
billion Rupees in Q1 of 2019. The consolidated return on equity
on an annualised basis was 8.7% in Q1 of 2020.
E. Capital
As per Basel III norms, including profits for the quarter, the Bank
on a standalone basis had a CET-1 ratio of 13.21%, Tier 1 capital
adequacy ratio of 14.60% and total capital adequacy ratio of
16.19% at June 30, 2019. On a consolidated basis, the Bank’s Tier

16
1 capital adequacy ratio was 14.27% and the total capital
adequacy ratio was 15.87%. As per RBI guidelines, from April 1,
2019 onwards, the unrated exposure of borrowers having
banking system exposure greater than 200 crore Rupees is to be
risk-weighted at 150% compared to 100% earlier. This has
resulted in an impact of about 39 basis points on the CET-1 ratio
of the Bank.
With this, I conclude my opening remarks and we will now be
happy to take your questions.