Embed Size (px)
Citation preview

1
Northern Arizona University: A University for the 21st Century
Liz Grobsmith, Provost and Vice President for Academic Affairs
Fred Hurst, Vice-President for Extended Programs September 29, 2004
2
NAU Mission
Provide an outstanding undergraduate residential
education strengthened by research, graduate and
professional programs and a responsive distance learning
network delivering programs throughout Arizona.
3
Interlocking Approaches
Graduate education and research
Distance Learning
Undergraduate residential education
ACCESS

4
Carnegie classificationsType Example # Doctorates
AwardedMaster's
Awarded
Bachelor’s
Awarded
Specialized ASU East 766
Baccalaureate 606 Min 50% all degrees
Master's II 115 Min. 20
Master's I ASU West 496 Min. 40
Doctoral Research Intensive
NAU 110 Min.10 in 3 disciplines
or min. 20
Doctoral
Research Extensive
UA, ASU Main 151 Min. 50
in 15 disciplines
Source: www.carnegiefoundation.org

5
Typical Characteristics of Doctoral Research Intensive Universities
Usually a strong economic force in their community
Most students are residents of the state
Usually do not participate in NCAA, Division I-A football
Many located in smaller communities
Balance of undergraduate education, graduate education and research
6
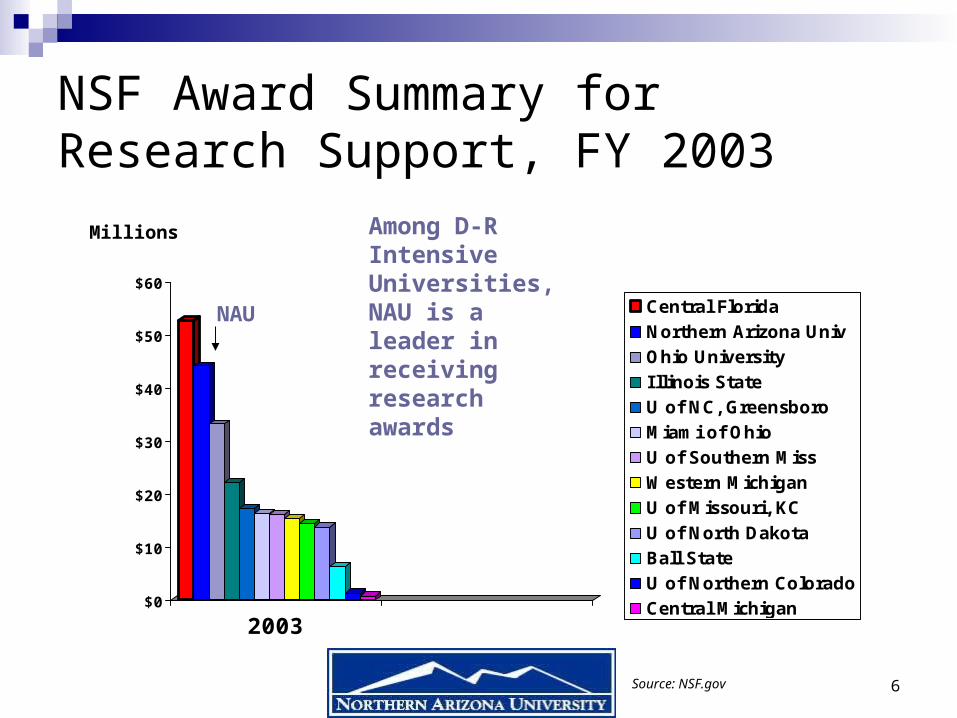
NSF Award Summary for Research Support, FY 2003
$0
$10
$20
$30
$40
$50
$60
2003
Central FloridaNorthern Arizona UnivOhio UniversityIllinois StateU of NC, GreensboroMiami of OhioU of Southern MissWestern MichiganU of Missouri, KCU of North DakotaBall StateU of Northern ColoradoCentral Michigan
Among D-R Intensive Universities, NAU is a leader in receiving research awards
NAU
Millions
Source: NSF.gov

7
Select Major Grant Awards Since 2001 (some multiple-year awards)
Department of Commerce Applied Research and Development Building
$2.5 million
Department of Education Gear-Up $6.0 million
Environmental Protection Agency Am. Indian Air Quality Training Program
$3.0 million
National Cancer Institute NAU/Arizona Cancer Center Research Partnership
$7.5 million (all participants)
National Science Foundation Large-Scale Wireless Sensor Networks
$1.5 million
Bureau of Land Management; Dep’t of Agriculture
Forest Restoration $2.1 million
8
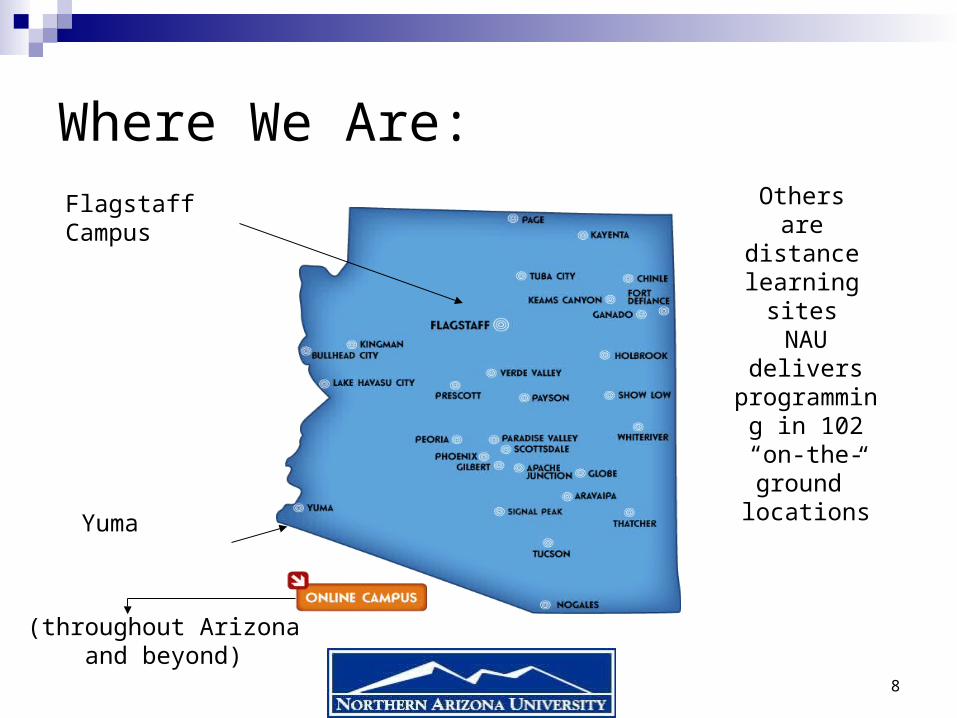
Where We Are:Flagstaff Campus
Yuma
(throughout Arizona and beyond)
Others are distance learning
sites
NAU delivers programming
in 102 “on-the-ground” locations

9
Fiscal Year 2004 All Funds Sources and Uses
Sources % of
All Funds FY 2004 Sources
State Appropriation 111,642,600 38.0%
Collections Revenue (tuition and fees) 70,820,903 24.1%
Government Grants and Contracts 52,117,453 17..7%
Auxiliary Enterprises 33,348,992 11.3%
Share of State Sales tax 9,564,155 3.2%
Other Sources 7,577,981 2.6%
Private Gifts, Grants and Contracts 7,151,700 2.4%
Investment Income 2,085,221 0.7%
TOTAL 294,309,005 100.0%
Source: NAU Annual Report, 2003-4

10
Student Demographics, Fall 2003
86%
14%
Resident
Non-Resident
•NAU students are overwhelmingly from Arizona
Source: NAU Planning and Institutional Research
11
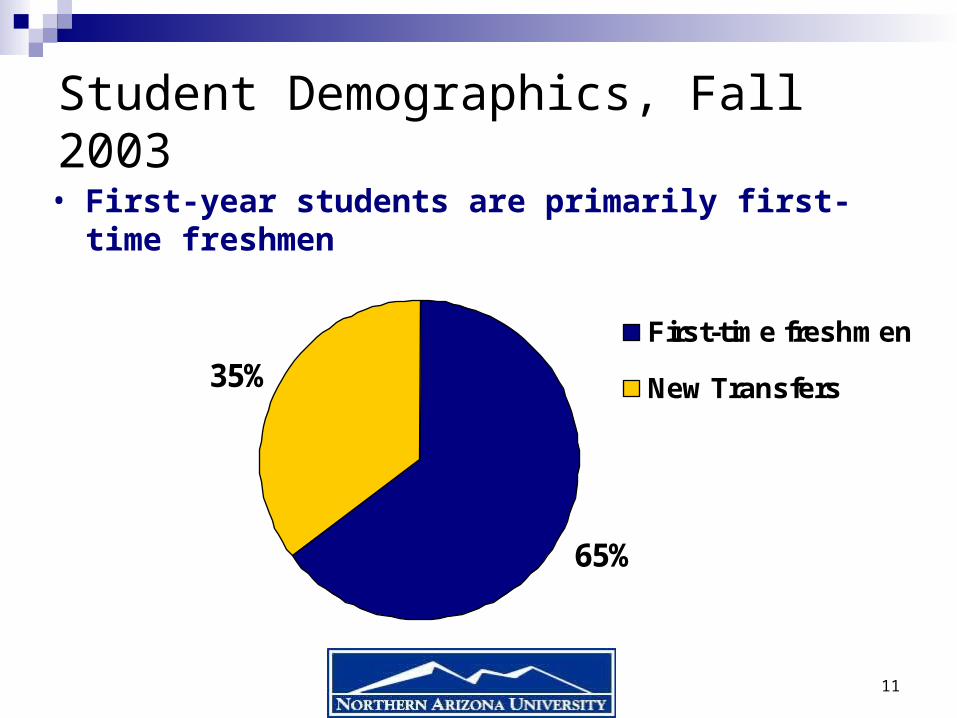
Student Demographics, Fall 2003
65%
35%First-time freshmen
New Transfers
• First-year students are primarily first-time freshmen

12
Student Demographics, Fall, 2003
FT Ugrad59%
PT Ugrad10%
FT Grad10%
PT Grad21%
•Undergraduates represent nearly 70% of all students
Source: NAU Planning and Institutional Research
13
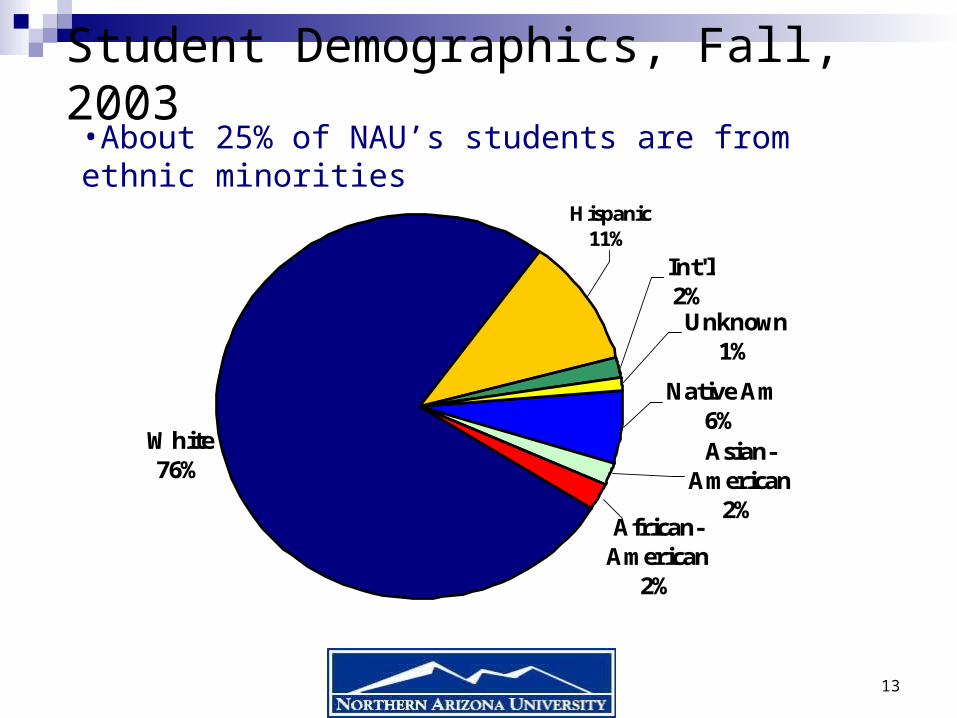
Student Demographics, Fall, 2003
White76%
Unknown1%
African-American
2%
Hispanic11%
Int'l2%
Asian-American
2%
Native Am 6%
•About 25% of NAU’s students are from ethnic minorities
14
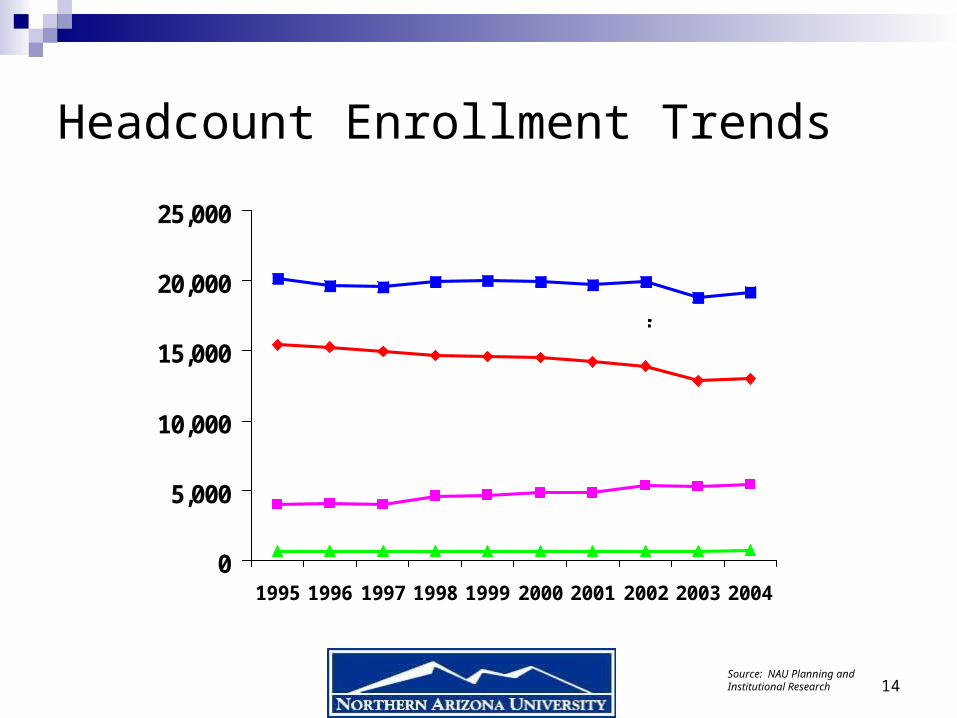
Headcount Enrollment Trends
0
5,000
10,000
15,000
20,000
25,000
1995 1996 1997 1998 1999 2000 2001 2002 2003 2004
TOTAL
Flagstaff
Distance Learning
Yuma
Source: NAU Planning and Institutional Research

15
All Faculty By Tenure Status and Location, Fall 2003
DistanceFull-time Flagstaff Yuma Learning
Tenured 442 7 Tenure-track 118 3 Non-tenure track 138 3
Total Full-Time 698 13Part-time
Tenured 4Tenure-track 2Non-tenure track 115 30 411
Total Part-Time 121 30 411 TOTAL ALL FACULTY 819 43 411
165 faculty who are full-time taught classes for distance learning, but they were not full-time distance learning faculty
16
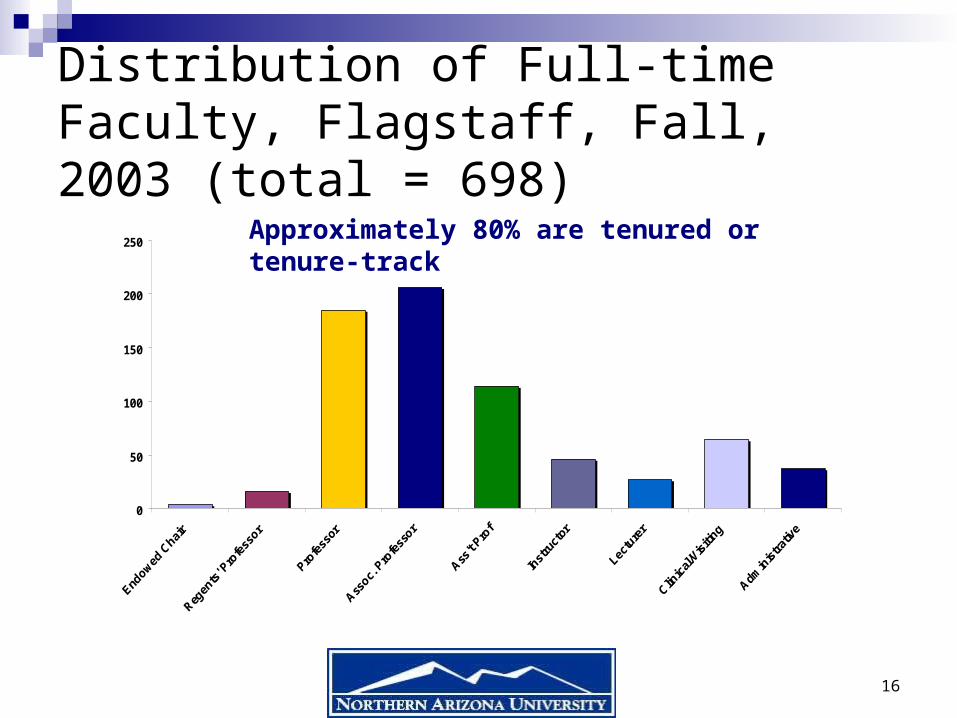
Distribution of Full-time Faculty, Flagstaff, Fall, 2003 (total = 698)
0
50
100
150
200
250 Approximately 80% are tenured or tenure-track
17
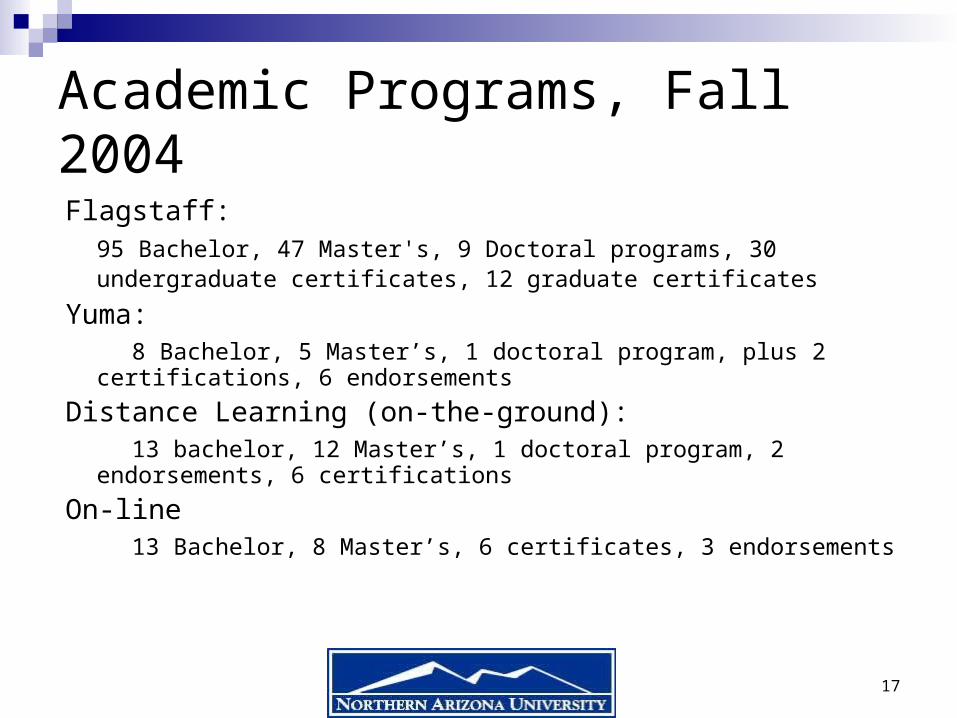
Academic Programs, Fall 2004
Flagstaff:95 Bachelor, 47 Master's, 9 Doctoral programs, 30 undergraduate certificates, 12 graduate certificates
Yuma: 8 Bachelor, 5 Master’s, 1 doctoral program, plus 2 certifications, 6
endorsements
Distance Learning (on-the-ground): 13 bachelor, 12 Master’s, 1 doctoral program, 2 endorsements, 6
certifications
On-line 13 Bachelor, 8 Master’s, 6 certificates, 3 endorsements

18
Total Degrees Granted, FY99-FY04
0
1,000
2,000
3,000
4,000
5,000
6,000
FY 99 FY00 FY01 FY02 FY03 FY04
Doctorate
Master
Bachelor
Source: NAU Planning and Institutional Research

19
FY2003 Graduate Degrees Granted
Northern Arizona
University
0 500 1000 1500 2000 2500 3000
Univ MINN-Duluth
UNIV of Vermont
MIAMI of OH
MONTANA
Univ NEV-RENO
Univ. of N. Dakota
Cal St. Fresno
Oakland U
Ball State
Univ of Delaware
UNLV
Bowling Green
Ohio U
Old Dominion
UNIV of Central FLA
Northern Arizona Univ
Univ of Ariz
Ariz State
Master'sDoctorate
Source: IPEDS, 2004
20
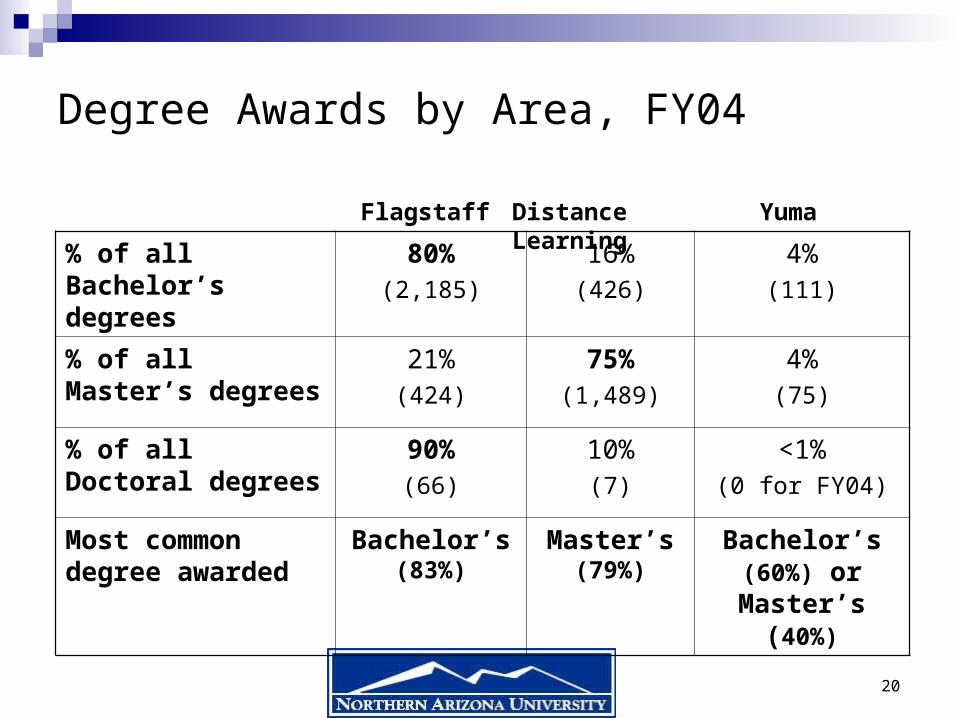
Degree Awards by Area, FY04
% of all Bachelor’s degrees
80%(2,185)
16%(426)
4%(111)
% of all Master’s degrees
21%(424)
75%(1,489)
4%(75)
% of all Doctoral degrees
90%(66)
10%(7)
<1%(0 for FY04)
Most common degree awarded
Bachelor’s (83%)
Master’s (79%)
Bachelor’s (60%) or
Master’s (40%)
Flagstaff Distance Learning Yuma
21
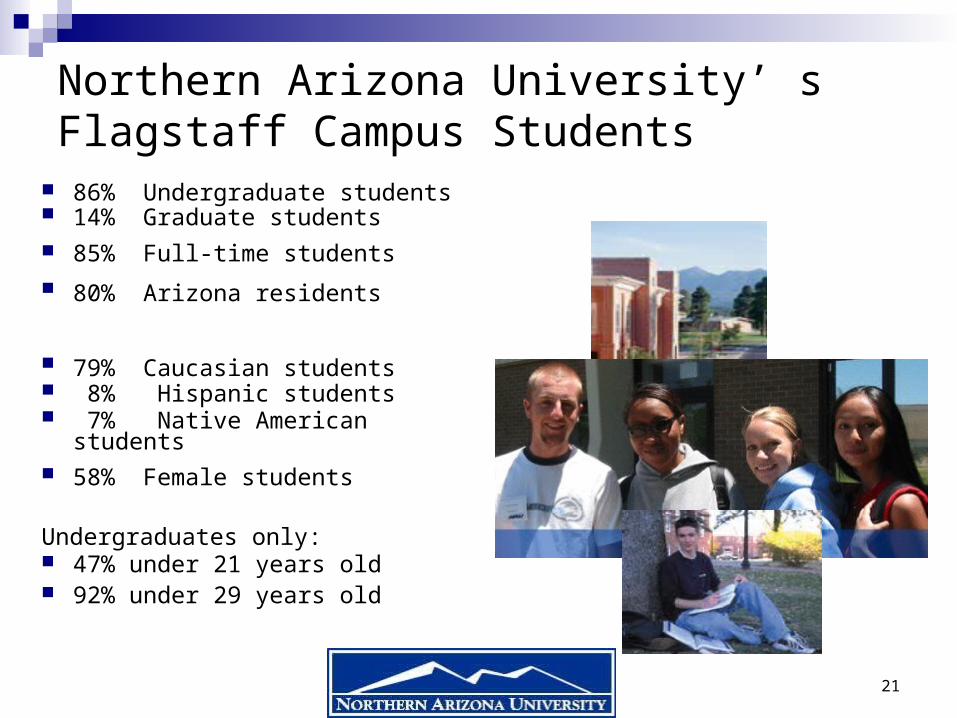
Northern Arizona University’ s Flagstaff Campus Students
86% Undergraduate students 14% Graduate students 85% Full-time students 80% Arizona residents
79% Caucasian students 8% Hispanic students 7% Native American students 58% Female students
Undergraduates only: 47% under 21 years old 92% under 29 years old

22
Northern Arizona University’s Distance Learning Students
76% Graduate students 24% Undergraduate students 77% Part-time students
99% Arizona residents
75% Caucasian students 14% Hispanic students 7% Native American students
An average age of 35 74% female students 57% in a Master’s program 18% in a non-degree or post-bac
program
23
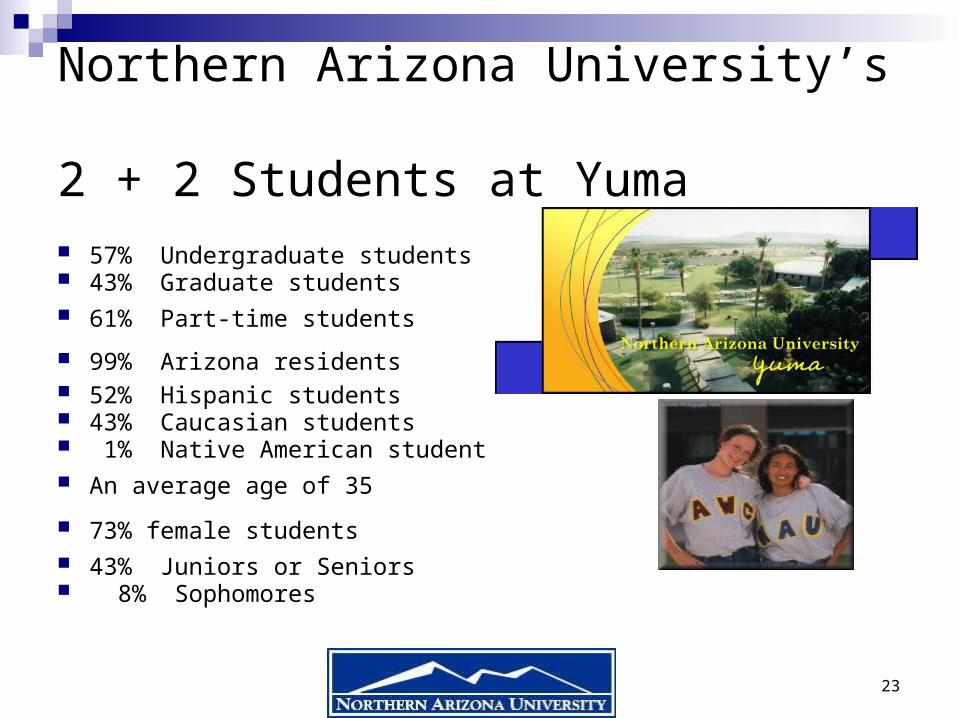
Northern Arizona University’s 2 + 2 Students at Yuma
57% Undergraduate students 43% Graduate students 61% Part-time students
99% Arizona residents 52% Hispanic students 43% Caucasian students 1% Native American student An average age of 35
73% female students 43% Juniors or Seniors 8% Sophomores
24
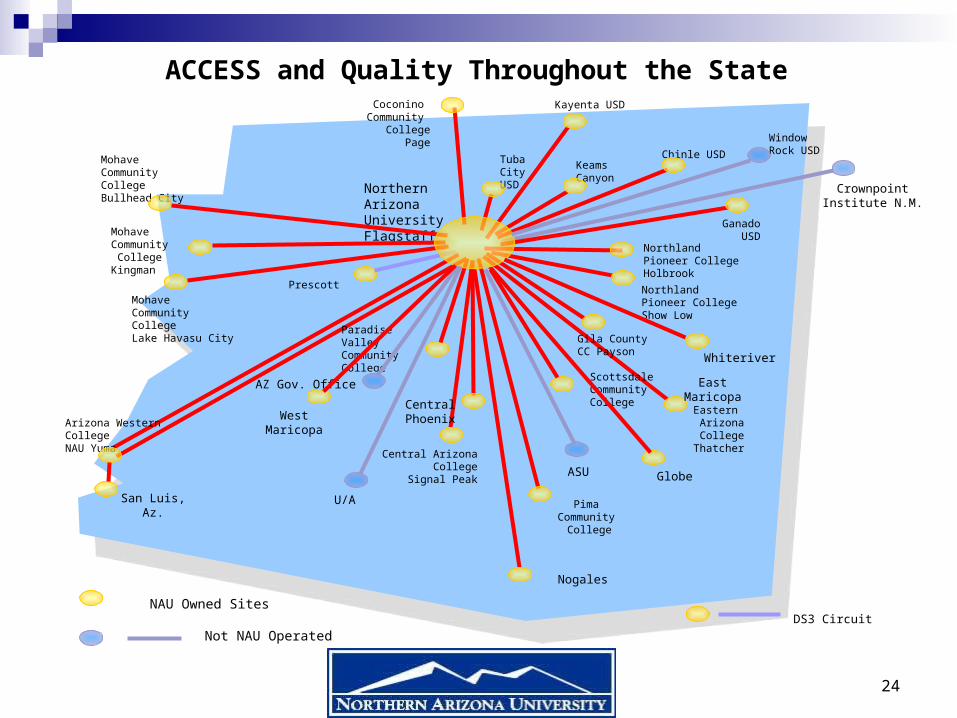
ACCESS and Quality Throughout the State
NAU Owned Sites
Not NAU Operated
Central ArizonaCollege
Signal Peak
Arizona WesternCollegeNAU Yuma
Pima Community
College
ScottsdaleCommunityCollege
Eastern ArizonaCollege
Thatcher
Paradise ValleyCommunity College
Gila CountyCC Payson
Northland Pioneer CollegeShow Low
NorthlandPioneer CollegeHolbrook
NorthernArizonaUniversityFlagstaff
Prescott Mohave CommunityCollegeLake Havasu City
Mohave CommunityCollegeBullhead City
Coconino Community
CollegePage
TubaCityUSD
KeamsCanyon
GanadoUSD
Chinle USD
Kayenta USD
WindowRock USD
Mohave Community CollegeKingman
DS3 Circuit
Globe
West Maricopa
East Maricopa
Nogales
Central Phoenix
Whiteriver
ASU
U/A
Crownpoint Institute N.M.
AZ Gov. Office
San Luis, Az.

25
0 200 400 600 800 1000 1200
East Maricopa
Tucson
Paradise Valley
Central Phoenix
West Maricopa
Yavapai
Signal Peak
Thatcher
Tuba City
Kayenta
Holbrook
Headcount at Selected Distance Learning Sites, Fall 2003*
Urban Sites Subsidize Rural Sites
26
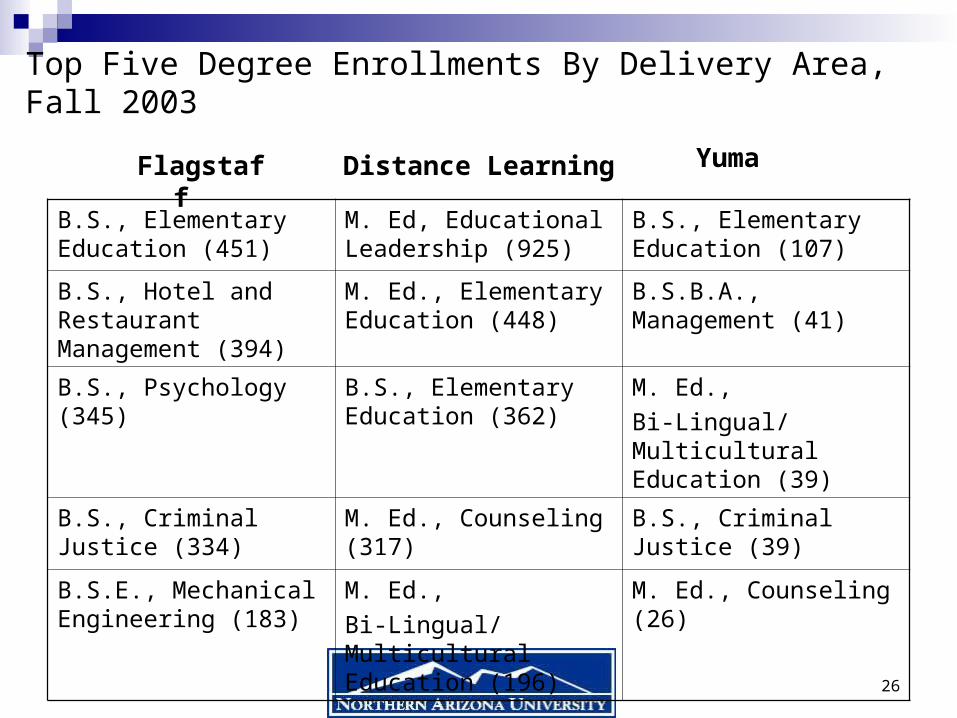
Top Five Degree Enrollments By Delivery Area, Fall 2003
B.S., Elementary Education (451)
M. Ed, Educational Leadership (925)
B.S., Elementary Education (107)
B.S., Hotel and Restaurant Management (394)
M. Ed., Elementary Education (448)
B.S.B.A., Management (41)
B.S., Psychology (345) B.S., Elementary Education (362)
M. Ed.,
Bi-Lingual/Multicultural Education (39)
B.S., Criminal Justice (334)
M. Ed., Counseling (317) B.S., Criminal Justice (39)
B.S.E., Mechanical Engineering (183)
M. Ed.,
Bi-Lingual/Multicultural Education (196)
M. Ed., Counseling (26)
Flagstaff Distance Learning Yuma
27
Key Components of NAU’s Distance Delivery (including Yuma)
2+2 Agreements with all Arizona Community Colleges
A variety of course/program delivery methods: face-to-face, interactive television, web and hybrid.
Accounted for 33% of total student headcount and 25% of student FTE in Fall, 2003

28
2+2: Expand on Demand
MEDIUM POPULATION (up to 3,000 headcount)
• NAU facilities on community college campuses
• Dedicated/joint NAU-community college faculty
• Some legislative support needed, but only as demand warrants
SMALL POPULATION (up to 300 headcount)
• Face-to-Face and electronically-delivered
• in a variety of community locations, typically by part-time faculty
• No legislative support needed beyond current levels and formulas
LARGE POPULATION (thousands of baccalaureate students)
• Seek legislative support for a new university

29
Distance Learning Course Delivery: One Mode Does NOT Fit All
0
200
400
600
800
1000
Delivery Mode, Fall 2003
Face-to-face
Web
IITV
Over 1,200 courses
Over half use non-traditional schedules (less than standard 16-week semesters)

30
Distance Learning Course Delivery: Not All Students Are Alike
-
200
400
600
800
1,000
1,200
1,400
Traditional Non-traditional
Stu
de
nts Web & Eve/Wknd
Web, Day, & Eve/Wknd
Web & Day
Web
Eve/Wknd
Daytime & Eve/Wknd
Day
“Traditional” (full-time, daytime) students and non-traditional students have different time and delivery mode preferences
Non-traditional students prefer web and hybrid classes
31
Distance Learning Programming: One Type Does NOT Fit All
Degree and certificate programs are customized to student or employer needs
Education baccalaureate (grow-your-own teachers) and master’s programs customized to fit school district needs
The Master’s of Administration offers seven emphasis areas, plus custom option for students or employers
On-line degrees in a variety of areas Plus traditional degree programs in a face-to-face
setting.
32
Be it partnership models, modes of delivery or programming:
NAU delivers what is needed where it’s needed and when it’s
needed
33
Preparing for 2020

34
Flagstaff Campus Enrollment Projections
0
2,000
4,000
6,000
8,000
10,000
12,000
14,000
16,000
AY '87 AY '92 AY97 AY02 AY07 AY12 AY17
Undergraduate #1 -- 1,000 student increase
Undergraduate #2 --3,000 student increase
Graduate

35
Distance Learning Enrollment Projections
Urban enrollments subsidize rural enrollments
Enrollment Projections Academic Year 1993 to Academic Year 2018Distance Learning including Yuma
-
5,000
10,000
15,000
20,000
25,000
30,000
35,000
40,000
45,000
AY93AY95
AY97AY99
AY01AY03
AY05AY07
AY09AY11
AY13AY15
AY17
Enr
ollm
ent
Combined
Urban Rural
Urban enrollments will increase
more quickly than rural enrollments

36
Distance Learning Web enrollments are growing...
Enrollment Projections by Mode of Delivery
0
5,000
10,000
15,000
20,000
25,000
AY98AY00
AY02AY04
AY06AY08
AY10AY12
AY14AY16
AY18
Enr
ollm
ent
Face to Face
Web
IITV
37
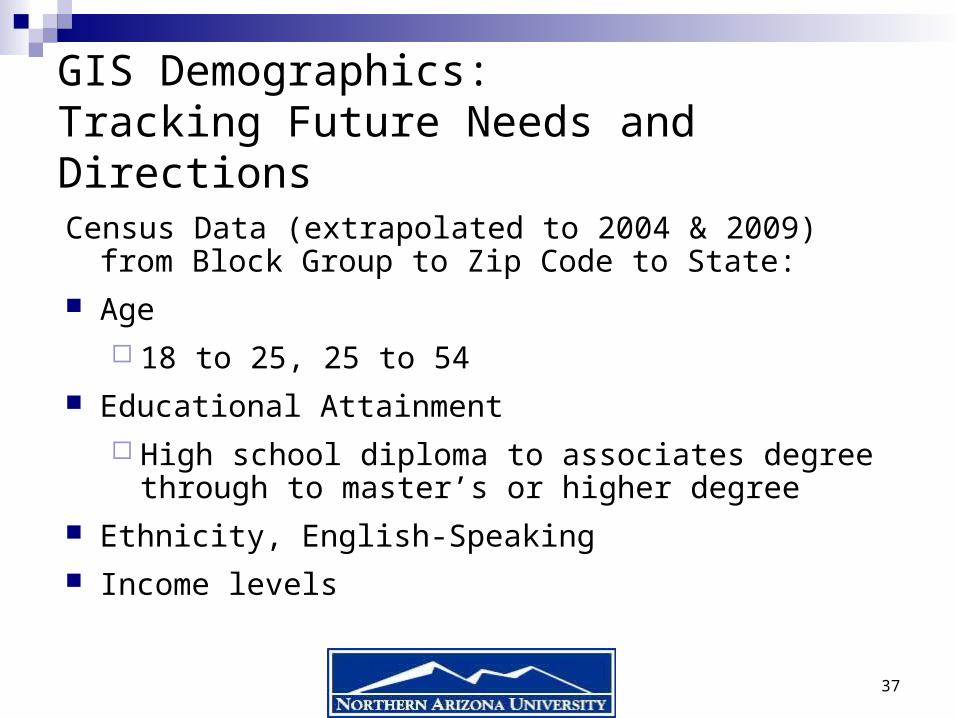
GIS Demographics:Tracking Future Needs and Directions
Census Data (extrapolated to 2004 & 2009) from Block Group to Zip Code to State:
Age 18 to 25, 25 to 54
Educational Attainment High school diploma to associates degree through to
master’s or higher degree Ethnicity, English-Speaking Income levels

38
GIS Demographics: Tracking Future Needs and Directions
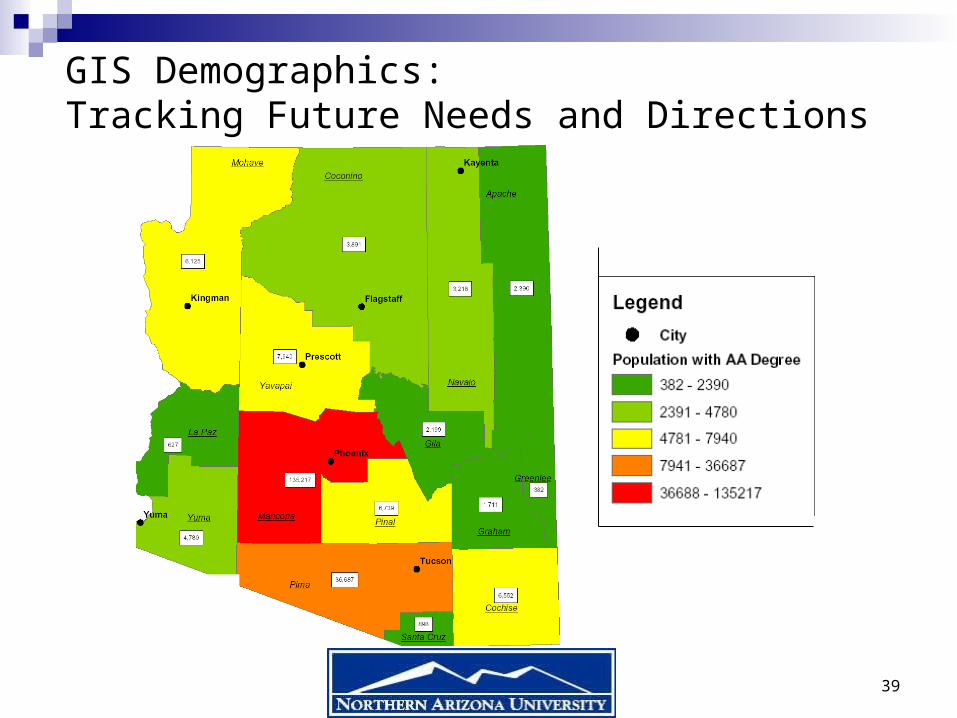
39
GIS Demographics:Tracking Future Needs and Directions

40
GIS Demographics:Tracking Future Needs and Directions
Cochise County

41
To Campus, or Not to Campus?
Over the next 15-20 years, there will be an increase in students.
Some of them will want a traditional college education
NAU has capacity to serve some of those students on the Flagstaff Campus
NAU can serve daytime, full-time students in partnership with community colleges
New NAU branch or university campuses may be built to serve large populations

42
To Campus or Not to Campus?
Other students will need to be served where they live and work:
NAU can serve evening and weekend students in partnership with community colleges
NAU can provide access to higher education in the workplace and the home
NAU can provide access anytime, anywhere through technology-delivered programs

43
The “Expand on Demand” model has
worked well in the past, works well now,
and will work well in the future.

44
Northern Arizona University: A University for the 21st Century