Embed Size (px)
Citation preview
1 of 28© 2012 Pearson Education, Inc. Publishing as Prentice Hall
PAR
T I
V C
once
pts
and
Prob
lem
s in
Mac
roec
onom
ics
Prepared by: Fernando Quijano & Shelly Tefft
CASE FAIR OSTER
P R I N C I P L E S O F
ECONOMICST E N T H E D I T I O N

2 of 28© 2012 Pearson Education, Inc. Publishing as Prentice Hall
PAR
T I
V C
once
pts
and
Prob
lem
s in
Mac
roec
onom
ics
3 of 28© 2012 Pearson Education, Inc. Publishing as Prentice Hall
PAR
T I
V C
once
pts
and
Prob
lem
s in
Mac
roec
onom
ics
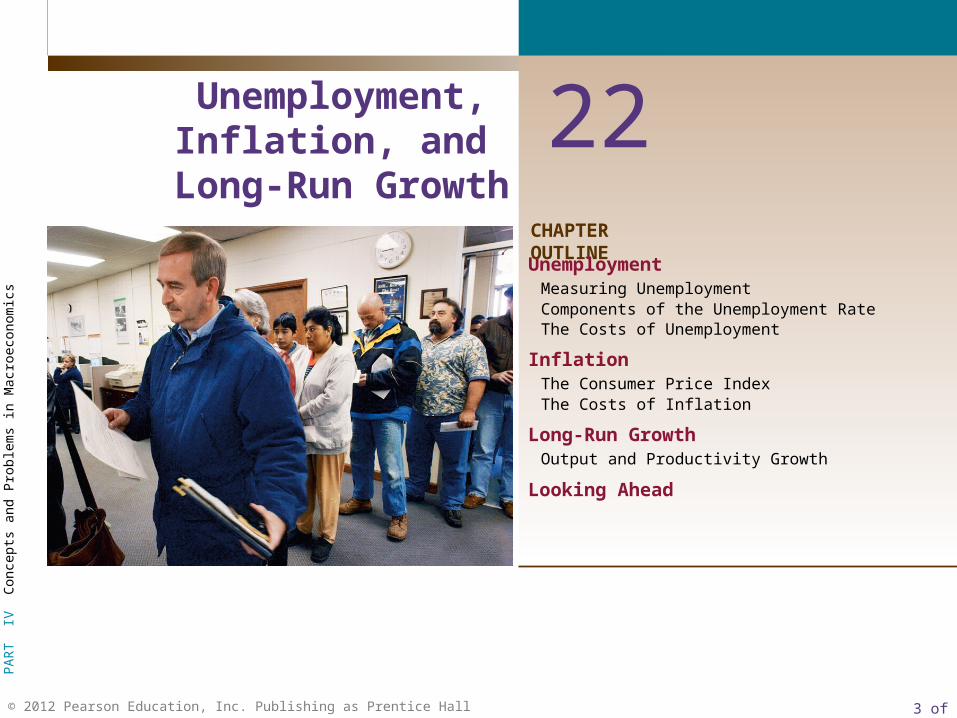
CHAPTER OUTLINE
22Unemployment, Inflation, and
Long-Run Growth
Unemployment Measuring UnemploymentComponents of the Unemployment RateThe Costs of Unemployment
InflationThe Consumer Price IndexThe Costs of Inflation
Long-Run GrowthOutput and Productivity Growth
Looking Ahead
4 of 28© 2012 Pearson Education, Inc. Publishing as Prentice Hall
PAR
T I
V C
once
pts
and
Prob
lem
s in
Mac
roec
onom
ics
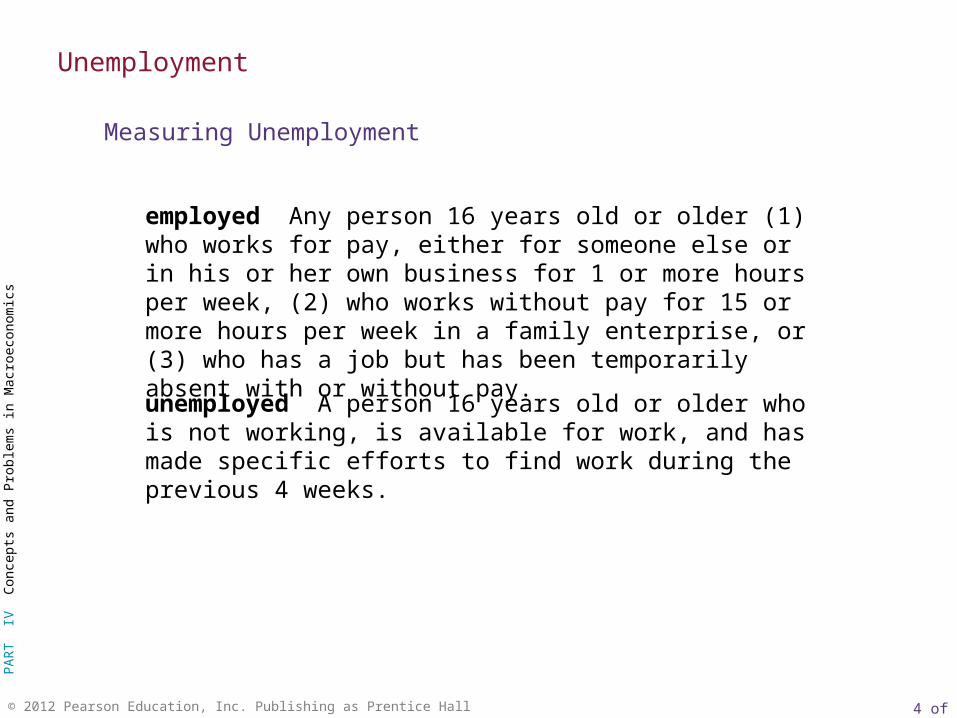
employed Any person 16 years old or older (1) who works for pay, either for someone else or in his or her own business for 1 or more hours per week, (2) who works without pay for 15 or more hours per week in a family enterprise, or (3) who has a job but has been temporarily absent with or without pay.
unemployed A person 16 years old or older who is not working, is available for work, and has made specific efforts to find work during the previous 4 weeks.
Unemployment
Measuring Unemployment
5 of 28© 2012 Pearson Education, Inc. Publishing as Prentice Hall
PAR
T I
V C
once
pts
and
Prob
lem
s in
Mac
roec
onom
ics
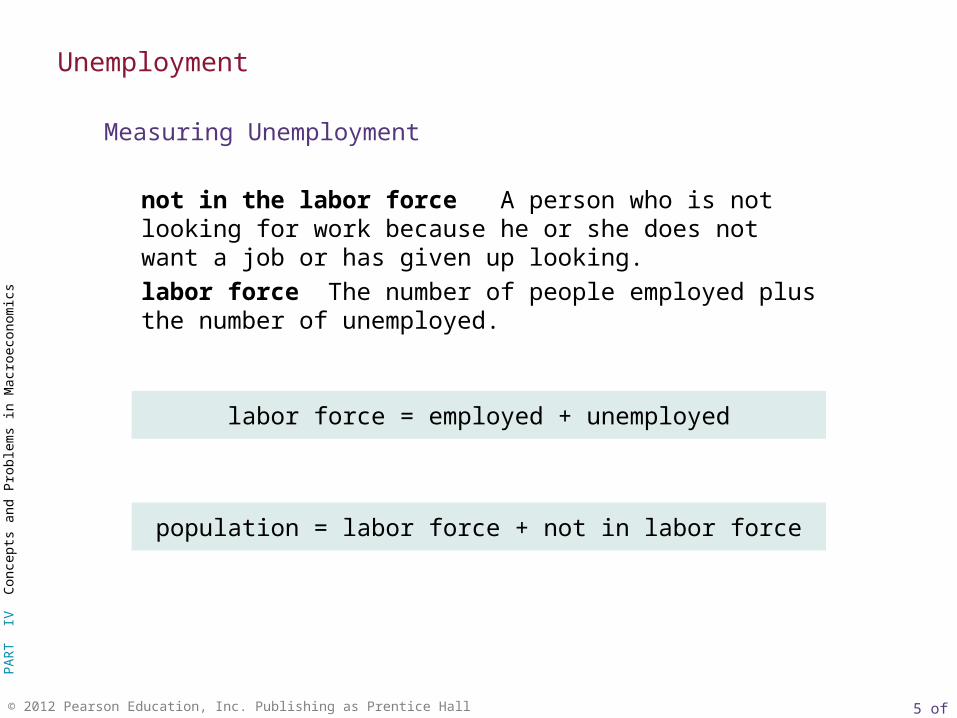
not in the labor force A person who is not looking for work because he or she does not want a job or has given up looking.
labor force The number of people employed plus the number of unemployed.
labor force = employed + unemployed
population = labor force + not in labor force
Unemployment
Measuring Unemployment
6 of 28© 2012 Pearson Education, Inc. Publishing as Prentice Hall
PAR
T I
V C
once
pts
and
Prob
lem
s in
Mac
roec
onom
ics
Unemployment
Measuring Unemployment
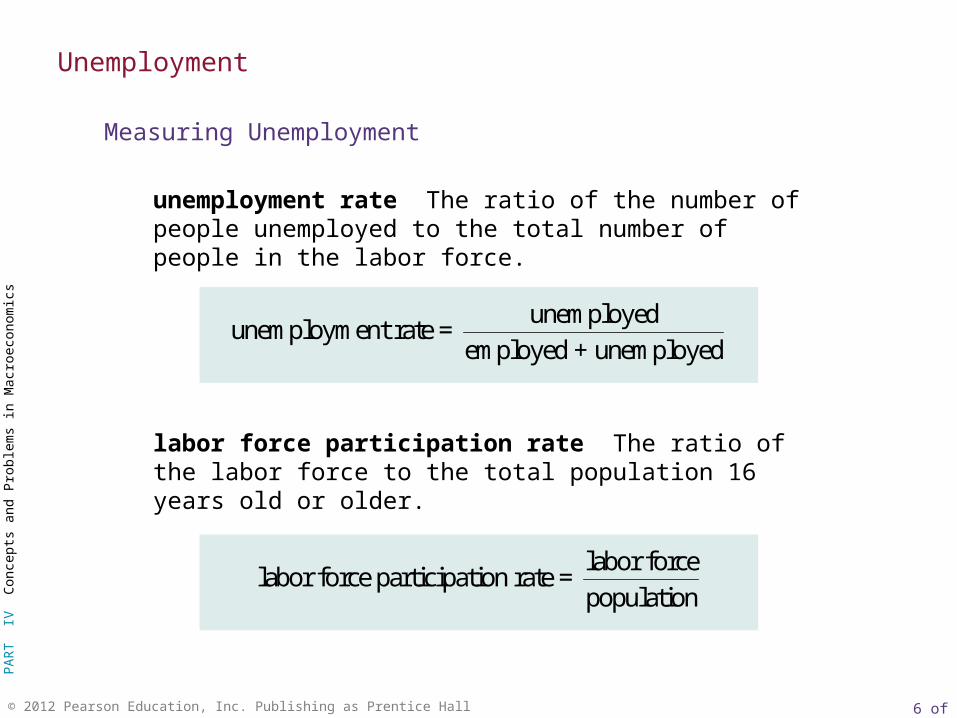
unemployment rate The ratio of the number of people unemployed to the total number of people in the labor force.
labor force participation rate The ratio of the labor force to the total population 16 years old or older.
unemployedunemployment rate =
employed + unemployed
labor forcelabor force participation rate =
population
7 of 28© 2012 Pearson Education, Inc. Publishing as Prentice Hall
PAR
T I
V C
once
pts
and
Prob
lem
s in
Mac
roec
onom
ics
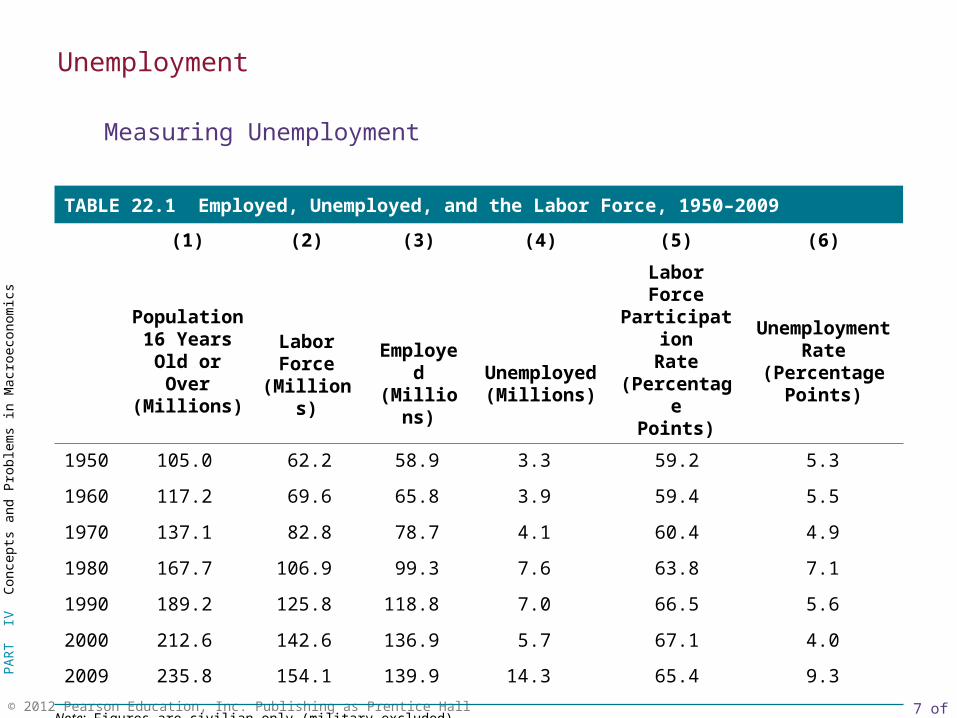
TABLE 22.1 Employed, Unemployed, and the Labor Force, 1950–2009
(1) (2) (3) (4) (5) (6)
Population16 Years
Old or Over(Millions)
LaborForce
(Millions)Employed(Millions)
Unemployed(Millions)
Labor ForceParticipation
Rate(Percentage
Points)
UnemploymentRate
(PercentagePoints)
1950 105.0 62.2 58.9 3.3 59.2 5.3
1960 117.2 69.6 65.8 3.9 59.4 5.5
1970 137.1 82.8 78.7 4.1 60.4 4.9
1980 167.7 106.9 99.3 7.6 63.8 7.1
1990 189.2 125.8 118.8 7.0 66.5 5.6
2000 212.6 142.6 136.9 5.7 67.1 4.0
2009 235.8 154.1 139.9 14.3 65.4 9.3
Note: Figures are civilian only (military excluded).
Unemployment
Measuring Unemployment
8 of 28© 2012 Pearson Education, Inc. Publishing as Prentice Hall
PAR
T I
V C
once
pts
and
Prob
lem
s in
Mac
roec
onom
ics
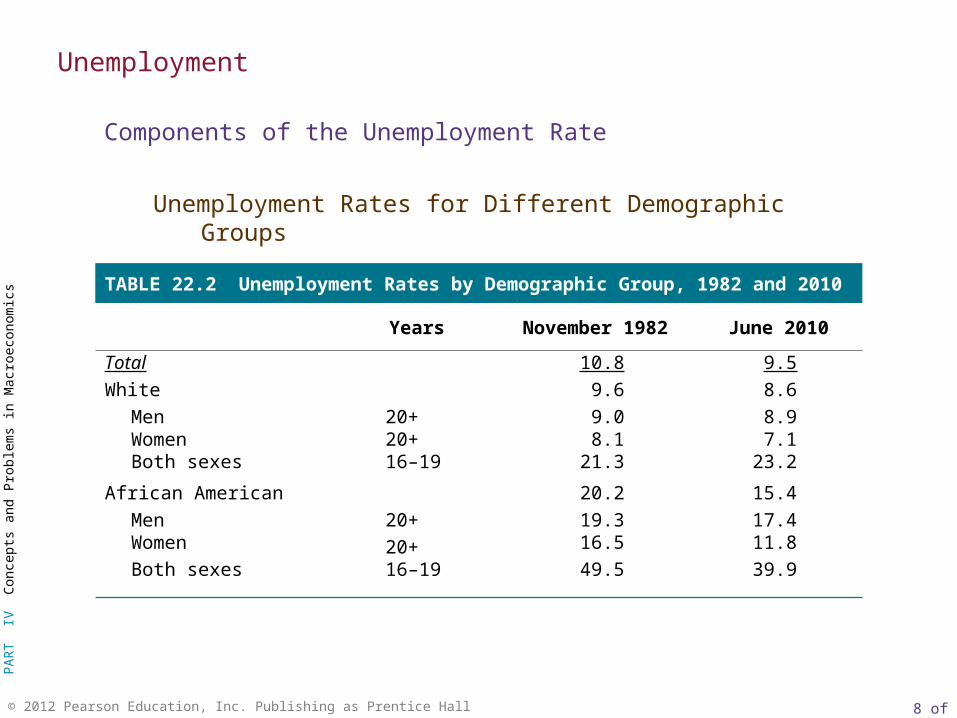
TABLE 22.2 Unemployment Rates by Demographic Group, 1982 and 2010
Years November 1982 June 2010
Total 10.8 9.5
White 9.6 8.6
Men 20+ 9.0 8.9Women 20+ 8.1 7.1Both sexes 16–19 21.3 23.2
African American 20.2 15.4
MenWomen
20+
20+
19.316.5
17.411.8
Both sexes 16–19 49.5 39.9
Unemployment
Components of the Unemployment Rate
Unemployment Rates for Different Demographic Groups
9 of 28© 2012 Pearson Education, Inc. Publishing as Prentice Hall
PAR
T I
V C
once
pts
and
Prob
lem
s in
Mac
roec
onom
ics
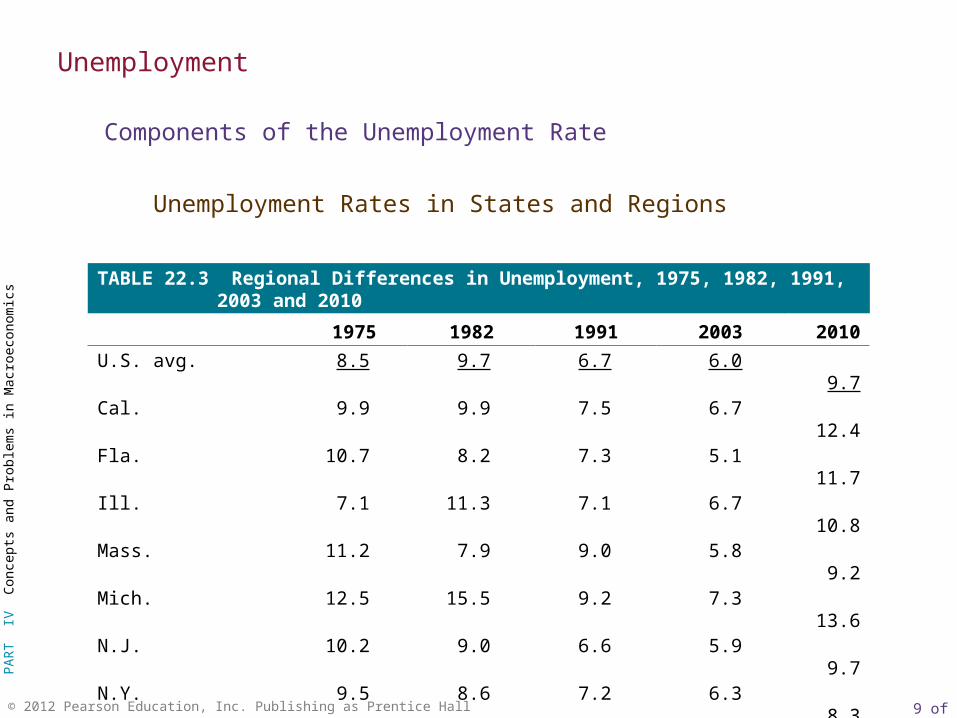
TABLE 22.3 Regional Differences in Unemployment, 1975, 1982, 1991, 2003 and 2010
1975 1982 1991 2003 2010
U.S. avg. 8.5 9.7 6.7 6.0 9.7Cal. 9.9 9.9 7.5 6.7 12.4Fla. 10.7 8.2 7.3 5.1 11.7Ill. 7.1 11.3 7.1 6.7 10.8Mass. 11.2 7.9 9.0 5.8 9.2Mich. 12.5 15.5 9.2 7.3 13.6N.J. 10.2 9.0 6.6 5.9 9.7N.Y. 9.5 8.6 7.2 6.3 8.3N.C. 8.6 9.0 5.8 6.5 10.3Ohio 9.1 12.5 6.4 6.1 10.7Tex. 5.6 6.9 6.6 6.8 8.3
Unemployment
Components of the Unemployment Rate
Unemployment Rates in States and Regions
10 of 28© 2012 Pearson Education, Inc. Publishing as Prentice Hall
PAR
T I
V C
once
pts
and
Prob
lem
s in
Mac
roec
onom
ics
discouraged-worker effect The decline in the measured unemployment rate that results when people who want to work but cannot find jobs grow discouraged and stop looking, thus dropping out of the ranks of the unemployed and the labor force.
Unemployment
Components of the Unemployment Rate
Discouraged-Worker Effects

11 of 28© 2012 Pearson Education, Inc. Publishing as Prentice Hall
PAR
T I
V C
once
pts
and
Prob
lem
s in
Mac
roec
onom
ics
As women began joining the labor force in greater numbers in the 1970s and 1980s, their wages relative to men’s wages actually fell.
Most economists attribute this decline to the fact that less experienced women were entering the labor force, pointing out the importance of correcting for factors such as experience and education when we analyze labor markets.
If you are interested in learning more about the economic history of American women, read the book Understanding the Gender Gap: An Economic History of American Women by Harvard University economist Claudia Goldin.
E C O N O M I C S I N P R A C T I C E
A Quiet Revolution: Women Join the Labor Force
12 of 28© 2012 Pearson Education, Inc. Publishing as Prentice Hall
PAR
T I
V C
once
pts
and
Prob
lem
s in
Mac
roec
onom
ics
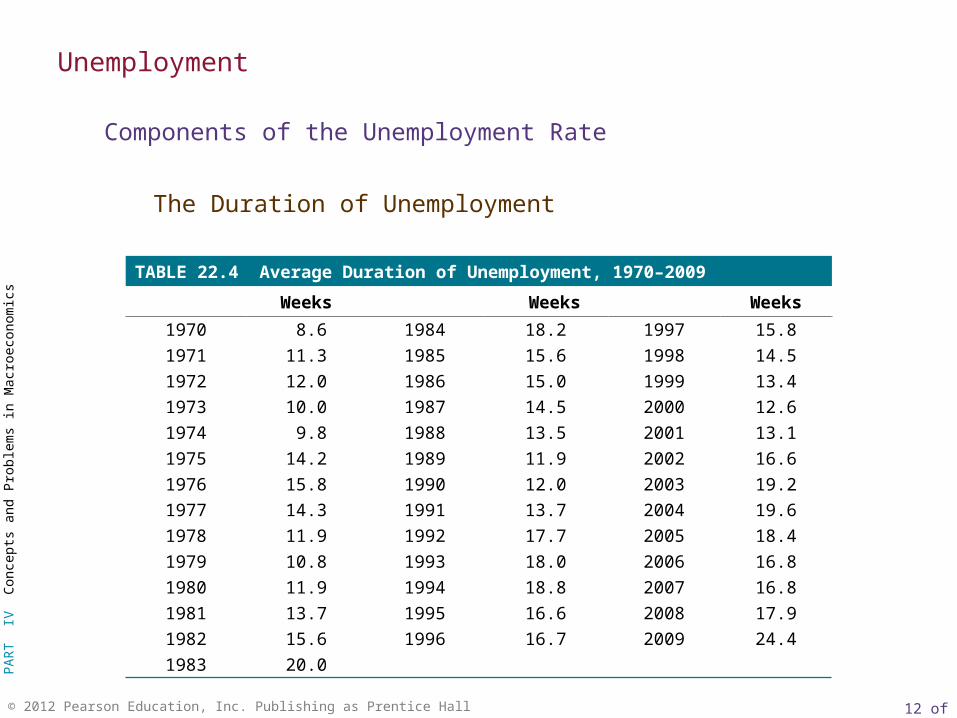
TABLE 22.4 Average Duration of Unemployment, 1970–2009
Weeks Weeks Weeks
1970 8.6 1984 18.2 1997 15.8
1971 11.3 1985 15.6 1998 14.5
1972 12.0 1986 15.0 1999 13.4
1973 10.0 1987 14.5 2000 12.6
1974 9.8 1988 13.5 2001 13.1
1975 14.2 1989 11.9 2002 16.6
1976 15.8 1990 12.0 2003 19.2
1977 14.3 1991 13.7 2004 19.6
1978 11.9 1992 17.7 2005 18.4
1979 10.8 1993 18.0 2006 16.8
1980 11.9 1994 18.8 2007 16.8
1981 13.7 1995 16.6 2008 17.9
1982 15.6 1996 16.7 2009 24.4
1983 20.0
Unemployment
Components of the Unemployment Rate
The Duration of Unemployment
13 of 28© 2012 Pearson Education, Inc. Publishing as Prentice Hall
PAR
T I
V C
once
pts
and
Prob
lem
s in
Mac
roec
onom
ics
When we consider the various costs of unemployment, it is useful to categorize unemployment into three types:
Frictional unemployment
Structural unemployment
Cyclical unemployment
Unemployment
The Costs of Unemployment
Some Unemployment Is Inevitable
14 of 28© 2012 Pearson Education, Inc. Publishing as Prentice Hall
PAR
T I
V C
once
pts
and
Prob
lem
s in
Mac
roec
onom
ics
frictional unemployment The portion of unemployment that is due to the normal turnover in the labor market; used to denote short-run job/skill matching problems.
structural unemployment The portion of unemployment that is due to changes in the structure of the economy that result in a significant loss of jobs in certain industries.
Unemployment
The Costs of Unemployment
Frictional, Structural, and Cyclical Unemployment
natural rate of unemployment The unemployment rate that occurs as a normal part of the functioning of the economy. Sometimes taken as the sum of frictional unemployment rate and structural unemployment rate.
cyclical unemployment Unemployment that is above frictional plus structural unemployment.
15 of 28© 2012 Pearson Education, Inc. Publishing as Prentice Hall
PAR
T I
V C
once
pts
and
Prob
lem
s in
Mac
roec
onom
ics
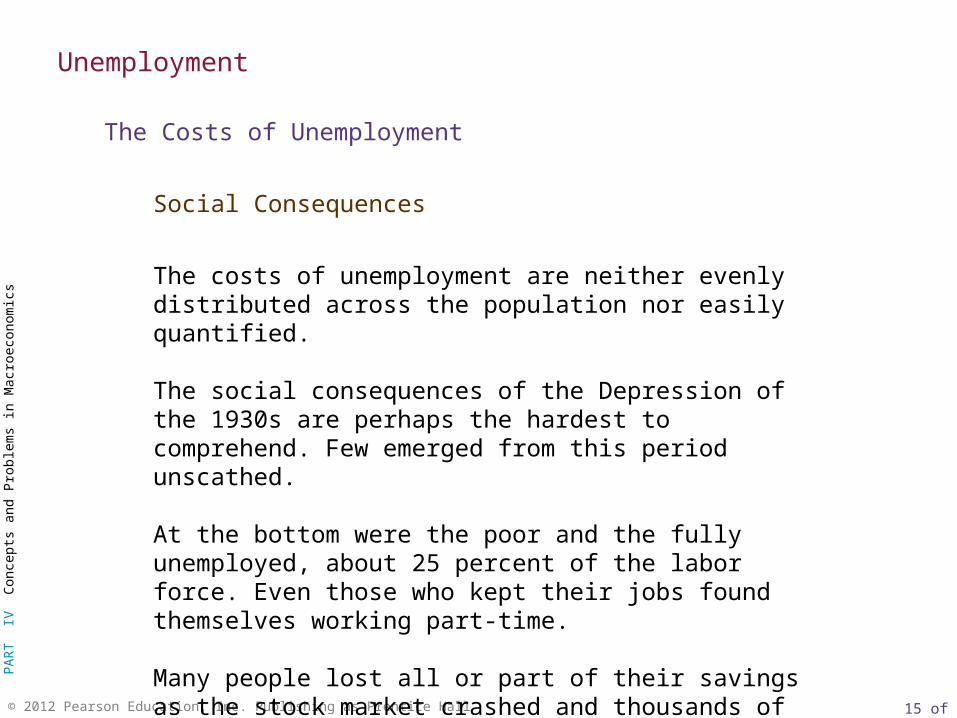
The costs of unemployment are neither evenly distributed across the population nor easily quantified.
The social consequences of the Depression of the 1930s are perhaps the hardest to comprehend. Few emerged from this period unscathed.
At the bottom were the poor and the fully unemployed, about 25 percent of the labor force. Even those who kept their jobs found themselves working part-time.
Many people lost all or part of their savings as the stock market crashed and thousands of banks failed.
Unemployment
The Costs of Unemployment
Social Consequences
16 of 28© 2012 Pearson Education, Inc. Publishing as Prentice Hall
PAR
T I
V C
once
pts
and
Prob
lem
s in
Mac
roec
onom
ics
consumer price index (CPI) A price index computed each month by the Bureau of Labor Statistics using a bundle that is meant to represent the “market basket” purchased monthly by the typical urban consumer.
Inflation
The Consumer Price Index
17 of 28© 2012 Pearson Education, Inc. Publishing as Prentice Hall
PAR
T I
V C
once
pts
and
Prob
lem
s in
Mac
roec
onom
ics
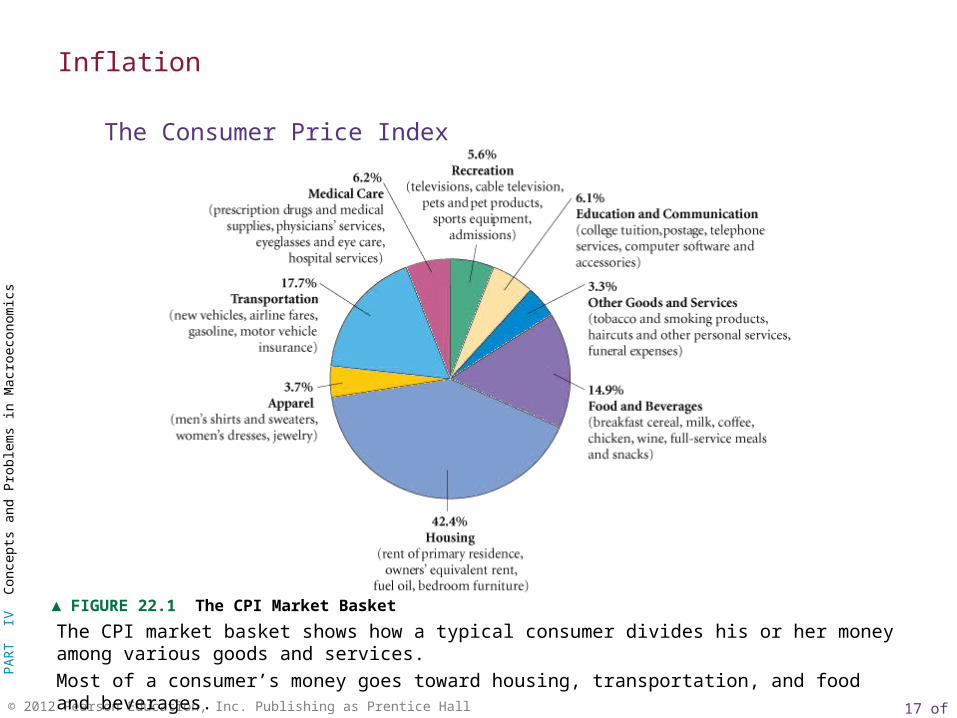
The CPI market basket shows how a typical consumer divides his or her money among various goods and services.
Most of a consumer’s money goes toward housing, transportation, and food and beverages.
▲ FIGURE 22.1 The CPI Market Basket
Inflation
The Consumer Price Index
18 of 28© 2012 Pearson Education, Inc. Publishing as Prentice Hall
PAR
T I
V C
once
pts
and
Prob
lem
s in
Mac
roec
onom
ics
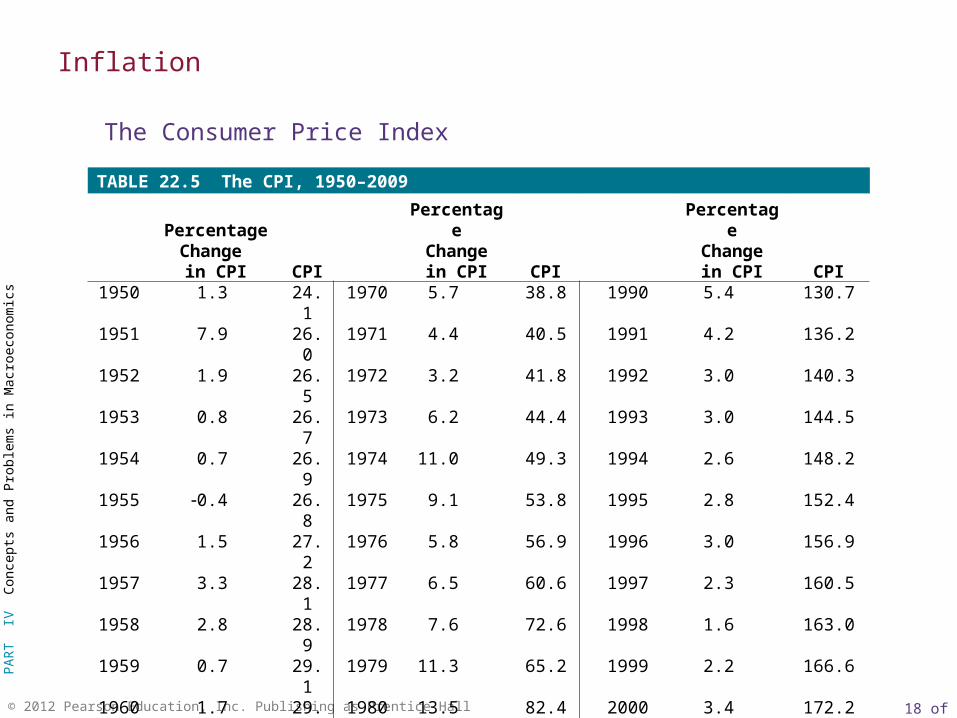
TABLE 22.5 The CPI, 1950–2009
PercentageChange in CPI CPI
PercentageChangein CPI CPI
PercentageChangein CPI CPI
1950 1.3 24.1 1970 5.7 38.8 1990 5.4 130.71951 7.9 26.0 1971 4.4 40.5 1991 4.2 136.21952 1.9 26.5 1972 3.2 41.8 1992 3.0 140.31953 0.8 26.7 1973 6.2 44.4 1993 3.0 144.51954 0.7 26.9 1974 11.0 49.3 1994 2.6 148.21955 0.4 26.8 1975 9.1 53.8 1995 2.8 152.41956 1.5 27.2 1976 5.8 56.9 1996 3.0 156.91957 3.3 28.1 1977 6.5 60.6 1997 2.3 160.51958 2.8 28.9 1978 7.6 72.6 1998 1.6 163.01959 0.7 29.1 1979 11.3 65.2 1999 2.2 166.61960 1.7 29.6 1980 13.5 82.4 2000 3.4 172.21961 1.0 29.9 1981 10.3 90.9 2001 2.8 177.11962 1.0 30.2 1982 6.2 96.5 2002 1.6 179.91963 1.3 30.6 1983 3.2 99.6 2003 2.3 184.01964 1.3 31.0 1984 4.3 103.9 2004 2.7 188.91965 1.6 31.5 1985 3.6 107.6 2005 3.4 195.31966 2.9 32.4 1986 1.9 109.6 2006 3.2 201.61967 3.1 33.4 1987 3.6 113.6 2007 2.8 207.31968 4.2 34.8 1988 4.1 118.3 2008 3.9 215.31969 5.5 36.7 1989 4.8 124.0 2009 -0.4 214.5
Inflation
The Consumer Price Index
19 of 28© 2012 Pearson Education, Inc. Publishing as Prentice Hall
PAR
T I
V C
once
pts
and
Prob
lem
s in
Mac
roec
onom
ics
producer price indexes (PPIs) Measures of prices that producers receive for products at all stages in the production process.
The indexes are calculated separately for various stages in the production process.
The three main categories are finished goods, intermediate materials, and crude materials, although there are subcategories within each of these categories.
Inflation
The Consumer Price Index
20 of 28© 2012 Pearson Education, Inc. Publishing as Prentice Hall
PAR
T I
V C
once
pts
and
Prob
lem
s in
Mac
roec
onom
ics
During inflations, most prices—including input prices like wages—tend to rise together, and input prices determine both the incomes of workers and the incomes of owners of capital and land.
So inflation by itself does not necessarily reduce ones purchasing power.
Inflation
The Costs of Inflation
21 of 28© 2012 Pearson Education, Inc. Publishing as Prentice Hall
PAR
T I
V C
once
pts
and
Prob
lem
s in
Mac
roec
onom
ics
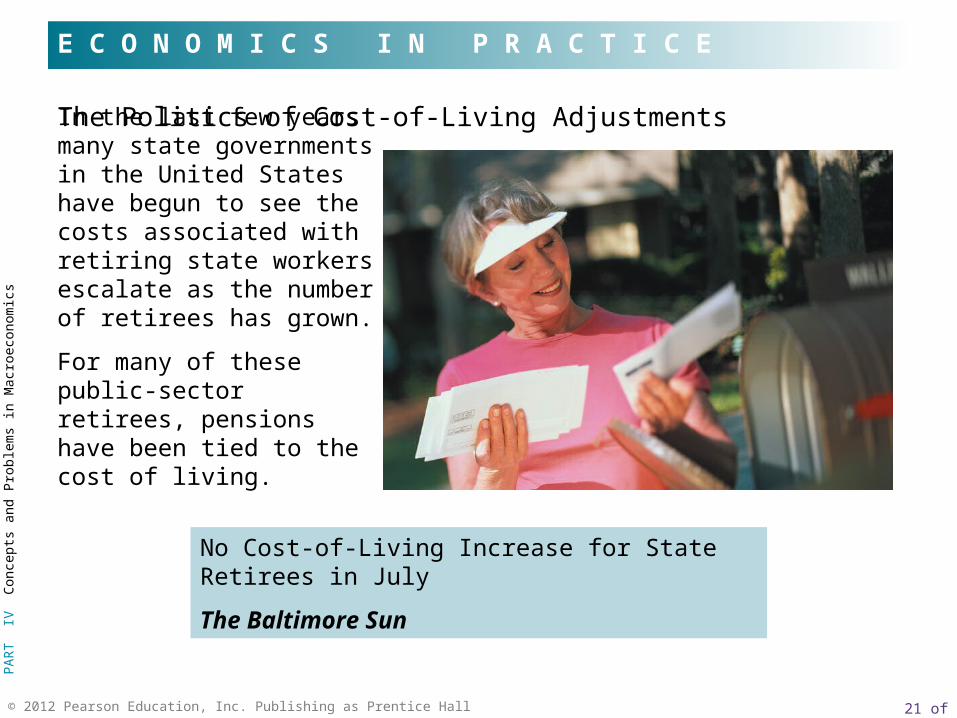
In the last few years many state governments in the United States have begun to see the costs associated with retiring state workers escalate as the number of retirees has grown.
For many of these public-sector retirees, pensions have been tied to the cost of living.
E C O N O M I C S I N P R A C T I C E
The Politics of Cost-of-Living Adjustments
No Cost-of-Living Increase for State Retirees in July
The Baltimore Sun
22 of 28© 2012 Pearson Education, Inc. Publishing as Prentice Hall
PAR
T I
V C
once
pts
and
Prob
lem
s in
Mac
roec
onom
ics
real interest rate The difference between the interest rate on a loan and the inflation rate.
Inflation
The Costs of Inflation
Inflation May Change the Distribution of Income
23 of 28© 2012 Pearson Education, Inc. Publishing as Prentice Hall
PAR
T I
V C
once
pts
and
Prob
lem
s in
Mac
roec
onom
ics
There may be costs associated even with anticipated inflation. One is the administrative cost associated with simply keeping up.
Economists have debated the seriousness of the costs of inflation for decades.
No matter what the real economic cost of inflation, people do not like it.
Inflation
The Costs of Inflation
Administrative Costs and Inefficiencies
Public Enemy Number One?
24 of 28© 2012 Pearson Education, Inc. Publishing as Prentice Hall
PAR
T I
V C
once
pts
and
Prob
lem
s in
Mac
roec
onom
ics
output growth The growth rate of the output of the entire economy.
per-capita output growth The growth rate of output per person in the economy.
productivity growth The growth rate of output per worker.
Long-Run Growth
25 of 28© 2012 Pearson Education, Inc. Publishing as Prentice Hall
PAR
T I
V C
once
pts
and
Prob
lem
s in
Mac
roec
onom
ics
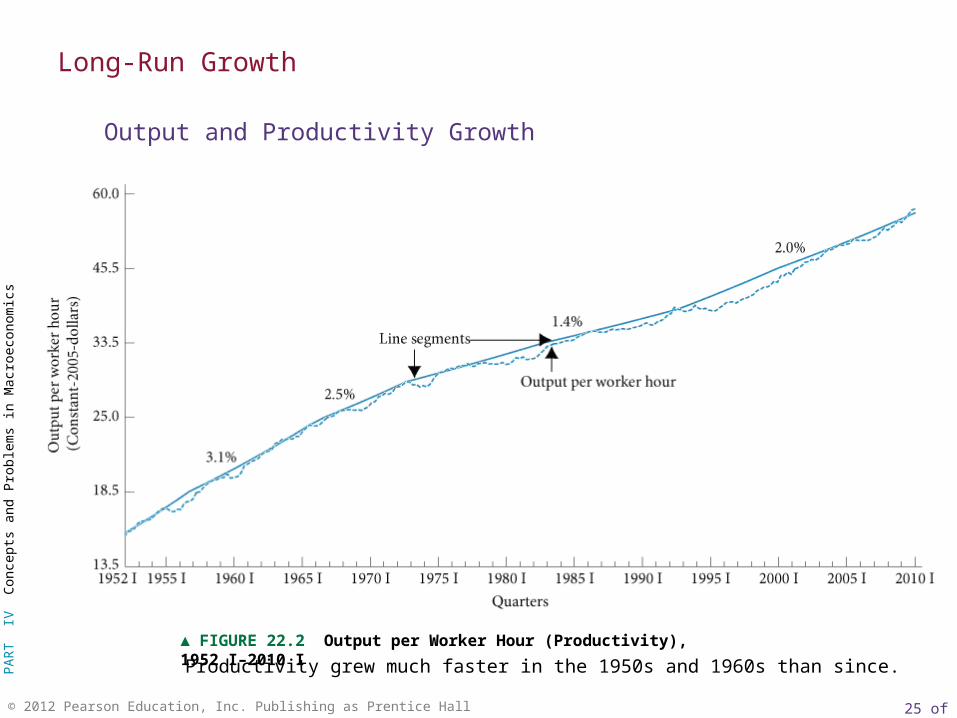
Productivity grew much faster in the 1950s and 1960s than since.
▲ FIGURE 22.2 Output per Worker Hour (Productivity), 1952 I–2010 I
Long-Run Growth
Output and Productivity Growth
26 of 28© 2012 Pearson Education, Inc. Publishing as Prentice Hall
PAR
T I
V C
once
pts
and
Prob
lem
s in
Mac
roec
onom
ics
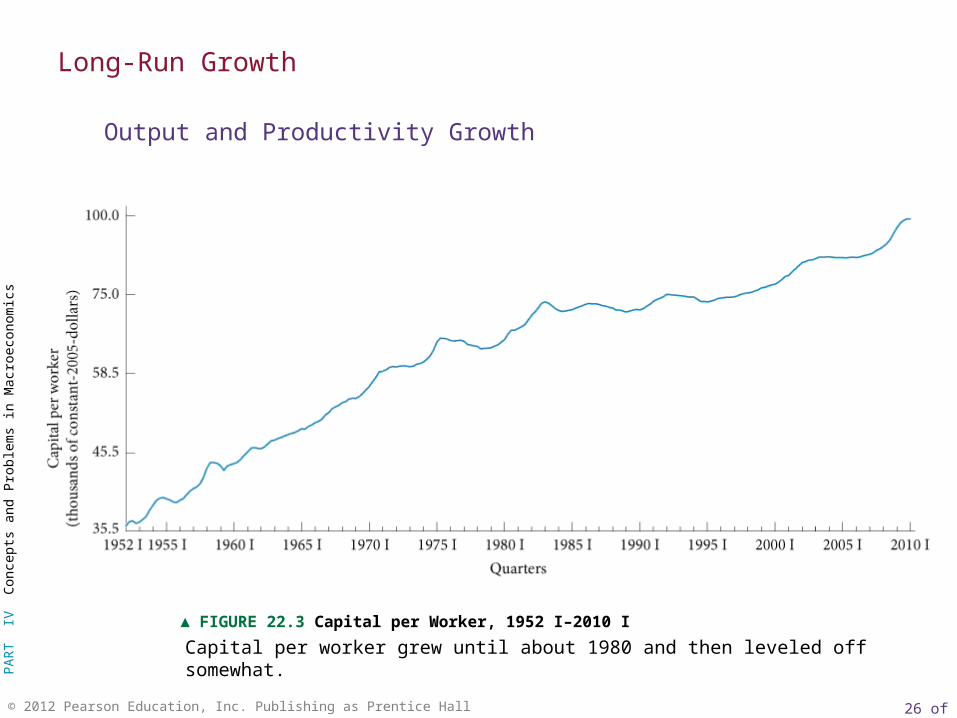
Capital per worker grew until about 1980 and then leveled off somewhat.
▲ FIGURE 22.3 Capital per Worker, 1952 I–2010 I
Long-Run Growth
Output and Productivity Growth

27 of 28© 2012 Pearson Education, Inc. Publishing as Prentice Hall
PAR
T I
V C
once
pts
and
Prob
lem
s in
Mac
roec
onom
ics
Looking Ahead
This ends our introduction to the basic concepts and problems of macroeconomics.
The first chapter of this part introduced the field; the second chapter discussed the measurement of national product and national income; and this chapter discussed unemployment, inflation, and long-run growth.
We are now ready to begin the analysis of how the macroeconomy works.
28 of 28© 2012 Pearson Education, Inc. Publishing as Prentice Hall
PAR
T I
V C
once
pts
and
Prob
lem
s in
Mac
roec
onom
ics
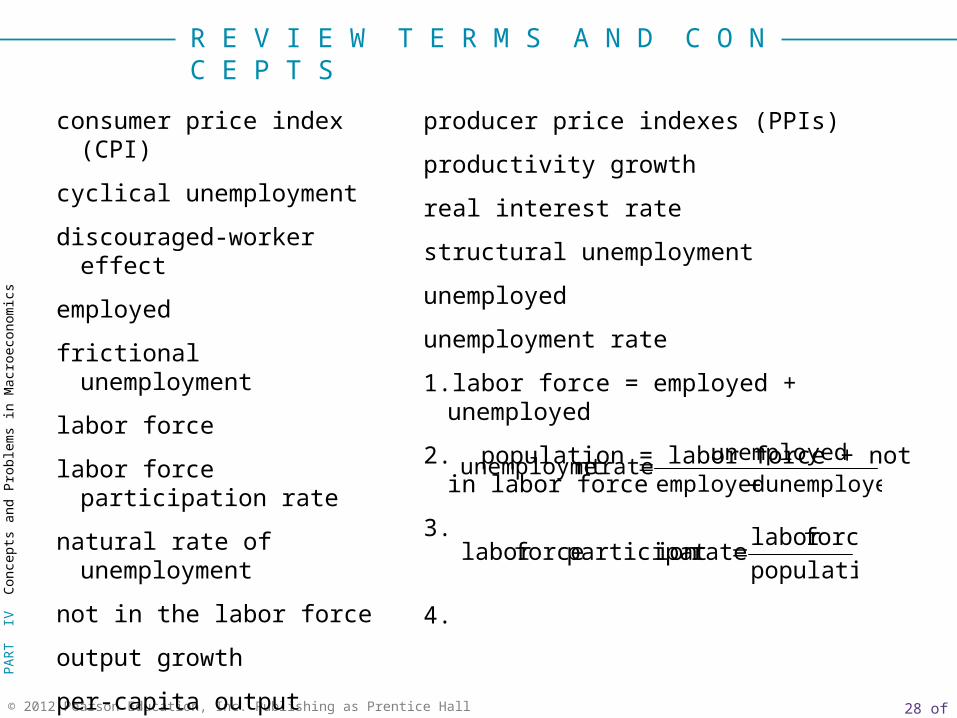
consumer price index (CPI)
cyclical unemployment
discouraged-worker effect
employed
frictional unemployment
labor force
labor force participation rate
natural rate of unemployment
not in the labor force
output growth
per-capita output growth
producer price indexes (PPIs)
productivity growth
real interest rate
structural unemployment
unemployed
unemployment rate
1. labor force = employed + unemployed
2. population = labor force + not in labor force
3.
4.
unemployed employed
unemployed ratent unemployme
population
forcelabor rateion participat forcelabor
R E V I E W T E R M S A N D C O N C E P T S