Embed Size (px)
Citation preview
1 of 29
PAR
T I
II T
he C
ore
of M
acro
econ
omic
The
ory
© 2012 Pearson Education, Inc. Publishing as Prentice Hall
CASE FAIR OSTER
PRINCIPLES OF
ECONOMICSELEVENTH EDITION
PEARSONPrepared by: Fernando Quijano w/Shelly Tefft

2 of 28© 2014 Pearson Education, Inc.
3 of 28© 2014 Pearson Education, Inc.
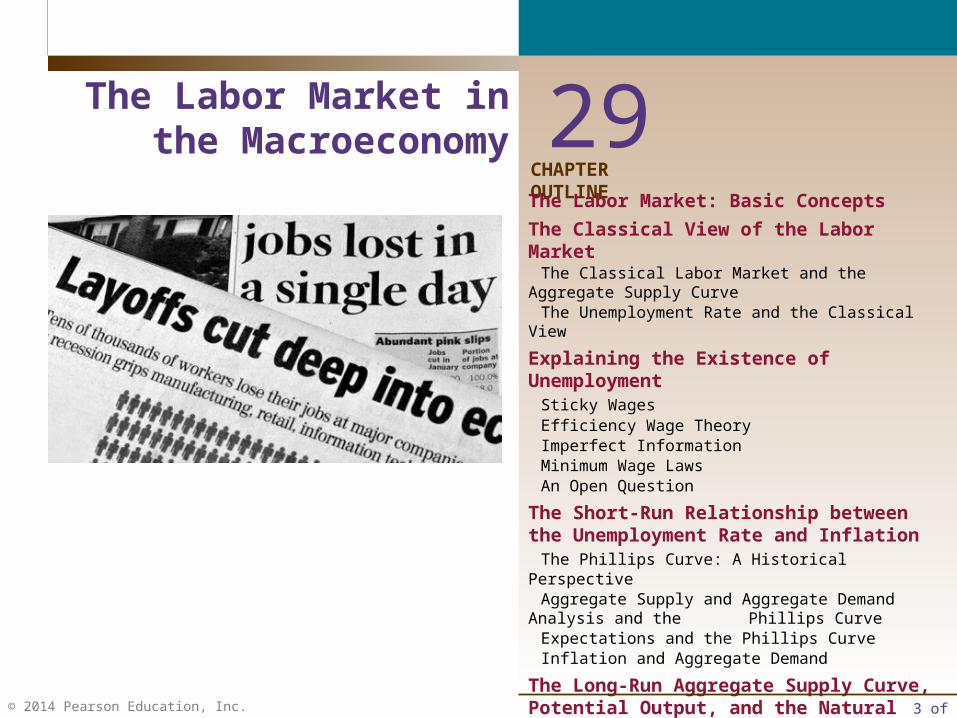
CHAPTER OUTLINE
29The Labor Market in the Macroeconomy
The Labor Market: Basic Concepts
The Classical View of the Labor MarketThe Classical Labor Market and the Aggregate Supply CurveThe Unemployment Rate and the Classical View
Explaining the Existence of UnemploymentSticky WagesEfficiency Wage TheoryImperfect InformationMinimum Wage LawsAn Open Question
The Short-Run Relationship between the Unemployment Rate and Inflation
The Phillips Curve: A Historical PerspectiveAggregate Supply and Aggregate Demand Analysis and the Phillips CurveExpectations and the Phillips CurveInflation and Aggregate Demand
The Long-Run Aggregate Supply Curve, Potential Output, and the Natural Rate of Unemployment
The Nonaccelerating Inflation Rate of Unemployment (NAIRU)
Looking Ahead
4 of 28© 2014 Pearson Education, Inc.
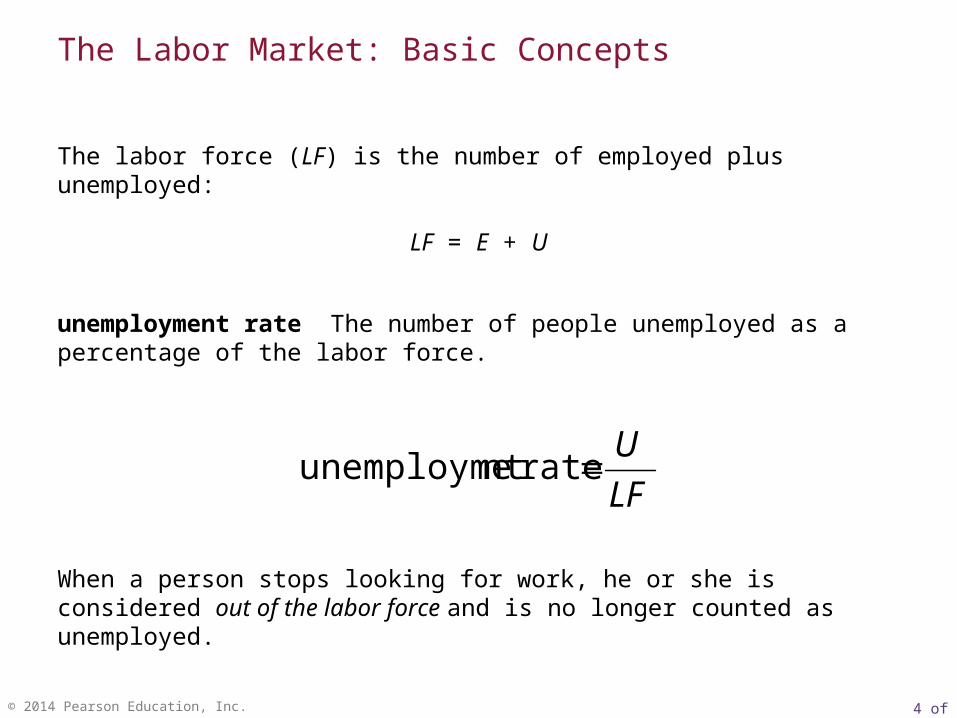
The labor force (LF) is the number of employed plus unemployed:
LF = E + U
unemployment rate The number of people unemployed as a percentage of the labor force.
The Labor Market: Basic Concepts
LF
U ratent unemployme
When a person stops looking for work, he or she is considered out of the labor force and is no longer counted as unemployed.
5 of 28© 2014 Pearson Education, Inc.
frictional unemployment The portion of unemployment that is due to the normal working of the labor market; used to denote short-run job/skill matching problems.
structural unemployment The portion of unemployment that is due to changes in the structure of the economy that result in a significant loss of jobs in certain industries.
cyclical unemployment The increase in unemployment that occurs during recessions and depressions.
A decline in the demand for labor does not necessarily mean that unemployment will rise. The resulting excess supply of labor will cause the wage rate to fall, until a new equilibrium is reached, and everyone who wants a job at the lower wage rate will have one.
6 of 28© 2014 Pearson Education, Inc.
labor demand curve A graph that illustrates the amount of labor that firms want to employ at each given wage rate.
labor supply curve A graph that illustrates the amount of labor that households want to supply at each given wage rate.
The Classical View of the Labor Market
Classical economists assumed that the wage rate adjusts to equate the quantity demanded with the quantity supplied, thereby implying that unemployment does not exist.
At equilibrium, the people who are not working have chosen not to work at that market wage. There is always full employment in this sense.
7 of 28© 2014 Pearson Education, Inc.
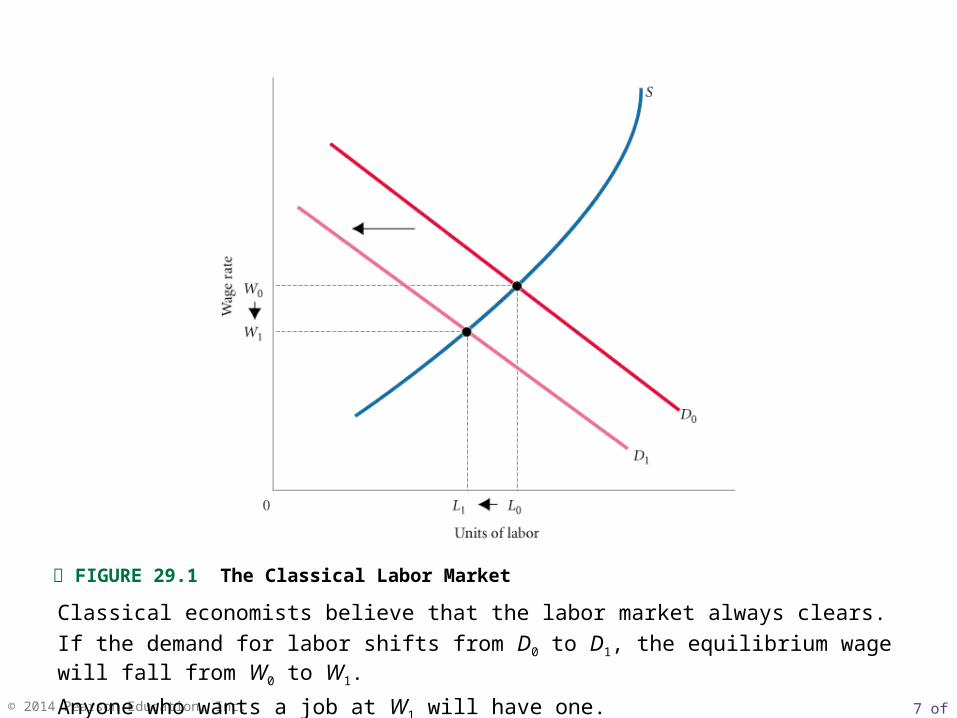
Classical economists believe that the labor market always clears.
If the demand for labor shifts from D0 to D1, the equilibrium wage will fall from W0 to W1.
Anyone who wants a job at W1 will have one.
FIGURE 29.1 The Classical Labor Market

8 of 28© 2014 Pearson Education, Inc.
The classical idea that wages adjust to clear the labor market is consistent with the view that wages respond quickly to price changes.
In the absence of sticky wages, the AS curve will be vertical.
In this case, monetary and fiscal policy will have no effect on real output.
Indeed, in this view, there is no unemployment problem to be solved!
The Classical Labor Market and the Aggregate Supply Curve
9 of 28© 2014 Pearson Education, Inc.
Some economists argue that the unemployment rate is not a good measure of whether the labor market is working well. The economy is dynamic and at any given time some industries are expanding and some are contracting.
A positive unemployment rate as measured by the government does not necessarily indicate that the labor market is working poorly. The measured unemployment rate may sometimes seem high even though the labor market is working well.
Economists who view unemployment this way do not see it as a major problem. There are other views of unemployment, as we will now see.
The Unemployment Rate and the Classical View
10 of 28© 2014 Pearson Education, Inc.
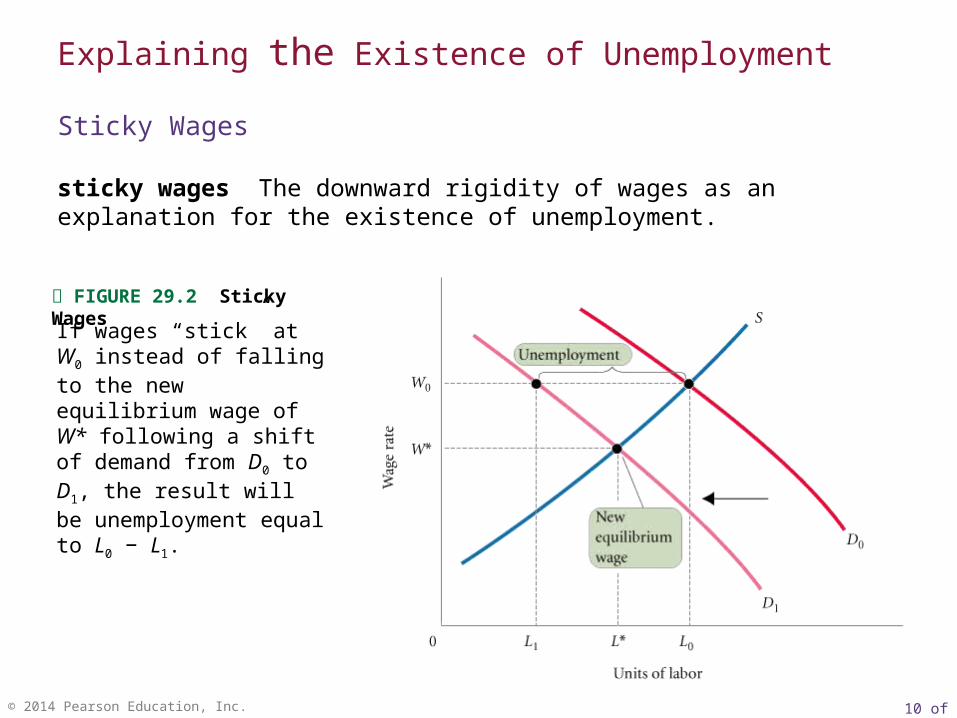
sticky wages The downward rigidity of wages as an explanation for the existence of unemployment.
If wages “stick” at W0 instead of falling to the new equilibrium wage of W* following a shift of demand from D0 to D1, the result will be unemployment equal to L0 − L1.
FIGURE 29.2 Sticky Wages
Explaining the Existence of Unemployment
Sticky Wages

11 of 28© 2014 Pearson Education, Inc.
social, or implicit, contracts Unspoken agreements between workers and firms that firms will not cut wages.
relative-wage explanation of unemployment An explanation for sticky wages (and therefore unemployment): If workers are concerned about their wages relative to other workers in other firms and industries, they may be unwilling to accept a wage cut unless they know that all other workers are receiving similar cuts.
Social, or Implicit, Contracts
explicit contracts Employment contracts that stipulate workers’ wages, usually for a period of 1 to 3 years.
cost-of-living adjustments (COLAs) Contract provisions that tie wages to changes in the cost of living. The greater the inflation rate, the more wages are raised.
Explicit Contracts
12 of 28© 2014 Pearson Education, Inc.
efficiency wage theory An explanation for unemployment that holds that the productivity of workers increases with the wage rate. If this is so, firms may have an incentive to pay wages above the market-clearing rate.
Efficiency Wage Theory
Empirical studies of labor markets have identified several potential benefits that firms receive from paying workers more than the market-clearing wage. Among them are lower turnover, improved morale, and reduced “shirking” of work.
Even though the efficiency wage theory predicts some unemployment, the behavior it is describing is unlikely to account for much of the observed large cyclical fluctuations in unemployment over time.
13 of 28© 2014 Pearson Education, Inc.
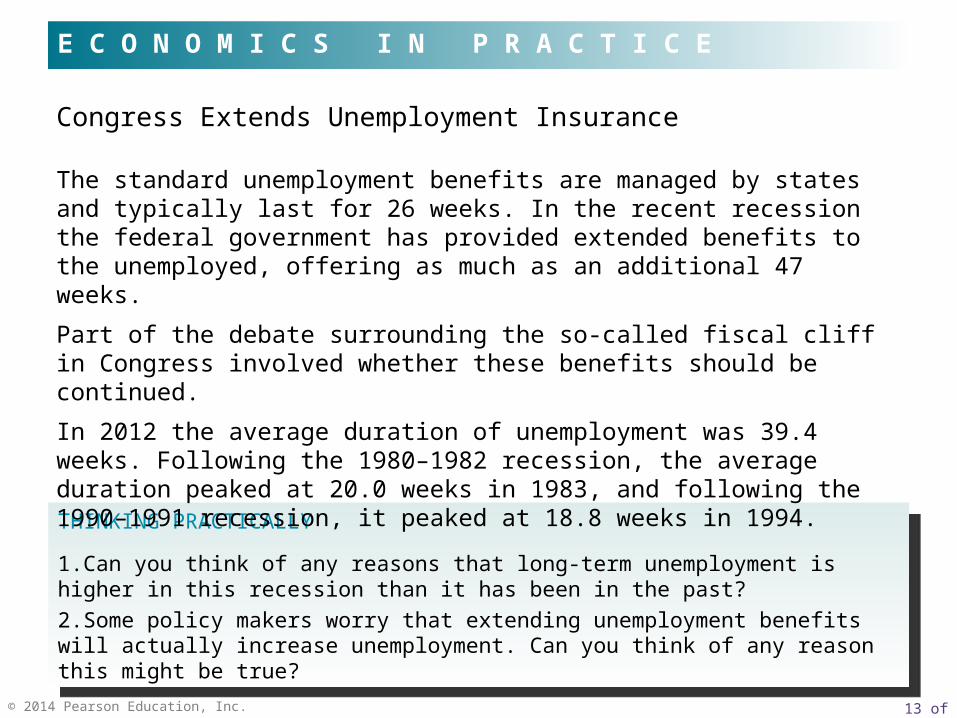
Congress Extends Unemployment Insurance
E C O N O M I C S I N P R A C T I C E
THINKING PRACTICALLY
1.Can you think of any reasons that long-term unemployment is higher in this recession than it has been in the past?
2.Some policy makers worry that extending unemployment benefits will actually increase unemployment. Can you think of any reason this might be true?
THINKING PRACTICALLY
1.Can you think of any reasons that long-term unemployment is higher in this recession than it has been in the past?
2.Some policy makers worry that extending unemployment benefits will actually increase unemployment. Can you think of any reason this might be true?
The standard unemployment benefits are managed by states and typically last for 26 weeks. In the recent recession the federal government has provided extended benefits to the unemployed, offering as much as an additional 47 weeks.
Part of the debate surrounding the so-called fiscal cliff in Congress involved whether these benefits should be continued.
In 2012 the average duration of unemployment was 39.4 weeks. Following the 1980–1982 recession, the average duration peaked at 20.0 weeks in 1983, and following the 1990–1991 recession, it peaked at 18.8 weeks in 1994.
14 of 28© 2014 Pearson Education, Inc.
Firms may not have enough information at their disposal to know what the market-clearing wage is.
In this case, firms are said to have imperfect information.
If firms have imperfect or incomplete information, they may simply set wages wrong—wages that do not clear the labor market.
Imperfect Information
15 of 28© 2014 Pearson Education, Inc.
The Longer You are Unemployed, the Harder it is to Get a Job
E C O N O M I C S I N P R A C T I C E
THINKING PRACTICALLY
1.What does this result tell us about how easy it is for firms to see worker quality?
THINKING PRACTICALLY
1.What does this result tell us about how easy it is for firms to see worker quality?
The authors of a recent paper conducted an interesting experiment to try to figure out what long-term unemployment does to one's eventual job prospects.
They sent out fictitious job resumes to real job postings in 100 U.S. cities. Over 12,000 resumes were sent in response to 3,000 job postings. Fictitious job applicants were randomly assigned unemployment durations of 1 to 36 months. The researchers then tracked “call backs” to these resumes.
The result? Call backs decreased dramatically as a response to unemployment duration. This effect was especially strong in cities that had strong job markets. The researchers suggested that employers were likely inferring low worker quality based on long duration of unemployment.
16 of 28© 2014 Pearson Education, Inc.
minimum wage laws Laws that set a floor for wage rates—that is, a minimum hourly rate for any kind of labor.
In 2013, the federal minimum wage was $7.25 per hour. If some teenagers can produce only $6.90 worth of output per hour, no firm would be willing to hire them.
The aggregate labor market is very complicated, and there are no simple answers to why there is unemployment. Which argument or arguments will win out in the end is an open question.
Minimum Wage Laws
An Open Question
17 of 28© 2014 Pearson Education, Inc.
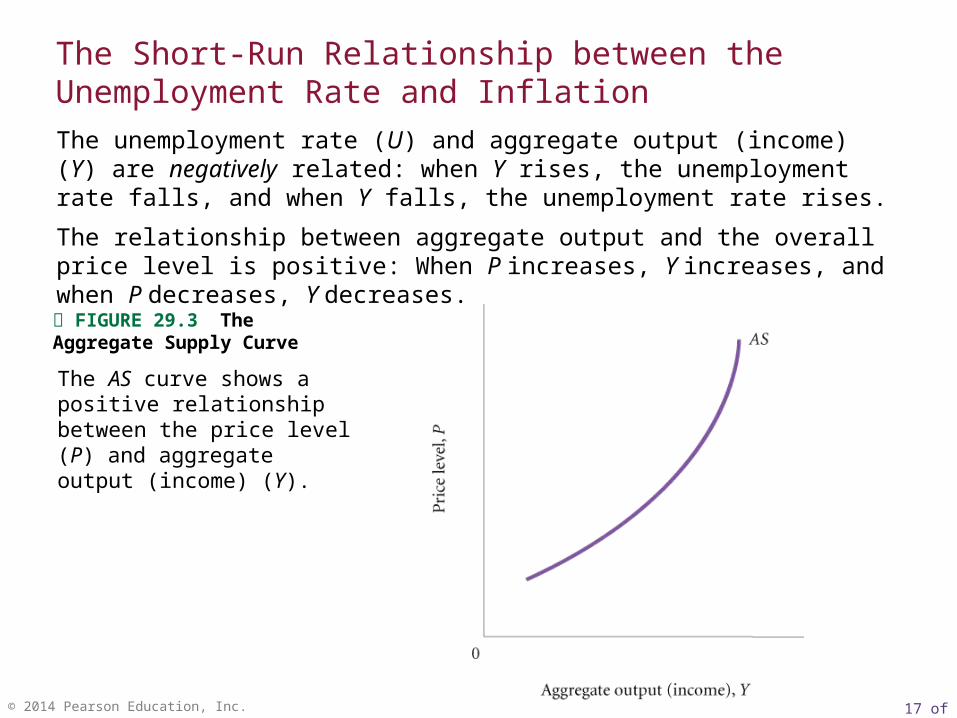
The AS curve shows a positive relationship between the price level (P) and aggregate output (income) (Y).
FIGURE 29.3 The Aggregate Supply Curve
The unemployment rate (U) and aggregate output (income) (Y) are negatively related: when Y rises, the unemployment rate falls, and when Y falls, the unemployment rate rises.
The relationship between aggregate output and the overall price level is positive: When P increases, Y increases, and when P decreases, Y decreases.
The Short-Run Relationship between the Unemployment Rate and Inflation

18 of 28© 2014 Pearson Education, Inc.
This curve shows a negative relationship between the price level (P) and the unemployment rate (U).
As the unemployment rate declines in response to the economy’s moving closer and closer to capacity output, the price level rises more and more.
FIGURE 29.4 The Relationship between the Price Level and the Unemployment Rate
The Short-Run Relationship between the Unemployment Rate and Inflation
19 of 28© 2014 Pearson Education, Inc.
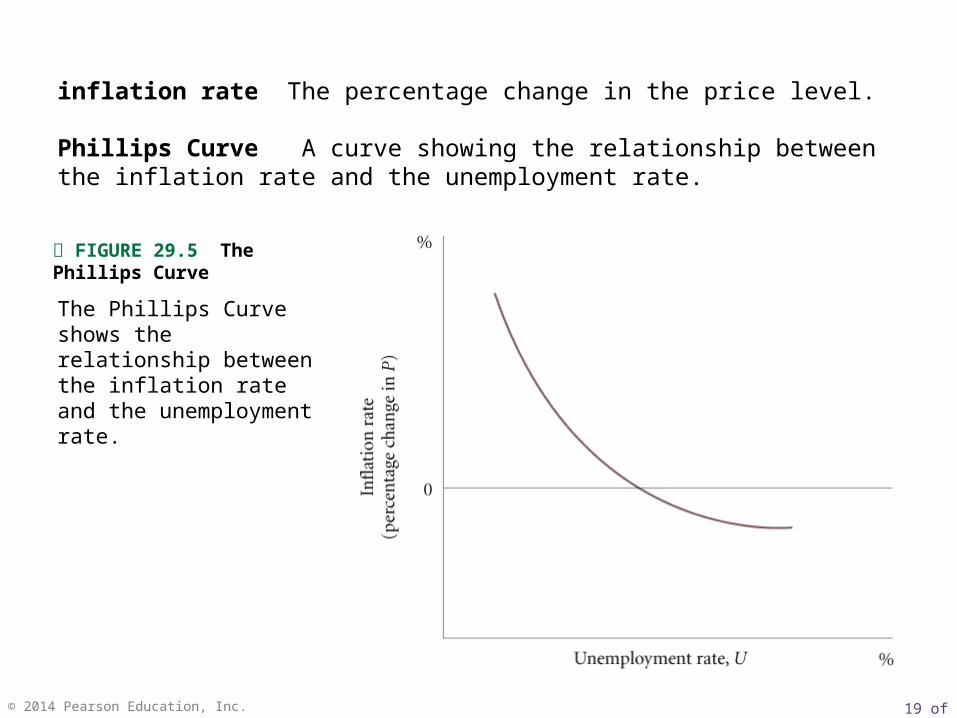
inflation rate The percentage change in the price level.
Phillips Curve A curve showing the relationship between the inflation rate and the unemployment rate.
The Phillips Curve shows the relationship between the inflation rate and the unemployment rate.
FIGURE 29.5 The Phillips Curve
20 of 28© 2014 Pearson Education, Inc.
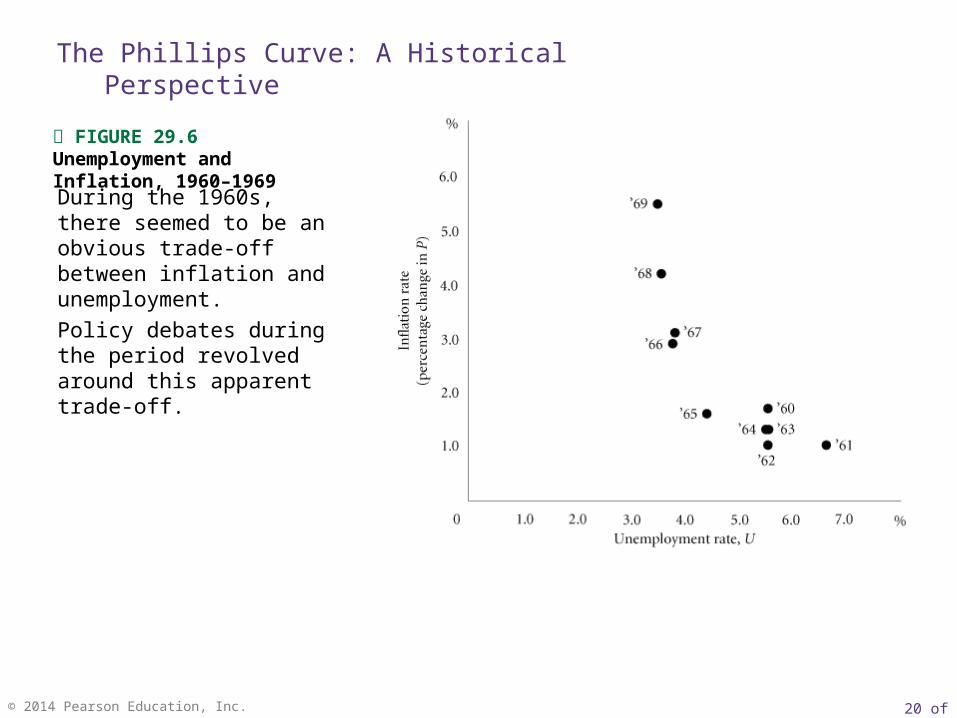
During the 1960s, there seemed to be an obvious trade-off between inflation and unemployment.
Policy debates during the period revolved around this apparent trade-off.
FIGURE 29.6 Unemployment and Inflation, 1960–1969
The Phillips Curve: A Historical Perspective
21 of 28© 2014 Pearson Education, Inc.
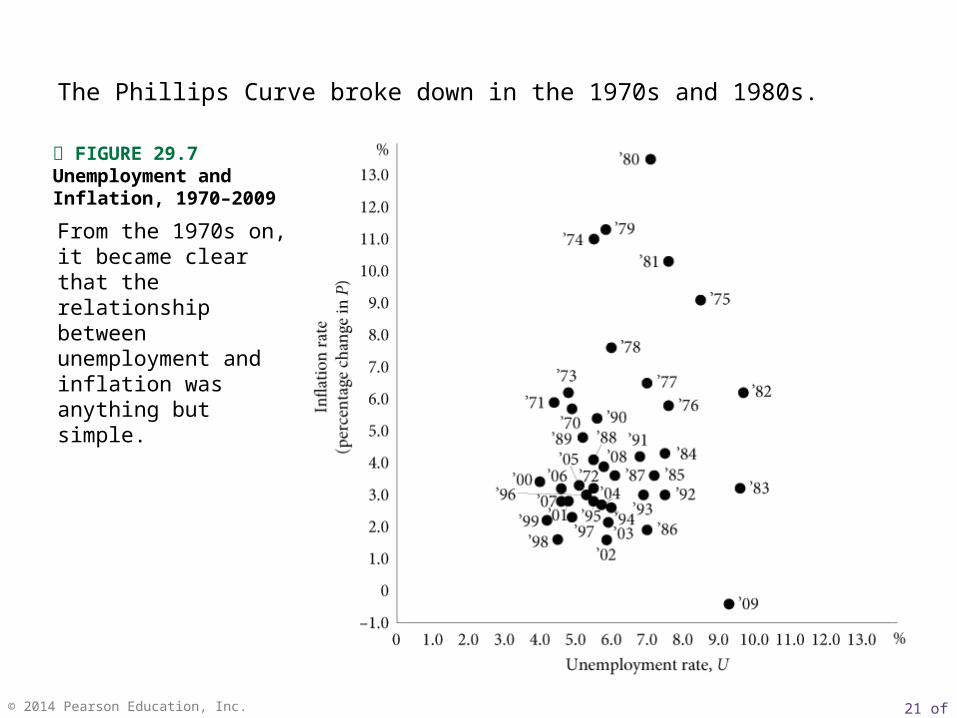
From the 1970s on, it became clear that the relationship between unemployment and inflation was anything but simple.
FIGURE 29.7 Unemployment and Inflation, 1970–2009
The Phillips Curve broke down in the 1970s and 1980s.

22 of 28© 2014 Pearson Education, Inc.
FIGURE 29.8 Changes in the Price Level and Aggregate Output Depend on Shifts in Both Aggregate Demand and Aggregate Supply
Aggregate Supply and Aggregate Demand Analysis and the Phillips Curve

23 of 28© 2014 Pearson Education, Inc.
FIGURE 29.9 The Price of Imports, 1960 I–2012 VI
The Role of Import Prices
The price of imports changed very little in the 1960s and early 1970s.
It increased substantially in 1974 and again in 1979-1980.
Between 1981 and 2002, the price of imports changed very little.
It generally rose between 2003 and 2008, fell somewhat in late 2008 and early 2009, rose slightly to 2011 and then remained flat.
24 of 28© 2014 Pearson Education, Inc.
If inflationary expectations increase, the result will be an increase in the rate of inflation even though the unemployment rate may not have changed. In this case, the Phillips Curve will shift to the right.
If inflationary expectations decrease, the Phillips Curve will shift to the left—there will be less inflation at any given level of the unemployment rate.
Expectations and the Phillips Curve
Inflation is affected by more than just aggregate demand. Where inflation depends on both the unemployment rate and cost variables, there will be no stable Phillips Curve unless the cost variables are not changing.
Therefore, the unemployment rate can have an important effect on inflation even though this will not be evident from a plot of inflation against the unemployment rate—that is, from the Phillips Curve.
Inflation and Aggregate Demand
25 of 28© 2014 Pearson Education, Inc.
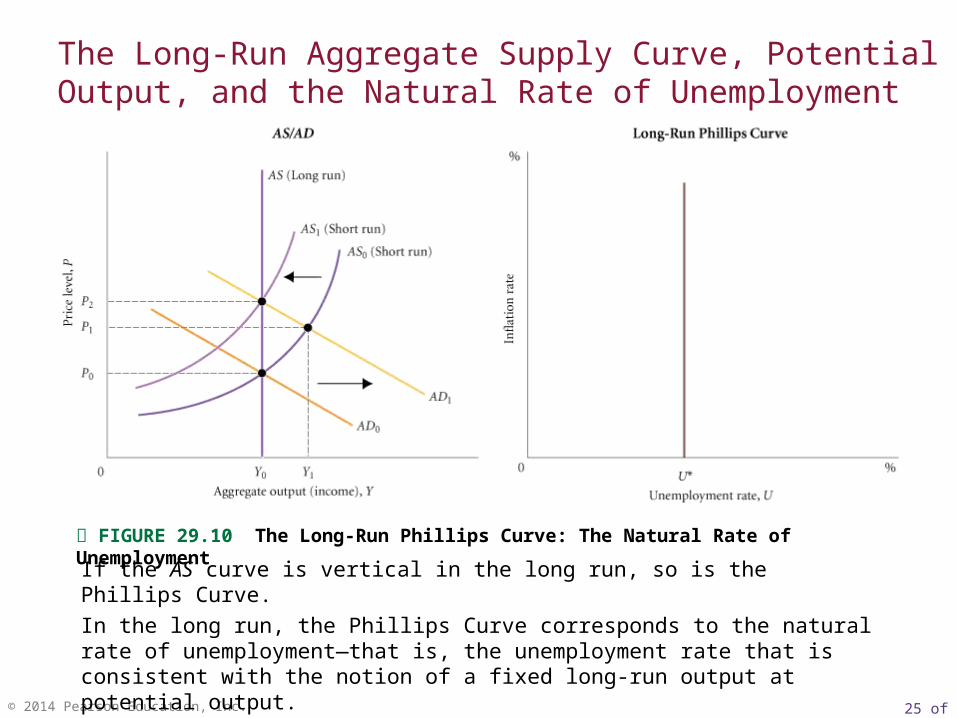
If the AS curve is vertical in the long run, so is the Phillips Curve.
In the long run, the Phillips Curve corresponds to the natural rate of unemployment—that is, the unemployment rate that is consistent with the notion of a fixed long-run output at potential output.
U* is the natural rate of unemployment.
FIGURE 29.10 The Long-Run Phillips Curve: The Natural Rate of Unemployment
The Long-Run Aggregate Supply Curve, Potential Output, and the Natural Rate of Unemployment
26 of 28© 2014 Pearson Education, Inc.
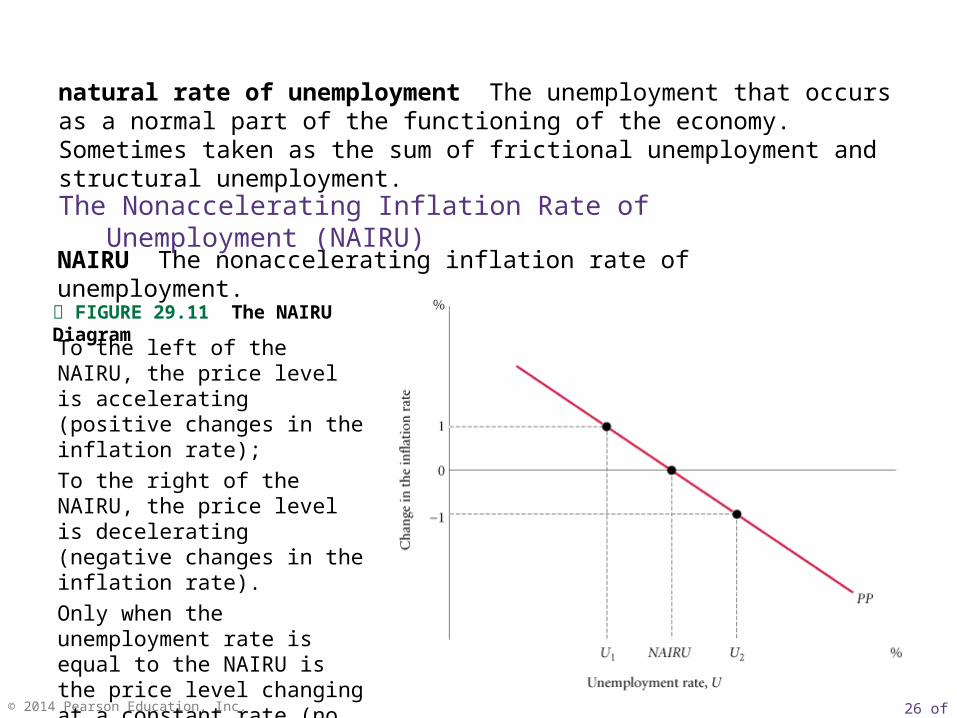
natural rate of unemployment The unemployment that occurs as a normal part of the functioning of the economy. Sometimes taken as the sum of frictional unemployment and structural unemployment.
NAIRU The nonaccelerating inflation rate of unemployment.
The Nonaccelerating Inflation Rate of Unemployment (NAIRU)
To the left of the NAIRU, the price level is accelerating (positive changes in the inflation rate);
To the right of the NAIRU, the price level is decelerating (negative changes in the inflation rate).
Only when the unemployment rate is equal to the NAIRU is the price level changing at a constant rate (no change in the inflation rate).
FIGURE 29.11 The NAIRU Diagram

27 of 28© 2014 Pearson Education, Inc.
Looking Ahead
This chapter concludes our basic analysis of how the macroeconomy works.
In the preceding seven chapters, we have examined how households and firms behave in the three market arenas—the goods market, the money market, and the labor market.
We have seen how aggregate output (income), the interest rate, and the price level are determined in the economy, and we have examined the relationship between two of the most important macroeconomic variables, the inflation rate and the unemployment rate.
In the next chapter, we use everything we have learned up to this point to examine a number of important policy issues.
28 of 28© 2014 Pearson Education, Inc.
cost-of-living adjustments (COLAs)
cyclical unemployment
efficiency wage theory
explicit contracts
frictional unemployment
inflation rate
labor demand curve
labor supply curve
minimum wage laws
NAIRU
natural rate of unemployment
Phillips Curve
relative-wage explanation of unemployment
social, or implicit, contracts
sticky wages
structural unemployment
unemployment rate
R E V I E W T E R M S A N D C O N C E P T S