Embed Size (px)
Citation preview
1
Philosophy of Sustainability
Scott Matthews12-712 / 19-622Lecture 3

Administrative Issues
HW 1 Due Today Few came to office hours – keep same
times
HW 2 Given Out, Due Next Wednesday
Lecture 1: 2

Rise of “Sustainable Development” as a Thought
Last reading – plenty of history on early efforts and recognition of managing resources (and the consequences of failing to do so)
Efforts achieving / failing “triumph over nature”
BY and large, technological progress over time has come at the expense of nature
Lecture 1: 3

Anti – Tech / Pro-Environment
Europe mostly civilized (i.e. developed) by 1800s. US mostly unspoiled land
Arguments of Manifest Destiny Goal to develop/inhabit the west like Europe
had doneThoreau / Emerson promoted the virtues
of an unspoiled wilderness as escape from civilization, technology, etc.
Lecture 1: 4

20th century
Massive technological progress – car, electricity, war efforts/production
New recognitions of natural limits
Florman: technology did not cause problems. Seeking comforts is human nature (free will). Blame humans not the technology
Lecture 1: 5

Brief commentary on utility
Utility = economic measure of well being E.g., “I get more utility by consuming
more” or “I get twice as much happiness drinking 2 beers as I do drinking one”
Lecture 1: 6

Define: Carrying capacity
Supportable population given demand for food or resources and the supply of those resources, without degrading future generations
Lecture 1: 7
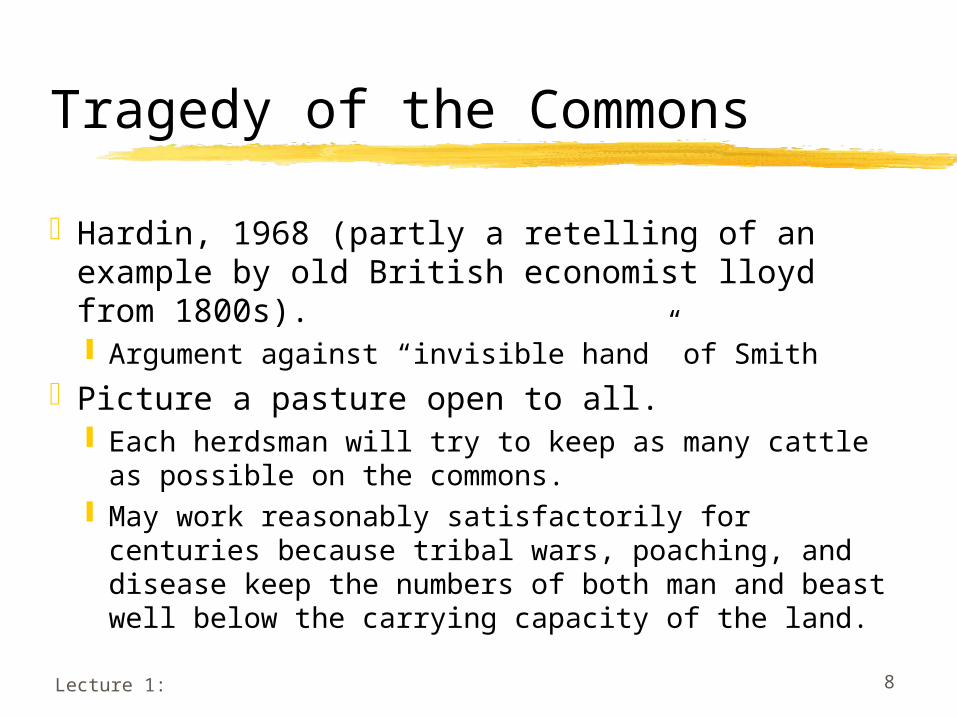
Tragedy of the Commons
Hardin, 1968 (partly a retelling of an example by old British economist lloyd from 1800s). Argument against “invisible hand” of Smith
Picture a pasture open to all. Each herdsman will try to keep as many cattle as
possible on the commons. May work reasonably satisfactorily for centuries
because tribal wars, poaching, and disease keep the numbers of both man and beast well below the carrying capacity of the land.
Lecture 1: 8

Each herdsman seeks to maximize his gain. Asks "What is the utility to me of adding one more animal to my herd?”. Two components Positive component is a function of the increment of
one animal. Since the herdsman receives all the proceeds from the sale of the additional animal, the positive utility is ~ + 1.
Negative is a function of the additional overgrazing created by one more animal. Since, however, the effects of overgrazing are shared by all the herdsmen, the negative utility for any particular decision making herdsman is only a fraction of - 1.
Lecture 1: 9
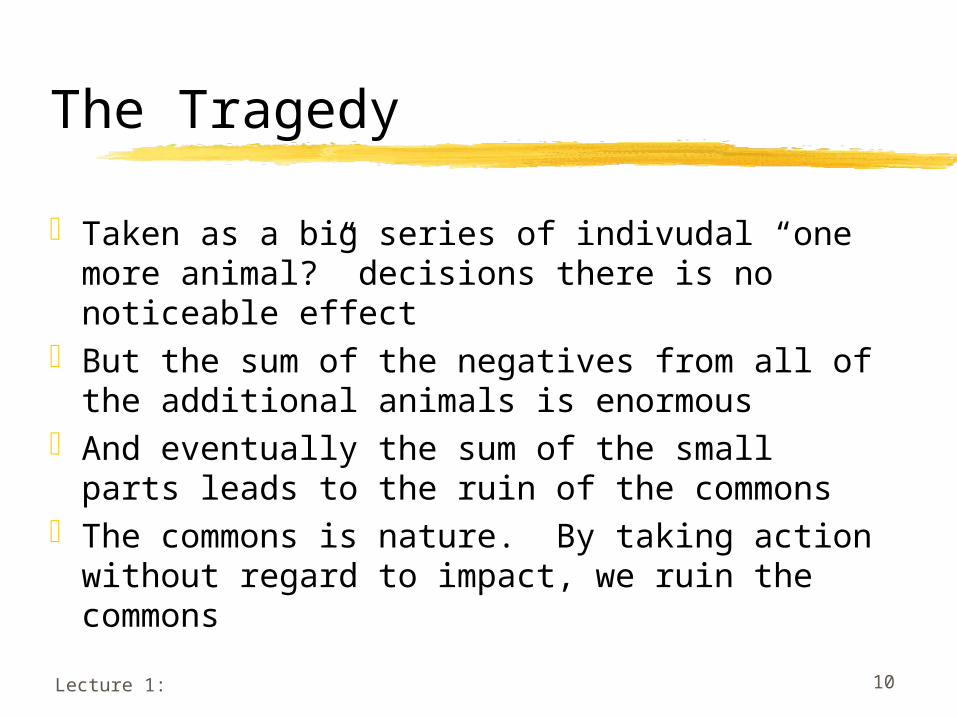
The Tragedy
Taken as a big series of indivudal “one more animal?” decisions there is no noticeable effect
But the sum of the negatives from all of the additional animals is enormous
And eventually the sum of the small parts leads to the ruin of the commons
The commons is nature. By taking action without regard to impact, we ruin the commons
Lecture 1: 10

Link to Population
Little tragedy of commons when population density (or population) is low
Brings us to IPAT – simple equation Environmental Impact = Population
× Affluence × Technology
Lecture 1: 11

IPAT – originally about T
Orginally pushed that I was mostly a function of T Observation that impacts of new technology
increase over time more than the rate of benefit that come with them
Over 20 years, consumption of beer only up slightly but nonreturnable bottles up 600%Bottles as technology? Need to replace bottles
Lecture 1: 12

Ehrlich et al: Independent P,A,T
Hard to dissociate population in variables Effect of population underestimated Leaded gasoline: Pop up 41%, VMT
doubled (affluence), emissions up 83% IPAT = 5.16, 416% increase (compared to
1.0) Without population, only 3.66 (266% inc) Popultion effect a clear multiplier
Lecture 1: 13

IPAT-like equations for climate change
Energy use =Pop * (GDP/person)*Energy/GDP
Same for carbon emissions (carbon/GDP)IE master equation:Env Impact = Pop * GDP/Person * Env
Impact/per-capita GDP is only definable for each impact separately
(without weighting methods)Lecture 1: 14

More from Chertow paper
Sample problems?
Lecture 1: 15

Julian Simon
Ingenuity is the ultimate resource Somehow we have survived despite
challenges Distinction between definitions of reources
Economic – do not exist until discovered, can be created (almost infinite supply of these)
PhysicalScarcity causes us to find alternatives to
physicalWe depend more on economics resources
Lecture 1: 16
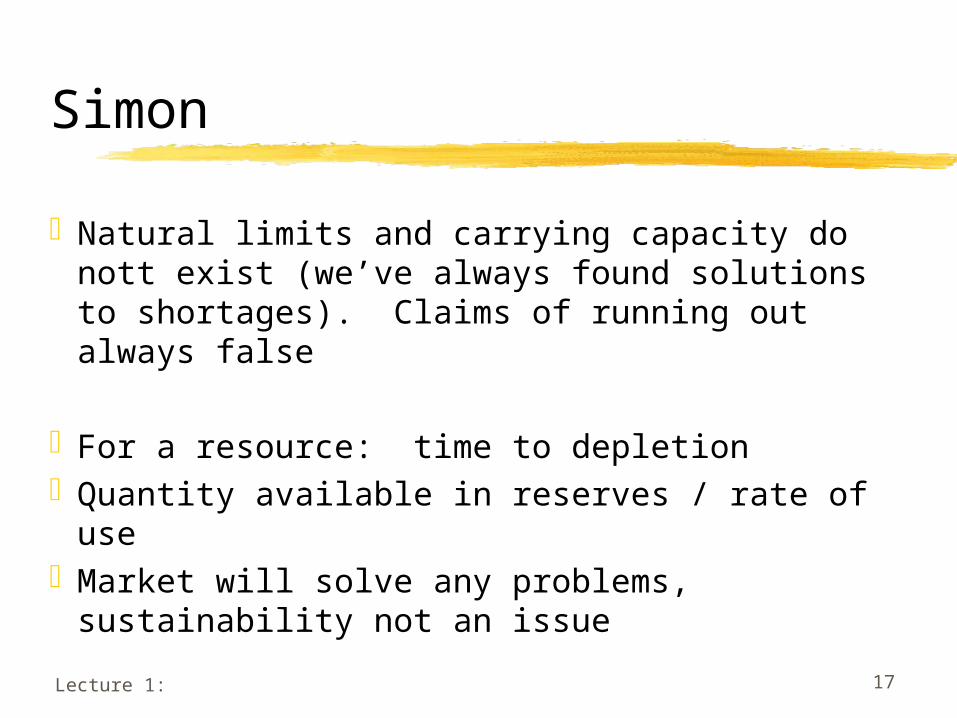
Simon
Natural limits and carrying capacity do nott exist (we’ve always found solutions to shortages). Claims of running out always false
For a resource: time to depletionQuantity available in reserves / rate of useMarket will solve any problems,
sustainability not an issueLecture 1: 17

Simon-Ehrlich Wager (1980)
Ehrlich was author of population book.
Central premise was that population growth was outstripping our ability to provide food – catastrophe (Simon disagrees)
As evidence, they made a wager (food data too easily manipulated) that resource prices would decrease.
Lecture 1: 18

Wager continued
Simon: resource prices will not rise in long run
Simon told Ehrlich he could pick any commodity he wanted, select any date in the future (1+ year)
Ehrlich chose 5 metals: copper, chromoum, nickel, tin, tungsten (Ehrlich up, Simon down). On paper bought $200 of each Payoff date 9/29/90. Inflation adjusted prices Winner paid loser net gain or loss
Lecture 1: 19

Results of Wager
Over that 10 years: Population increased by 800 million
(largest one decade increase in history) 3/5 decreased in absolute terms, all 5
with inflation (some 50% less)
Ehrlich mailed a check for $576 to Simon
Lecture 1: 20

Bjorn Lomborg – Skeptical ENvironmentalist
Environmental dangers overstatedShows stats that refute popularly stated
beliefs and conclusions about environmentSummary:
Big picture is global improvement in humanity Pollution/environmental problems have peaked No sign of reaching carrying capacity soon, that
we have exhausted our resources, or that we have irreparably harmed nature
Lecture 1: 21

His evidence
Crop yields, food prouction per capita increased (50-100 yrs), so has life expectancy and personal income
He says (fairly) that environmentalists inject their bias into their work by using poor or misleading data, then similarly make bad visuals
Lecture 1: 22

Recent: Al Gore hockey stick chart
Graph that shows arctic warming and relates it to ice melting
But in previous warming periouds, inconsistent melting showed up in data
Lecture 1: 23

Lecture 1: 24