Embed Size (px)
Citation preview
1
Population and Immigration
Sociology 102

2
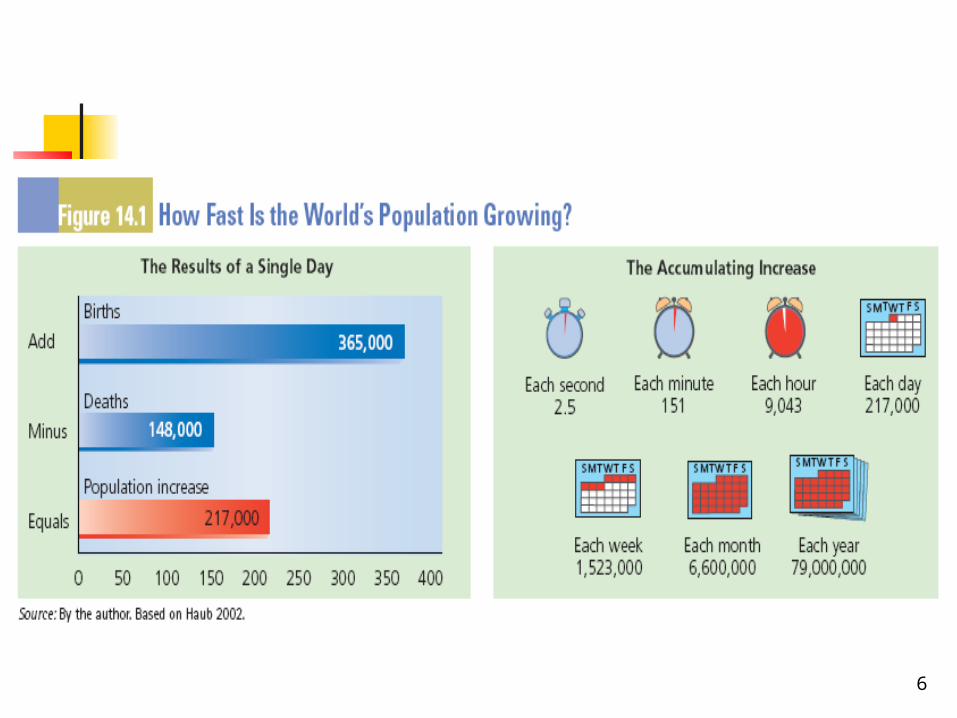
The world’s population continues to increase. There are now over 6 billion people on earth
The majority of this growth is taking place in developing countries.
Adding another 3 billion people to the world population by 2050 will create major problems of migration, environmental pressure, and resource management
3
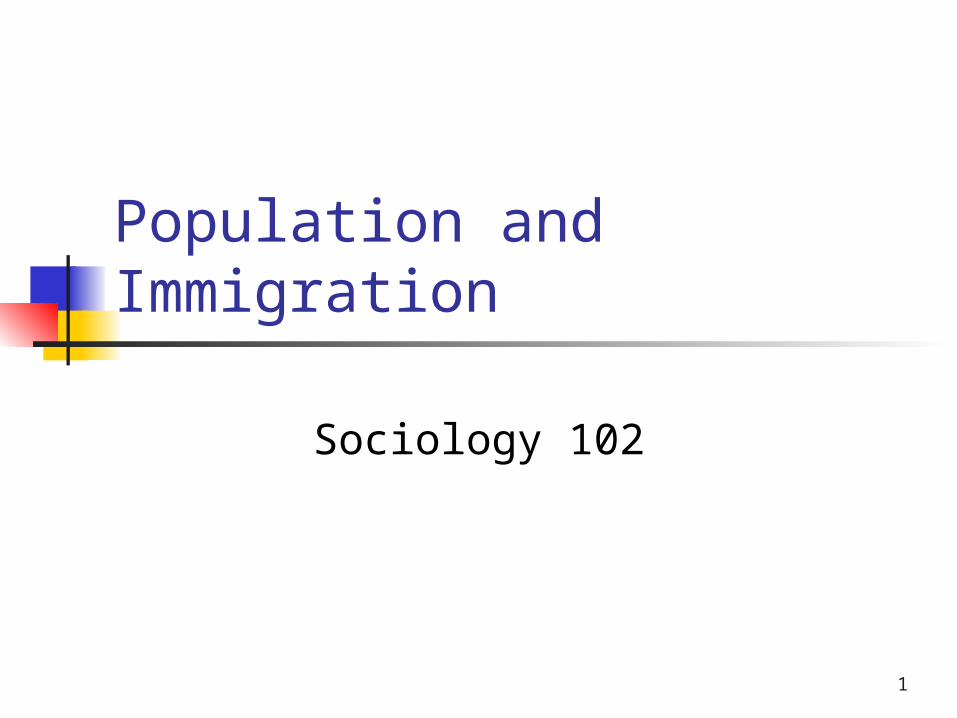
Demography is the study of the size, composition and distribution of human populations
Crude Birthrate is the number of babies born in a year per 1,000 population
U.S birth rate for 2007 is 14.1Crude Death rate is the number of people that
die in a year divided by the total population U.S. death rate for 2007 was 8.2 As a whole, the world is not reproducing at a
higher rate, but people are living longer
4
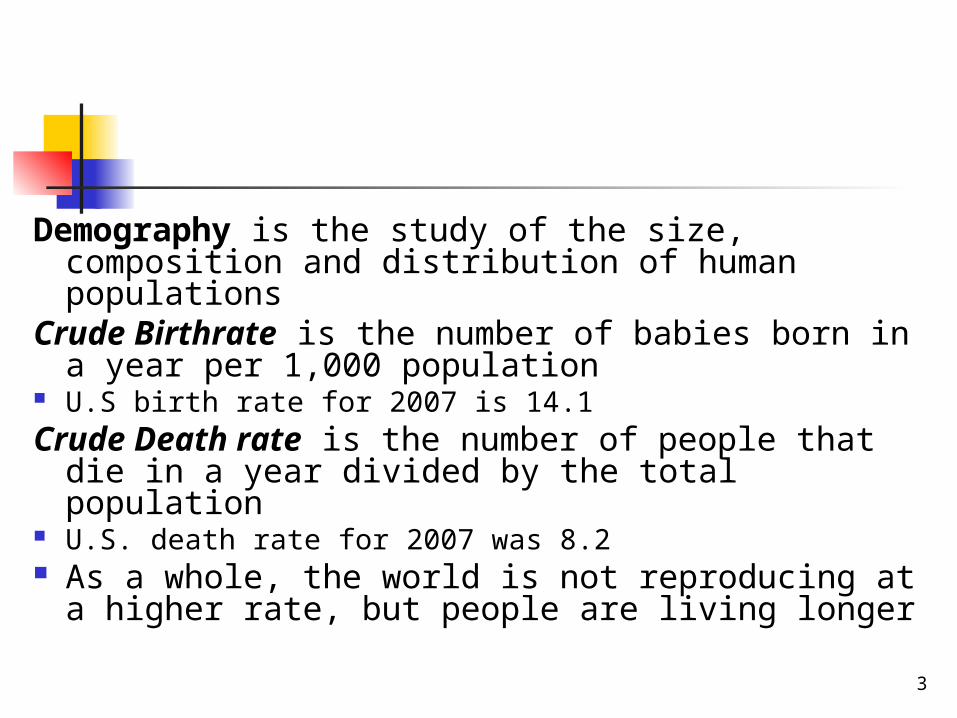
The difference between the crude birthrate and the death rate is referred to as the rate of population growth (natural increase)
The three principal measures of population 1. birth rate or fertility, 2. death mortality, and 3. migration
5
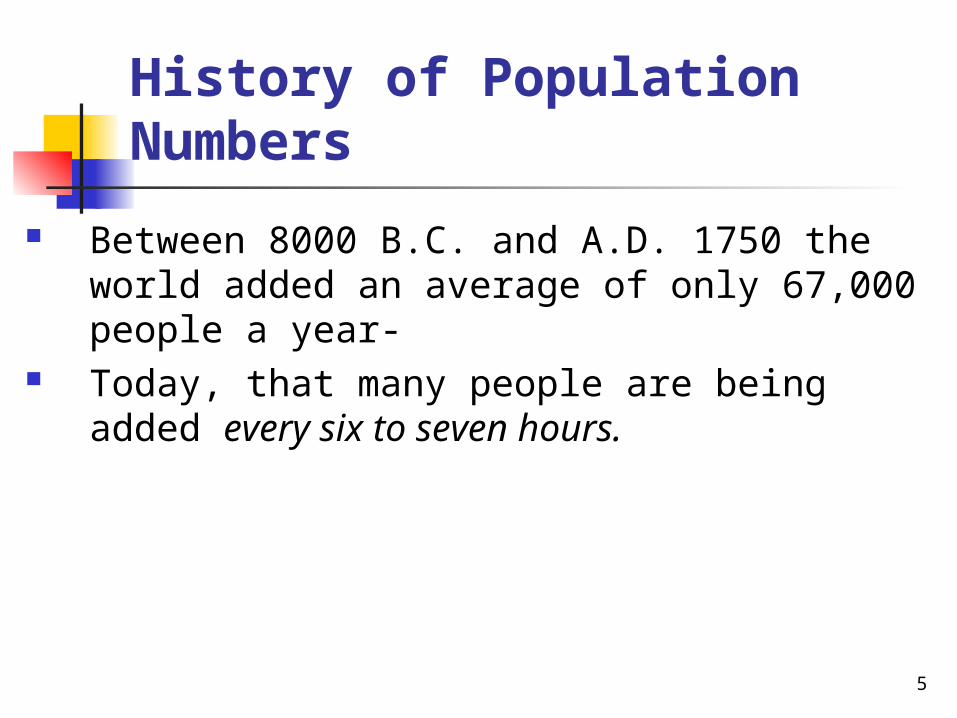
History of Population Numbers
Between 8000 B.C. and A.D. 1750 the world added an average of only 67,000 people a year-
Today, that many people are being added every six to seven hours.
6
7
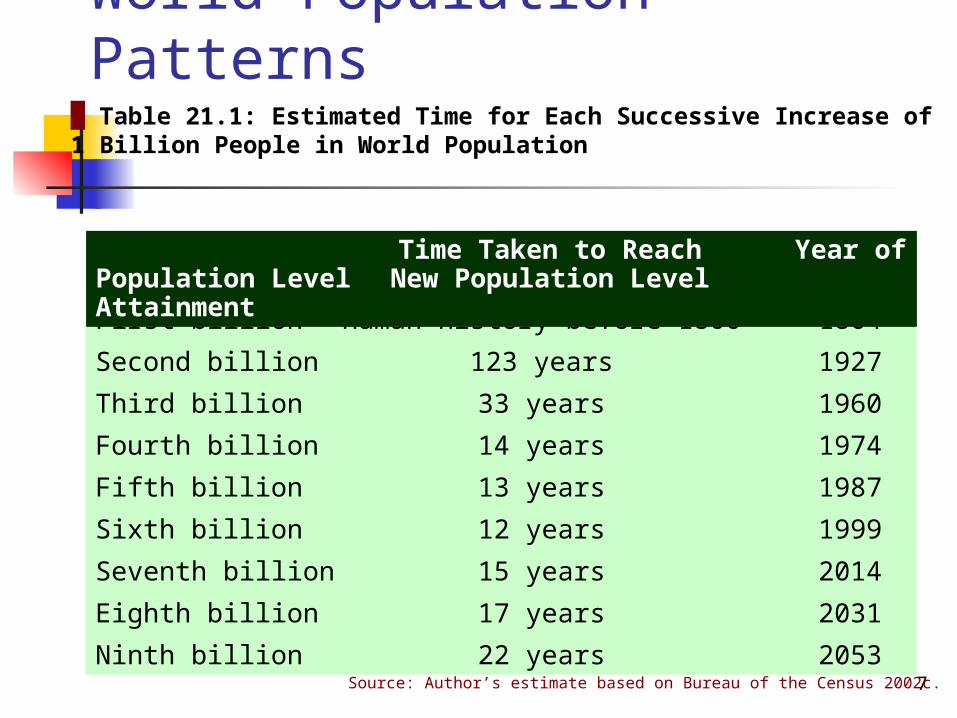
World Population Patterns█ Table 21.1: Estimated Time for Each Successive Increase of 1 Billion People in World Population
First billion Human history before 1800 1804
Second billion 123 years 1927
Third billion 33 years 1960
Fourth billion 14 years 1974
Fifth billion 13 years 1987
Sixth billion 12 years 1999
Seventh billion 15 years 2014
Eighth billion 17 years 2031
Ninth billion 22 years 2053
Time Taken to Reach Year ofPopulation Level New Population LevelAttainment
Source: Author’s estimate based on Bureau of the Census 2002c.

8
Figure 14-1 (p. 448)World Population Growth from 8000 B.C. to A.D. 2000Source: Data from Office of Technology Assessment.
9
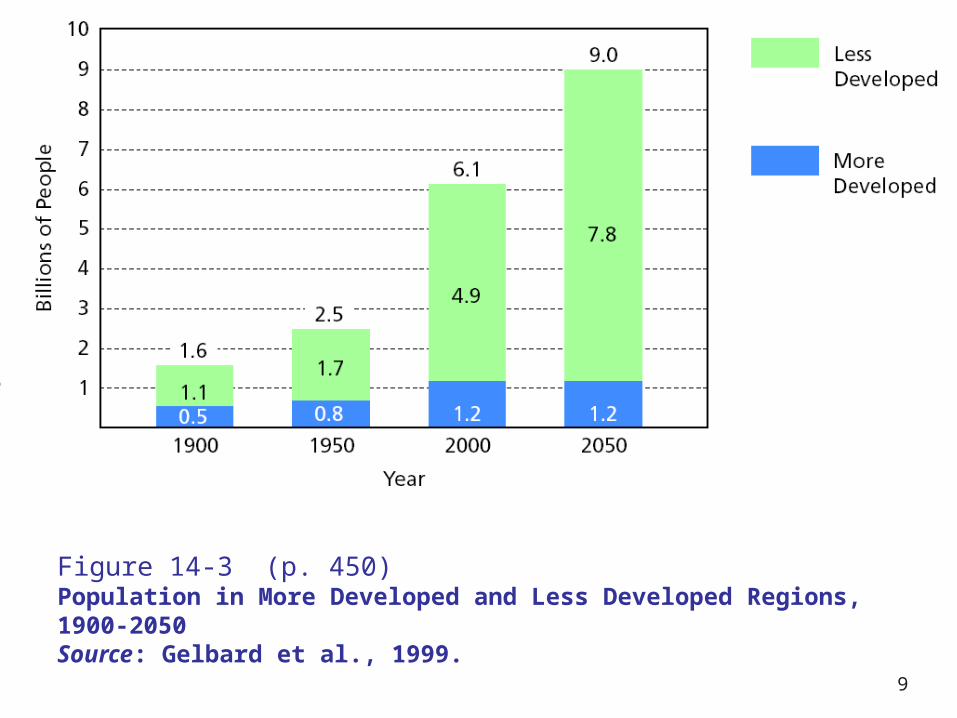
Figure 14-3 (p. 450)Population in More Developed and Less Developed Regions, 1900-2050Source: Gelbard et al., 1999.
10
The Impact of Population Growth
The reverend Thomas Malthus was among the first to point out the dangers of unrestricted population growth
Malthus argued that the human population naturally increased more rapidly than its food supply. Food supplies increase arithmetically (1,2,3,4,5), but uncontrolled populations increase geometrically (1,2,4,8,16,).
11
Majority of nations have a population growth rate of .1 percent to 3.0 percent
Industrial nations are at the low end with developing nations at the high end of the growth rate In the near future, the population of less developed
nations is likely to double
Russia and many other European nations have been experiencing extremely slow or even negative rates of natural population increase

12
The Demographic Transition
What explains the rapid world population growth of the past few centuries?
Demographic transition is the process by which populations change through patterns of high-low birth rates and high-low death-rates
- According to this theory, there are three distinct stages of population growth

13
1.Pre Transition Stage or Pre-industrial stage: Both birthrates and death rates are high and population growth is moderate.
Birth rates are more or less canceled out by a high death rate.
throughout much of human history, societies have been in this pre-industrial stage.

14
The primary reason for the low rate of population growth in the world prior to 1750 was the relatively high death rate that existed in practically every society.
First stage is associated with poor sanitation disease, primitive farming and lack of medical knowledge
15
Transitional Stage II
Transitional Stage II: the process of industrialization begins, and technological improvements bring a sharp decline in death rates
Rapid growth Improvements in sanitation Nutrition Medicine Occurred first in Northwest Europe Second stage is found in most developing
nations today
16
cultural values still encouraged people to have large families so the birthrate stayed high.
17
Post Transition Stage III: is characterized as by low birthrates and low death rates, bringing population growth control
Medicine became more effective in controlling acute and chronic diseases.
Cultural values regarding childbearing, urbanization and increasing education led couples to desire smaller families than in the past

18
19
Industrialization also prolongs life by giving people safer water, and better diets, clothing, housing, and sanitation
The demographic transition first occurred in northwestern Europe. This trend followed in North America, Australia, and New Zealand. Latin America remains in the middle phase.
20
The Less Developed Countries and Food and Hunger
The impact of population growth has been the most devastating in the poor nations
Every 3.6 seconds someone somewhere dies of hunger; and children account for 75 percent of these deaths
It is estimated that 10 to 20 percent of the world’s people suffer from chronic hunger or malnutrition
21
Three-quarters of a billion people are hungry in a world where there is plenty to eat.
Hunger is a paradox in that there is an abundance of low cost food, but the poor lack the income to purchase food and to have access to food.
Poverty and politics are, by far, the primary causes of hunger in the world
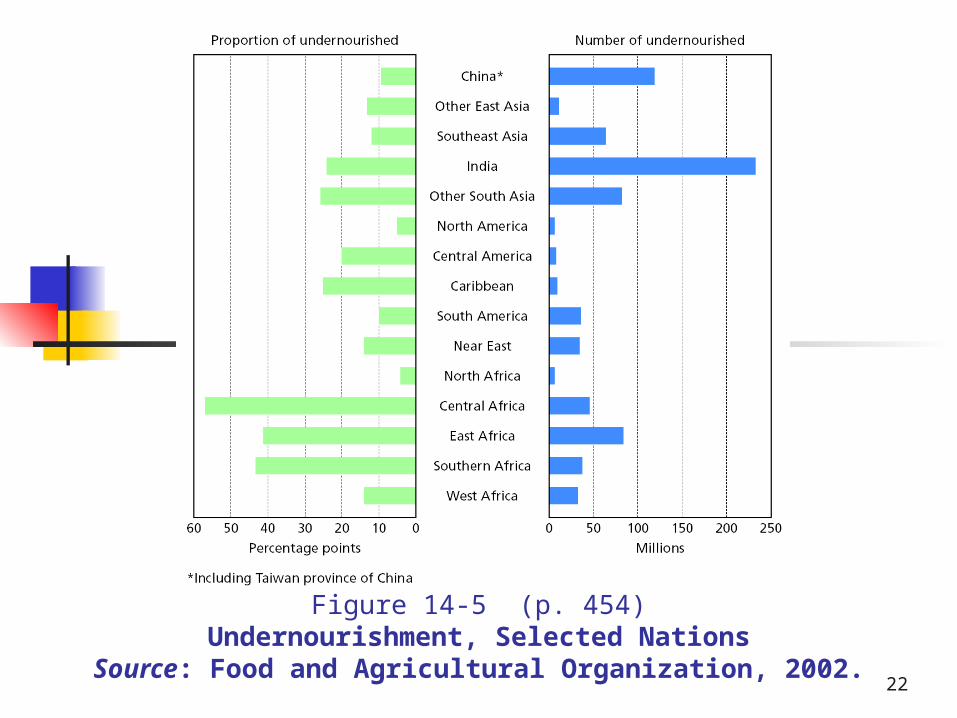
22
Figure 14-5 (p. 454)Undernourishment, Selected Nations
Source: Food and Agricultural Organization, 2002.
23
United States Population The US population is growing at a rate of
about 1 percent per year, far slower than those of the less developed nations
Natural increase (just over 60%) is the most important source of growth
Forty percent is due to net migration The U.S. population has reached 300 million
and is the world's third largest, after China and India
24
U.S. Population
In the US, there is one birth every 8 seconds, one death every 11 seconds, one international migrant every 25 seconds for a net gain of one person every 13 seconds

25

26
Table 14-4 (p. 460)Population of the United States and Selected More Developed Countries, 2002 and 2050 (Projected)

27
Population Control
Population control usually takes three approaches
1. Reduce the birthrate of a population2. Control fertility to achieve zero rate of
population growth3. Achieve a negative rate of growth reducing
the size of the population
28
ZPG
Zero Population Growth is an organization that advocates no population growth as soon as possible, through measures like
1. Birth control2. Legalized abortion3. Education and changing attitudes on family
29
IMMIGRATION Immigration happens in all corners of the
world. But the United States leads the world in total number of immigrants
The INS estimates that about 30 million people come across the boarders of the United States every year.
The concentration of new immigrants in a few metropolitan regions greatly adds to the problems of both immigrants and nonimmigrant in those areas.

30
The phenomenon of chain migration, the primary cause of this urban concentration, refers to the tendency of immigrants to migrate to areas where they have kin and others from their home communities.
The uneven distribution of immigrants greatly adds to the costs of education and health care in the cities in which they become concentrated

31
Undocumented Immigrants
It is not clear exactly what effect illegal residents have on the U.S. economy.
They may take some jobs away from native-born residents, but they also perform functions that citizens and reluctant to do – “dirty work” or stoop labor on row crops.