Embed Size (px)
Citation preview
1
Practicals, Methodology & Statistics II
Laura McAvinue
School of Psychology
Trinity College Dublin

3
Aims of Course
• To provide students with practical skills needed to analyse quantitative data from empirical research, such as final year projects.
• Includes tuition on the most commonly used statistical procedures

4
Course Outline
Null hypothesis significance testing & statistical power
Correlation
Regression
Simple linear regression
Multiple linear regression
Factor analysis
Analysis of variance (ANOVA)
Between groups ANOVA
Repeated measures ANOVA
Factorial ANOVA

5
Course Details
• Computer room
• Monday 4pm
• Thursday 11am
• Week 9: Two hour assessment– Wed 4th March 10-12– Thurs 5th March 11-1

6
Null Hypothesis Significance Testing
• Inferential Statistics
• Basis of most statistical tests that you will do
• Let’s begin with an example
7
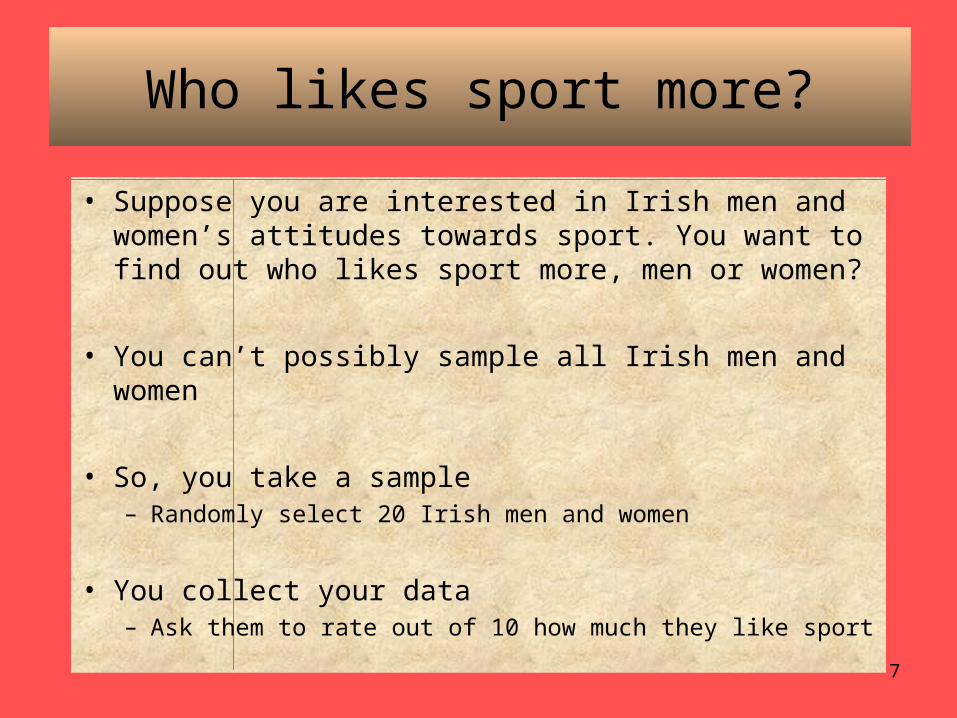
Who likes sport more?
• Suppose you are interested in Irish men and women’s attitudes towards sport. You want to find out who likes sport more, men or women?
• You can’t possibly sample all Irish men and women
• So, you take a sample– Randomly select 20 Irish men and women
• You collect your data– Ask them to rate out of 10 how much they like sport
8
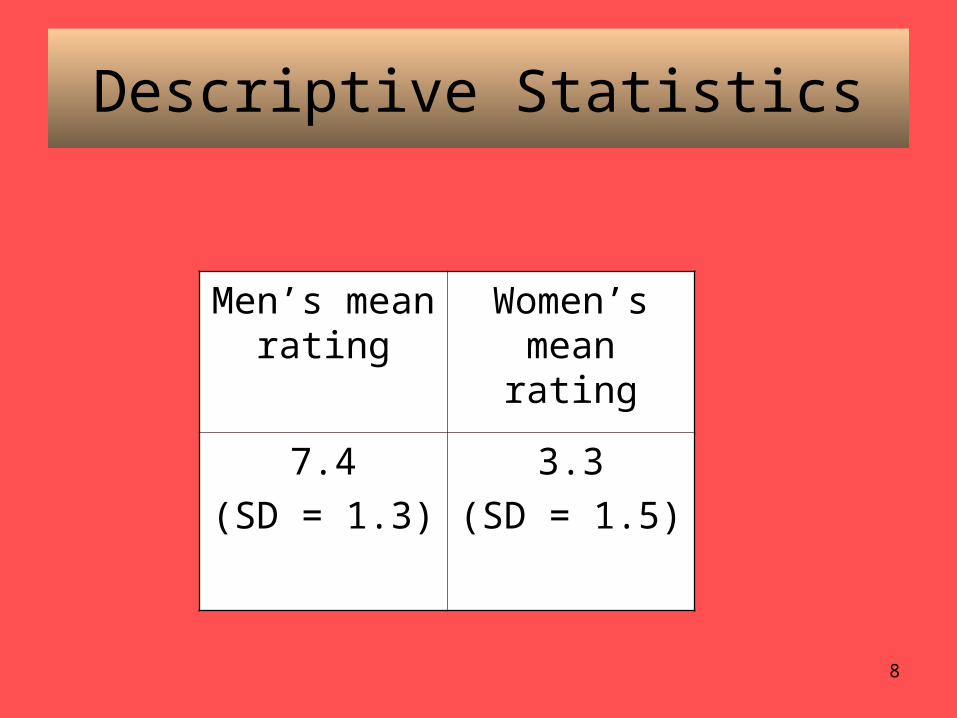
Descriptive Statistics
Men’s mean rating
Women’s mean rating
7.4
(SD = 1.3)
3.3
(SD = 1.5)

9
Descriptive Statistics
0
1
2
3
4
5
6
7
8
Men Women
Mea
n Ra
ting
10
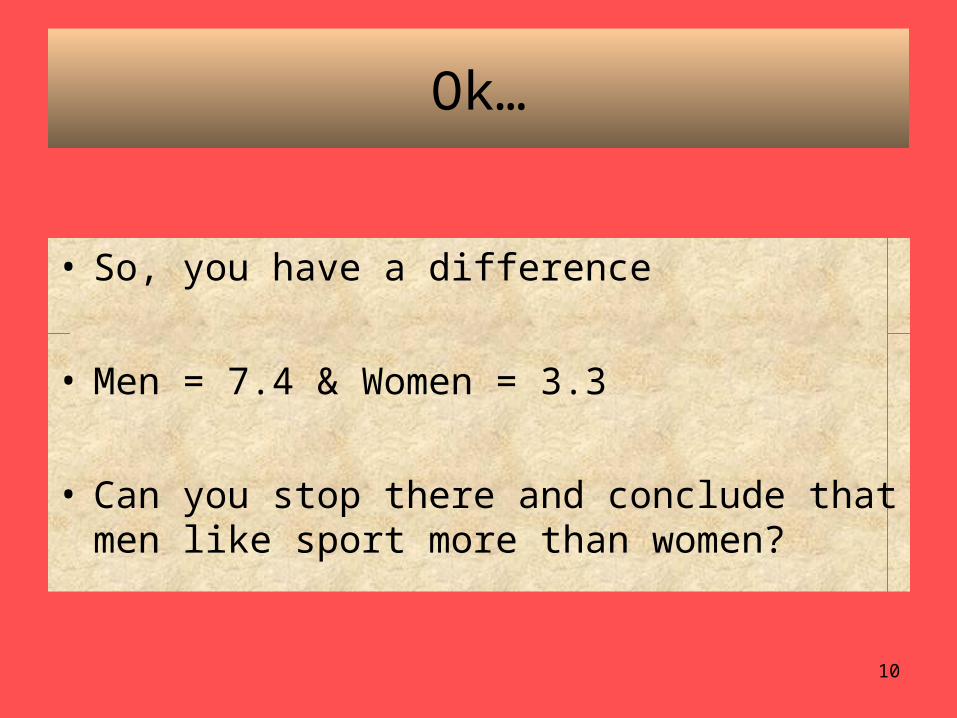
Ok…
• So, you have a difference
• Men = 7.4 & Women = 3.3
• Can you stop there and conclude that men like sport more than women?
11
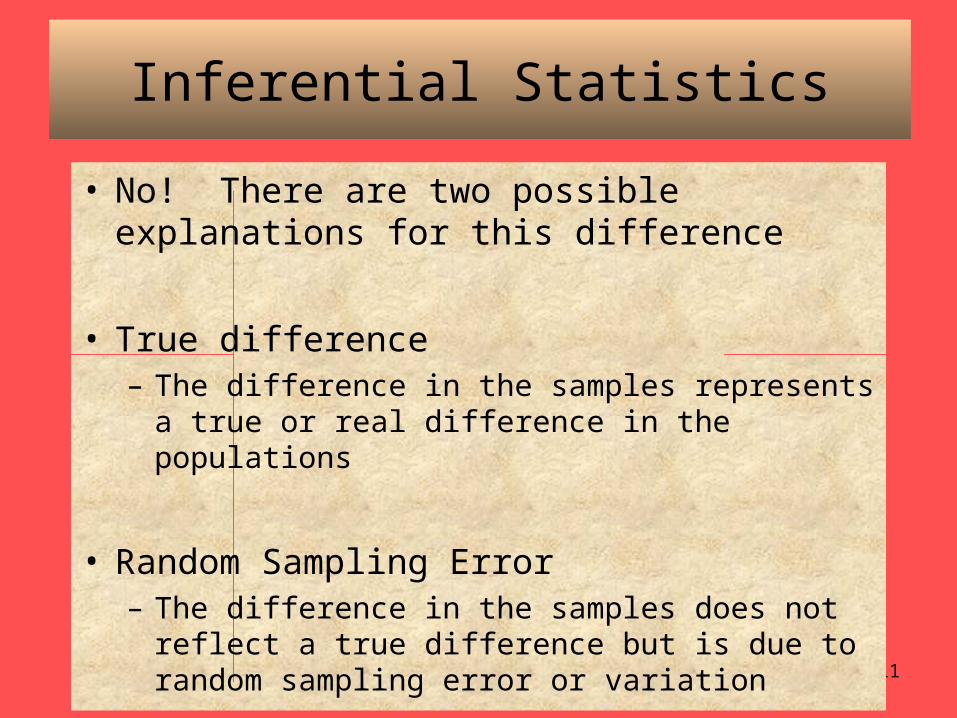
Inferential Statistics
• No! There are two possible explanations for this difference
• True difference– The difference in the samples represents a true or
real difference in the populations
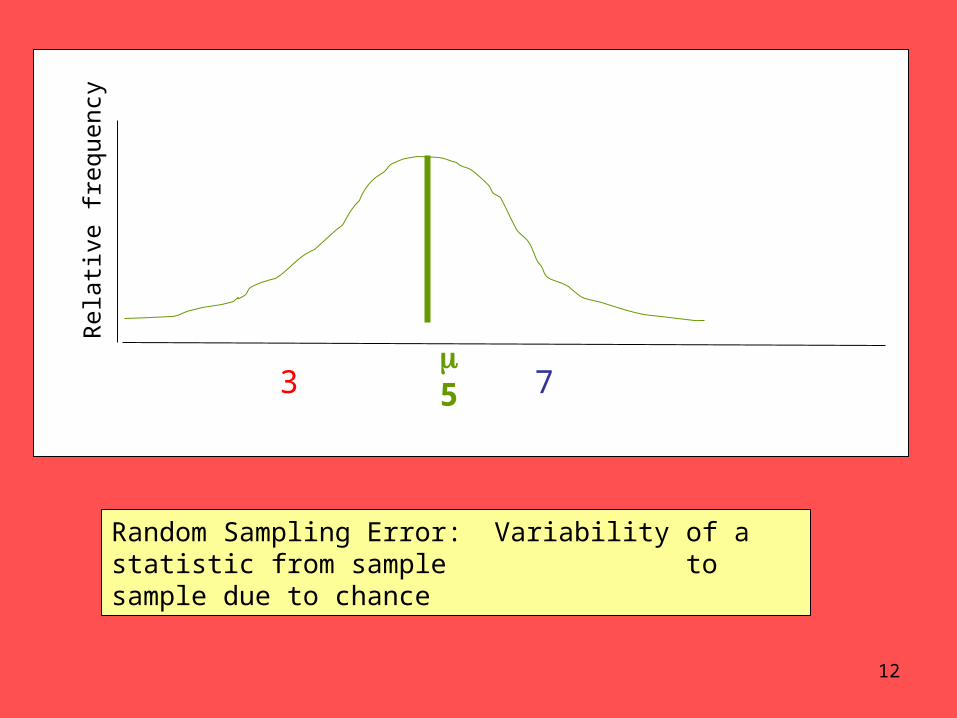
• Random Sampling Error– The difference in the samples does not reflect a
true difference but is due to random sampling error or variation
12
Rela
tive f
requ
ency
53 7
Random Sampling Error: Variability of a statistic from sample to sample due to chance
13
Rela
tive f
requ
ency
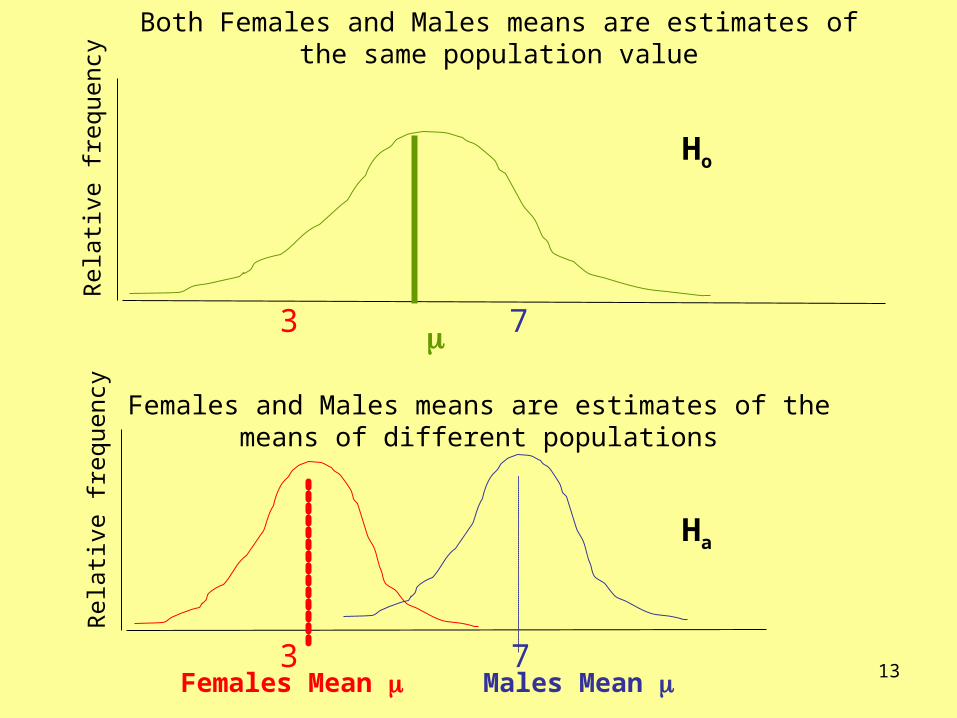
Both Females and Males means are estimates of the same population value
Rela
tive f
requ
ency
Females Mean Males Mean
Females and Males means are estimates of the means of different populations
Ho
Ha
3
3
7
7
14
Logic of statistical testing
• How do we distinguish between these two possibilities?
• Null Hypothesis Significance Testing– Proceeds in a series of steps
15
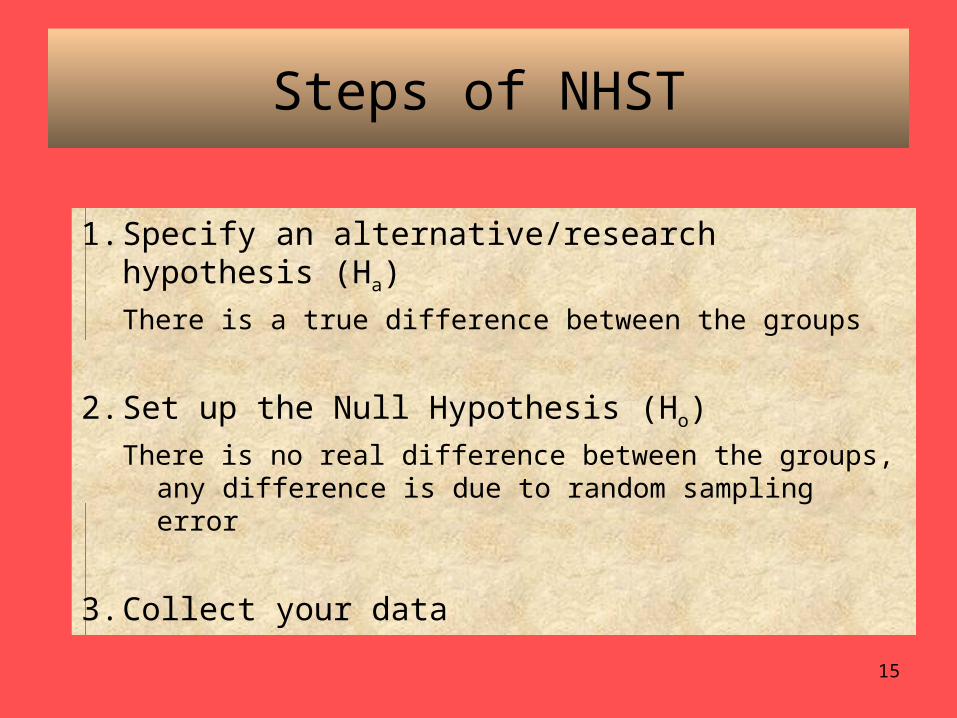
Steps of NHST
1. Specify an alternative/research hypothesis (Ha)
There is a true difference between the groups
2. Set up the Null Hypothesis (Ho)
There is no real difference between the groups, any difference is due to random sampling error
3. Collect your data
16
Steps of NHST
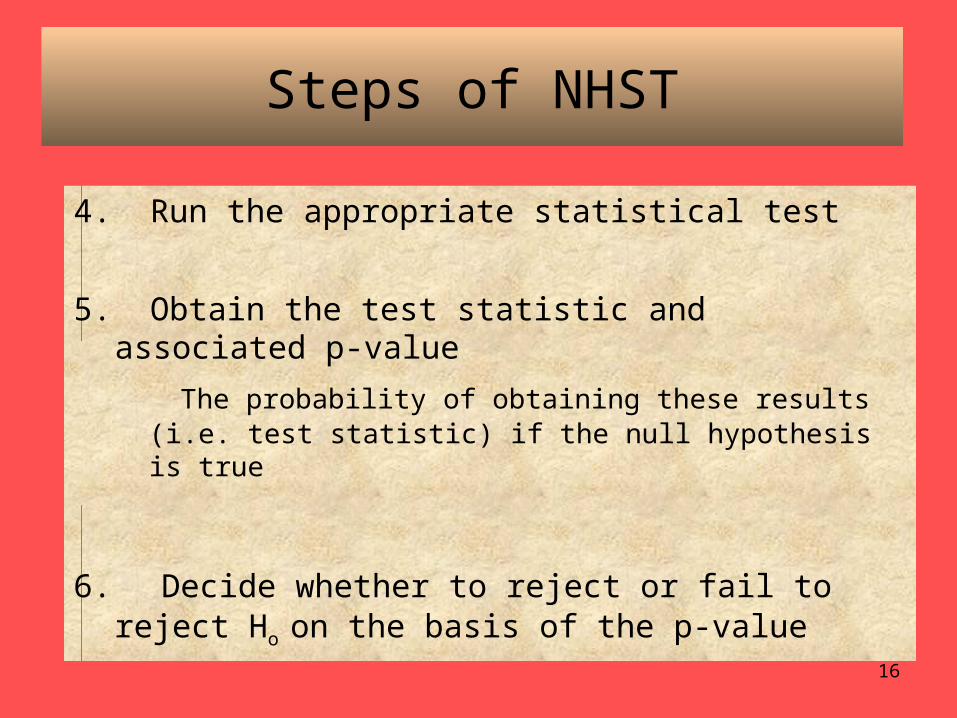
4. Run the appropriate statistical test
5. Obtain the test statistic and associated p-value
The probability of obtaining these results (i.e. test statistic) if the null hypothesis is true
6. Decide whether to reject or fail to reject Ho on the basis of the p-value
17
Decision Making
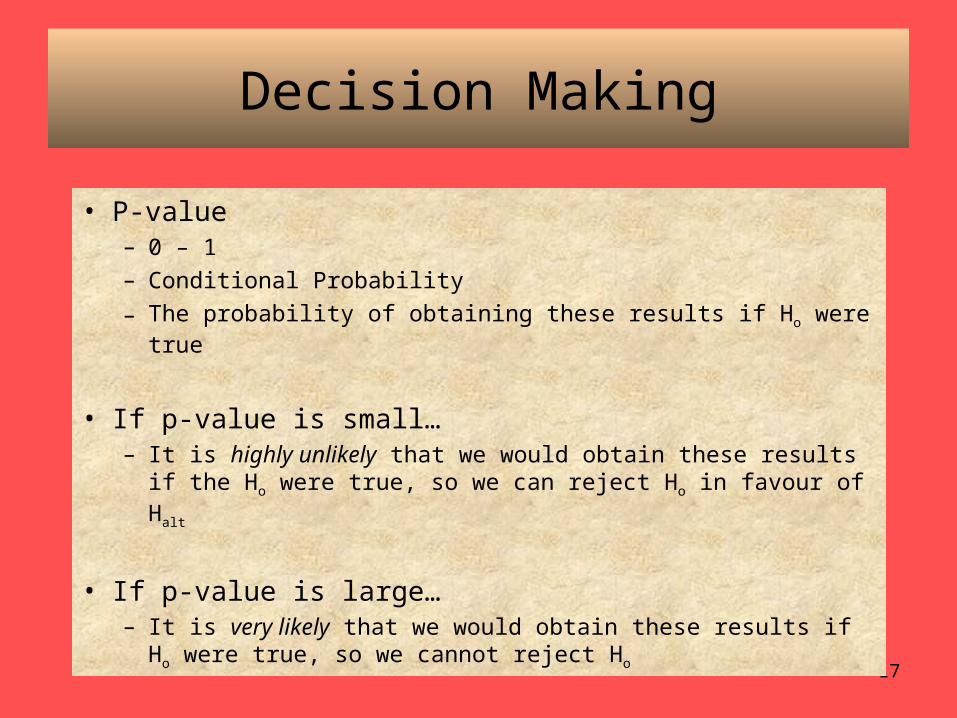
• P-value– 0 – 1– Conditional Probability
– The probability of obtaining these results if Ho were true
• If p-value is small…– It is highly unlikely that we would obtain these results if the
Ho were true, so we can reject Ho in favour of Halt
• If p-value is large…– It is very likely that we would obtain these results if Ho were
true, so we cannot reject Ho
18
Decision Making
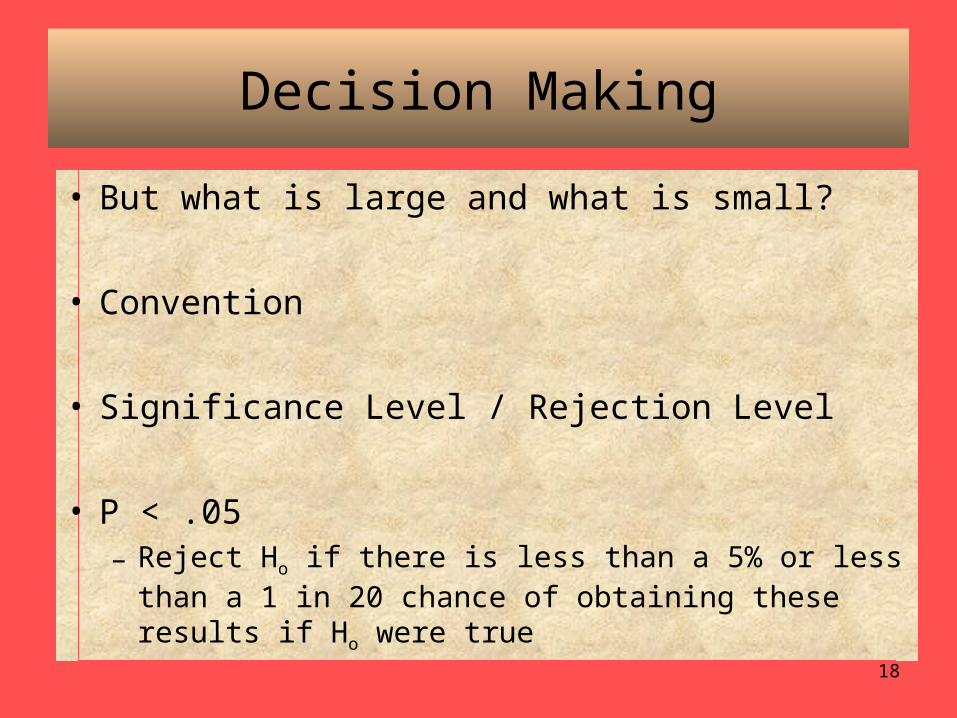
• But what is large and what is small?
• Convention
• Significance Level / Rejection Level
• P < .05– Reject Ho if there is less than a 5% or less than a 1 in
20 chance of obtaining these results if Ho were true
19
Let’s go back to our example
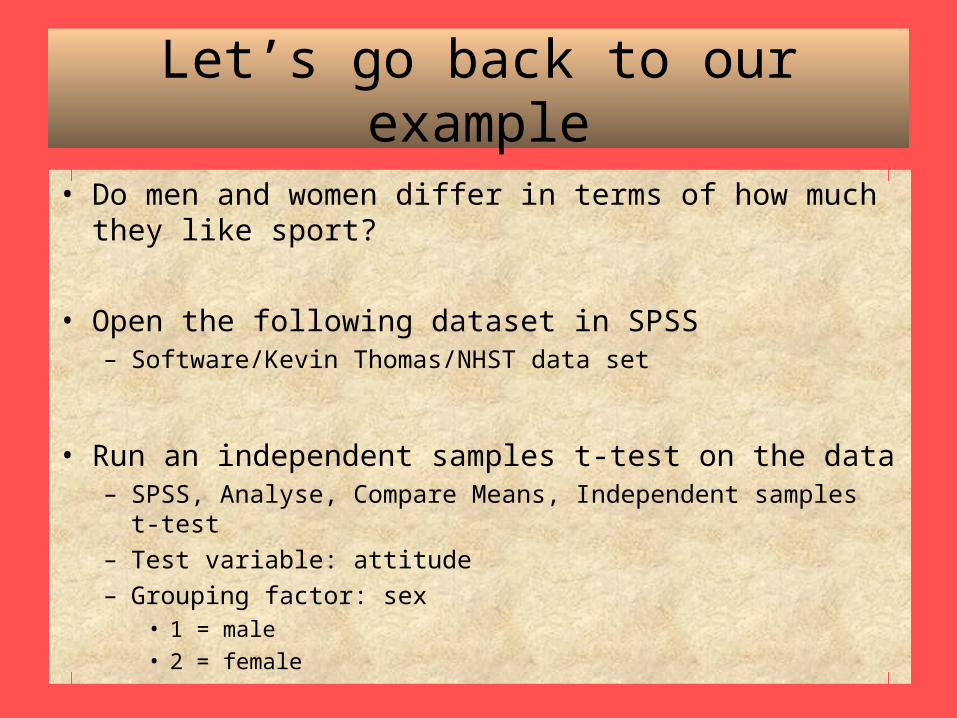
• Do men and women differ in terms of how much they like sport?
• Open the following dataset in SPSS– Software/Kevin Thomas/NHST data set
• Run an independent samples t-test on the data– SPSS, Analyse, Compare Means, Independent samples t-test– Test variable: attitude– Grouping factor: sex
• 1 = male
• 2 = female
20
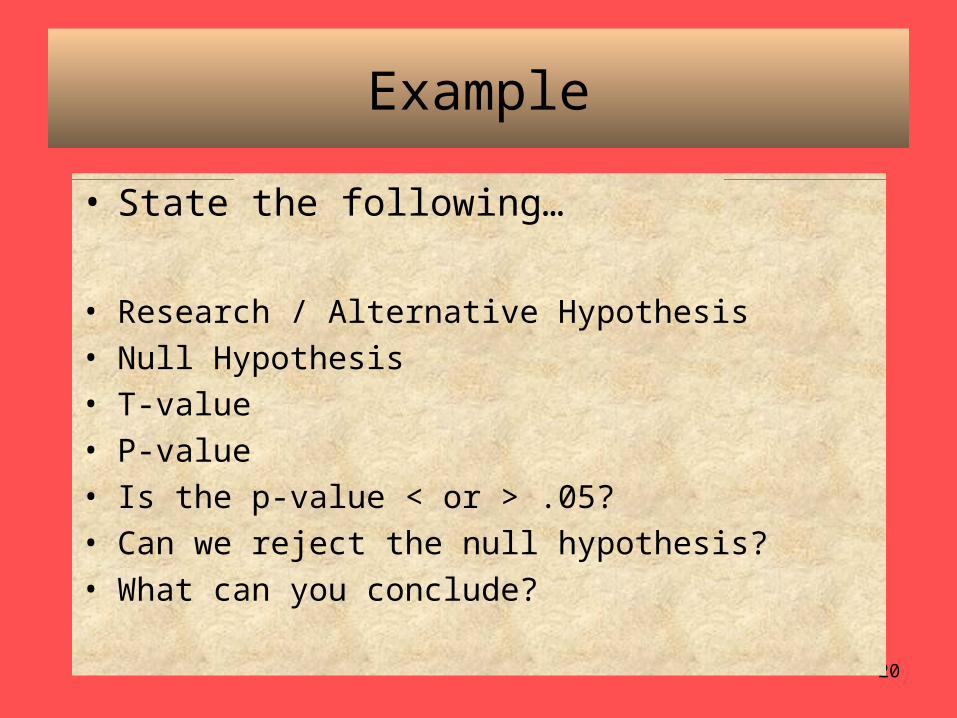
Example
• State the following…
• Research / Alternative Hypothesis • Null Hypothesis• T-value• P-value• Is the p-value < or > .05?• Can we reject the null hypothesis?• What can you conclude?
21
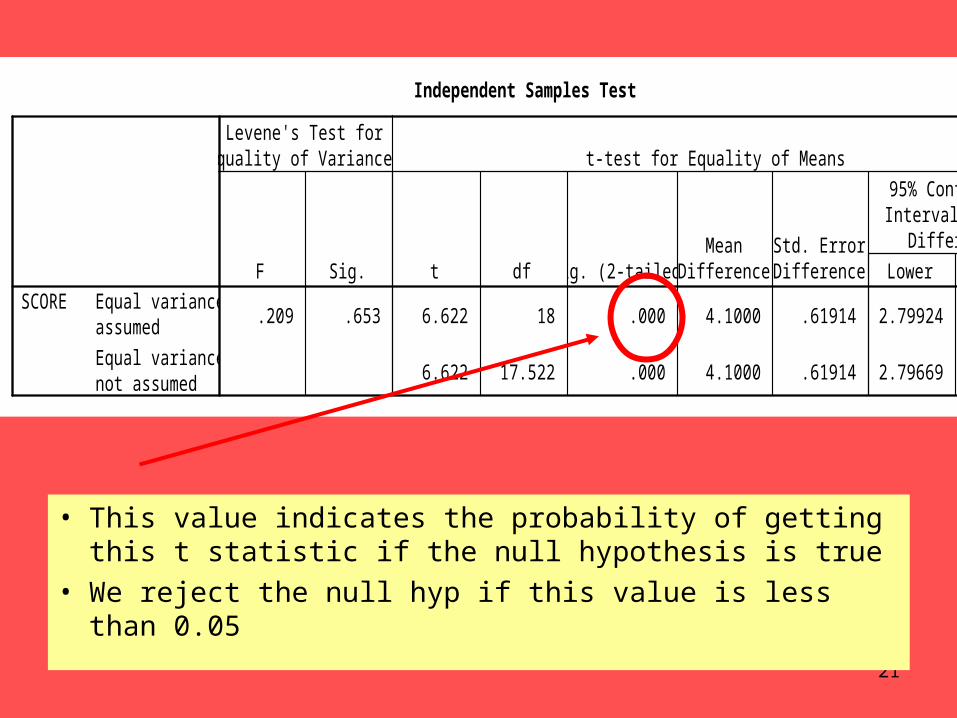
SPSS Analysis
• This value indicates the probability of getting this t statistic if the null hypothesis is true
• We reject the null hyp if this value is less than 0.05
Independent Samples Test
.209 .653 6.622 18 .000 4.1000 .61914 2.79924 5.40076
6.622 17.522 .000 4.1000 .61914 2.79669 5.40331
Equal variancesassumed
Equal variancesnot assumed
SCOREF Sig.
Levene's Test forEquality of Variances
t df Sig. (2-tailed)Mean
DifferenceStd. ErrorDifference Lower Upper
95% ConfidenceInterval of the
Difference
t-test for Equality of Means
22
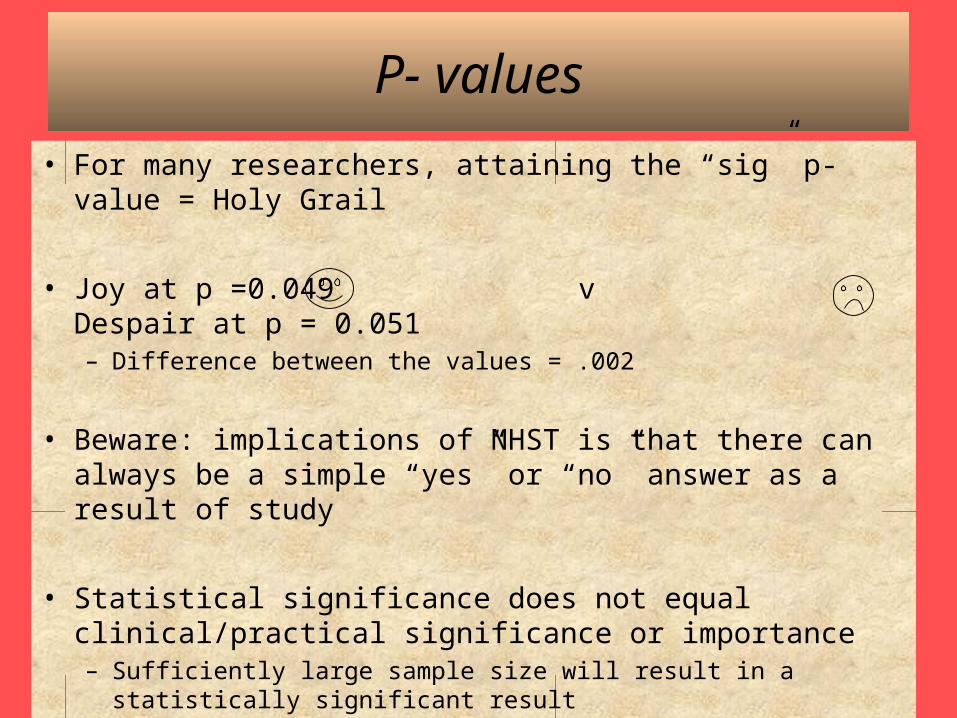
P- values
• For many researchers, attaining the “sig” p-value = Holy Grail
• Joy at p =0.049 v Despair at p = 0.051– Difference between the values = .002
• Beware: implications of NHST is that there can always be a simple “yes” or “no” answer as a result of study
• Statistical significance does not equal clinical/practical significance or importance– Sufficiently large sample size will result in a statistically significant
result
23
Logic of approach?
• Something seems odd about this approach…..– Testing a hypothesis that is opposite to the one you wish to test
• Falsification– Fisher– It is difficult to prove a statement but you can disprove it
• “All dogs have one tail”
• Can’t be sure even after viewing 10,000 dogs with one tail
• But view one dog with two tails…
• Provides a useful starting point for statistical tests
24
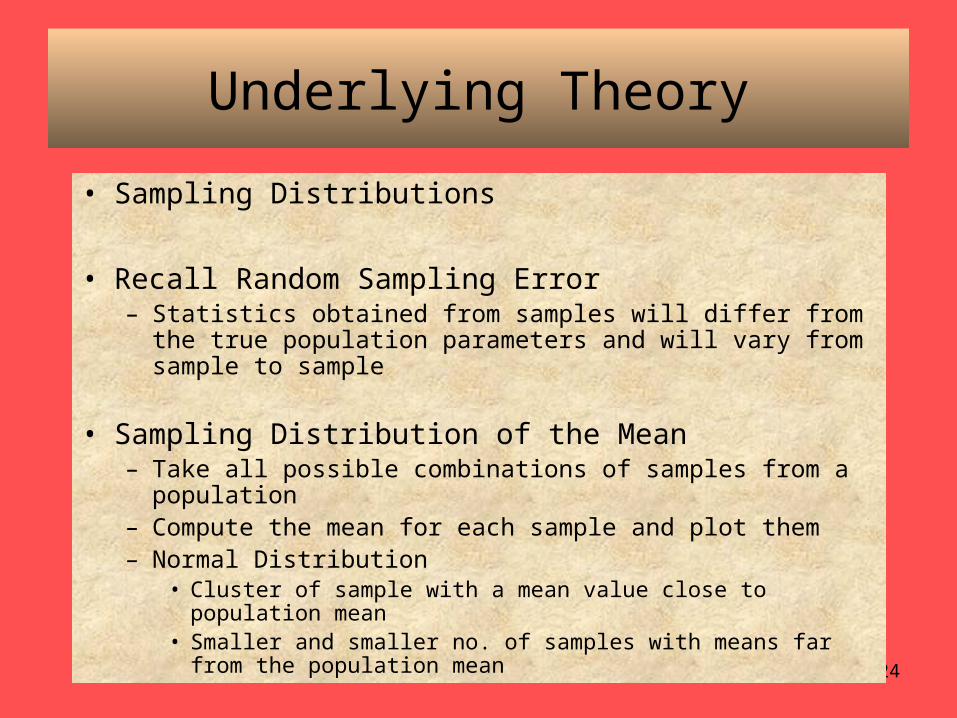
Underlying Theory
• Sampling Distributions
• Recall Random Sampling Error– Statistics obtained from samples will differ from the true
population parameters and will vary from sample to sample
• Sampling Distribution of the Mean– Take all possible combinations of samples from a population– Compute the mean for each sample and plot them– Normal Distribution
• Cluster of sample with a mean value close to population mean• Smaller and smaller no. of samples with means far from the
population mean
25
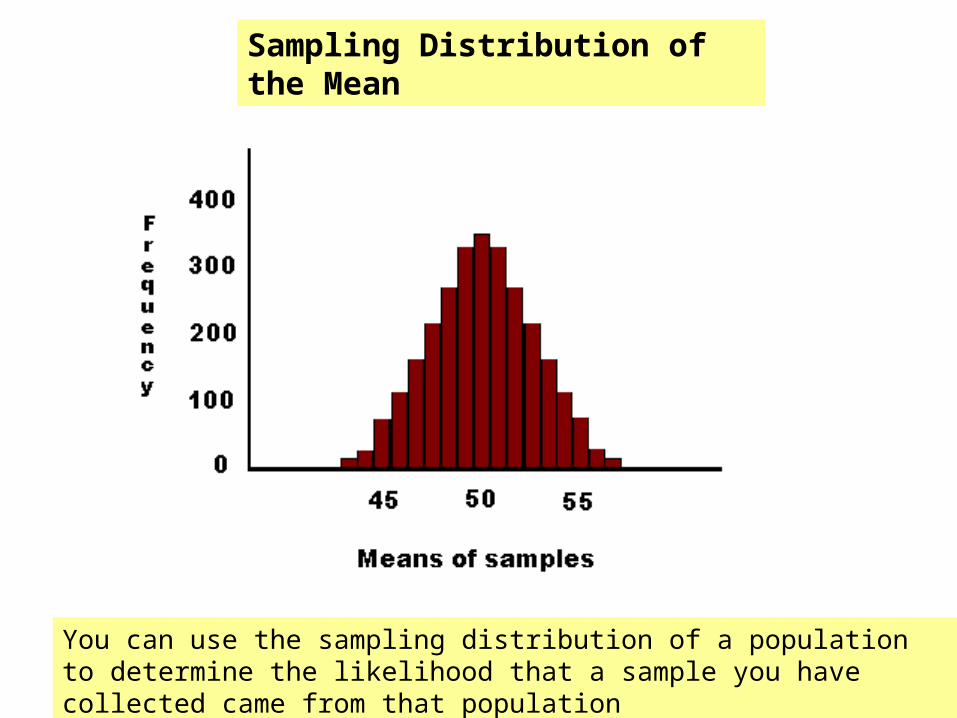
Sampling Distribution of the Mean
You can use the sampling distribution of a population to determine the likelihood that a sample you have collected came from that population
26
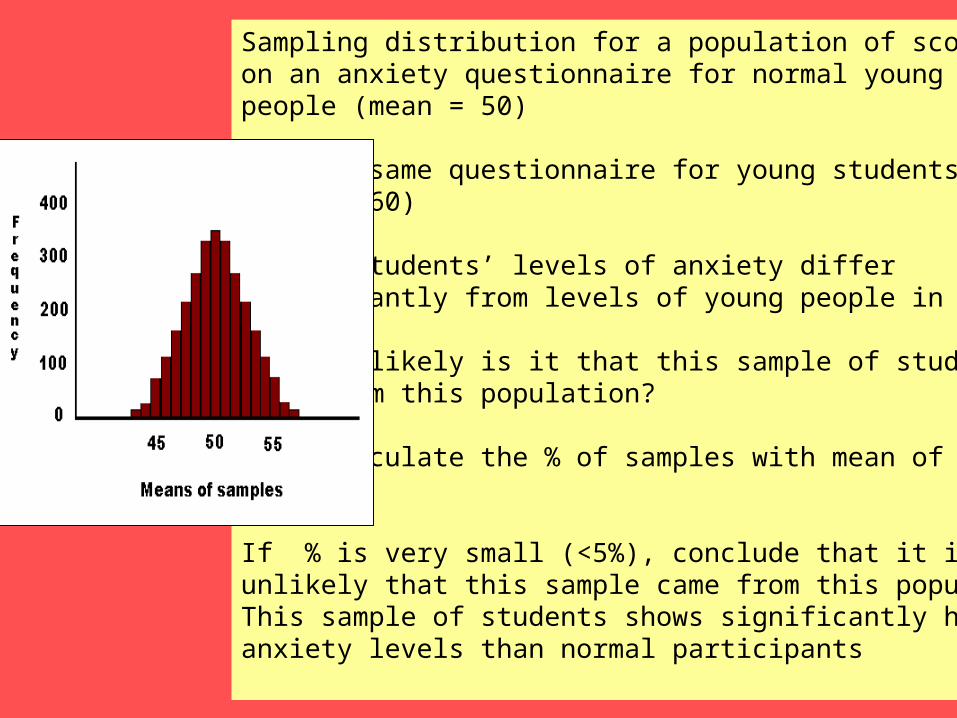
Sampling distribution for a population of scores on an anxiety questionnaire for normal young people (mean = 50)
Data on same questionnaire for young students (mean = 60)
Qu: Do students’ levels of anxiety differ significantly from levels of young people in general?
Qu: How likely is it that this sample of studentscame from this population?
Ans: Calculate the % of samples with mean of 60 or more
If % is very small (<5%), conclude that it is unlikely that this sample came from this population,This sample of students shows significantly higher anxiety levels than normal participants
27
Sampling Distribution of a Test Statistic
• Sample statistics – mean, median, variance, etc.
• Test statistics– Results of statistical procedures– t, F, chi-square, etc.
• All have their own sampling distributions
– Can be used just like the sampling distribution of the mean
28
Let’s take the T Distribution
• Recall earlier T-test– Investigate if there was a statistically significant difference
between two groups
– Calculated t for the two groups• T represented the difference between the two means• (Observed difference / standard error of the difference)
– P-value• Probability of obtaining a t statistic this size if Ho was true
• In the background…– P-value was calculated by comparing our computed t
statistic with the sampling distribution for t when Ho is true
29
T Distribution
• Sampling Distribution for t when Ho is true– Created by taking pairs of samples from one population,
calculating t for each pair and plotting the resulting sampling distribution
• Compare t statistic with sampling distribution– What percentage of samples in the sampling distribution
have a t value as big or bigger than the t statistic we found
• Make your decision– If the % of samples is very small (< 5%), you can conclude
that it is highly unlikely that this t statistic came from a t distribution where Ho is true
– You can reject Ho and say that it is highly unlikely that your two samples came from the same population, their means are significantly different
30
Summary
• Purpose of Inferential Statistics– Making statements about populations based on
samples
• Steps of Null Hypothesis Significance Testing
• Underlying Theory– Sampling distributions