Embed Size (px)
Citation preview

1
Presentation to Standing Committee on Appropriation: 21 October 2009

2
1. STATE OF EXPENDITURE AS AT 30 JUNE 2009

3
NATIONAL STATE OF EXPENDITURE AS AT 30 JUNE 2009
R'000
Budget allocation 13,238,568
Less: Expenditure 2,892,413
Total amount available 10,346,155
Percentage spent 21.85%
Percentage of spending plan 22.62%
4
COMMENTS ON THE NATIONAL STATE OF EXPENDITURE FOR THE FIRST QUARTER PER PROGRAMME AS AT 30
JUNE 2009 • The final overall expenditure of the Department as at 30 June 2009 was at 21.85% against the
spending plan of 22.62% (under-spending).
• The actual spending of 23.17% against the spending plan of 24.31% (under-spending) under
the Programme Administration is mainly due to the low spending of funds allocated for MISP
projects (RDOMS and EDRMS).
• The actual spending of 23.83% against the spending plan of 22.94% (over-spending) under the
Programme Security is mainly due to the payments of overtime made to the correctional
officials in line with the continuous implementation of the PSCBC Resolution number 1 of 2007.
The implementation of 7-Day Establishment with effect from 1 July 2009 will result in the
reduction of the overtime expenditure which used to be paid in line with the 5-Day Work Week
Establishment.

5
COMMENTS ON THE NATIONAL STATE OF EXPENDITURE FOR THE FIRST QUARTER PER PROGRAMME AS AT 30
JUNE 2009 • The actual spending of 22.78% against the spending plan of 24.02% (under-spending) under
the Programme Corrections is mainly due to the low spending of funds allocated for the
purchases of Machinery and equipment due to ITC approval problems and the delay in the
bidding process.
• The actual spending of 19.81% against the spending plan of 23.68% (under-spending) under
the Programme Care is broadly due to the relevant outstanding internal charges transactions to
be cleared to this Programme in line with the request for items and consumption thereof.
• The actual spending of 18.96% against the spending plan of 23.20% (under-spending) under
the Programme Development is mainly due to the low spending of funds allocated for the
purchases of Machinery and equipment due to ITC approval problems and the delay in the
bidding process.

6
COMMENTS ON THE NATIONAL STATE OF EXPENDITURE FOR THE FIRST QUARTER PER PROGRAMME: 30 JUNE
2009 • The actual spending of 23.70% against the spending plan of 21.79% (over-spending) under the
Programme Social Reintegration is mainly due to the payments of overtime made to the
correctional officials in line with the continuous implementation of the PSCBC Resolution
number 1 of 2007. The implementation of 7-Day Establishment with effect from 1 July 2009
will result in the reduction of the overtime expenditure which used to be paid in line with the 5-
Day Work Week Establishment.
• The actual spending of 15.77% against the spending plan of 16.65% (under-spending) under
the Programme Facilities is mainly due to the low spending of funds allocated for capital works
projects due to the low and late billing from the Department of Public Works for capital works
projects completed.

7
COMMENTS ON THE NATIONAL STATE OF EXPENDITURE FOR
THE FIRST QUARTER PER GFS CLASSIFICATION: 30 JUNE 2009
• The actual spending of 23.58% against the spending plan of 23.54% (over-spending) on
Compensation of Employees is mainly due to the payments of overtime made to the
correctional officials in line with the continuous implementation of the PSCBC Resolution
number 1 of 2007. The implementation of 7-Day Establishment with effect from 1 July 2009
will result in the reduction of the overtime expenditure which used to be paid in line with the 5-
Day Work Week Establishment.
• The actual spending of 21.34% against the spending plan of 23.39% (under-spending) on
Goods and Services is mainly due to the low spending of funds allocated for MISP projects.
• The actual spending of 22.89% against the spending plan of 22.13% (over-spending) on
Transfers and Subsidies is mainly due to the payments made for the leave and inmates
gratuities under the item households.
• The actual spending of 12.14% against the spending plan of 14.57% (under-spending) on
Payments for Capital Assets is mainly due to the low spending of funds allocated for capital
works projects due to the low billing from the Department of Public Works for capital works
projects completed.
8
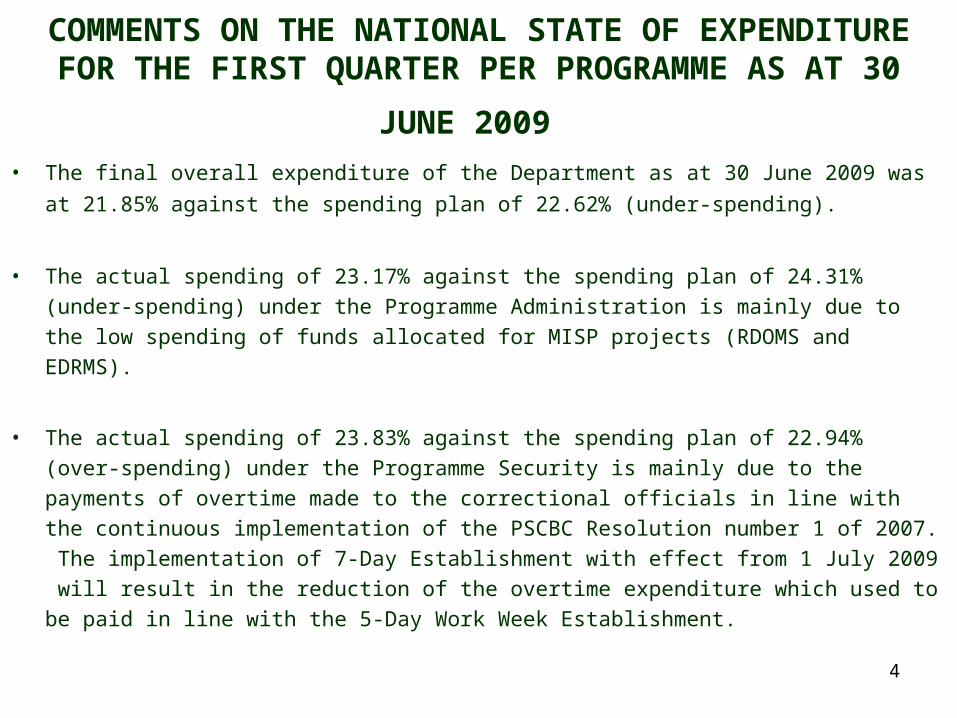
CHALLENGES ON THE BUDGET ALLOCATION FOR 2009/10
FINANCIAL YEAR • The GPSSBC Resolution number 2 of 2009 was signed on the 24 June 2009 which makes provision for the
implementation of OSD for correctional officials.
• Phase one of the OSD consists of the implementation of once off back payments to compensate officials for
the delay on the OSD implementation effective from the 1 July 2008 to 30 June 2009 (12 months) and the
introduction of salary increase adjustment for non-centre and centre based officials.
• Phase two of the OSD consists of the implementation of remuneration to be paid to the correctional officials
based on the recognition of their experience with effect from the 01 April 2010.
• Having noted the OSD obligations against the insufficient budget allocation, the Department is nonetheless
obliged to carry on with the implementation of the OSD in terms of the signed GPSSBC Resolution number 2
of 2009.

9
STATE OF EXPENDITURE PER PROGRAMME FOR THE FIRST QUARTER: 30 JUNE 2009
Programme Budget R'000 Exp to date R'000 % Spent Budget avail R'000Administration 3,478,050 806,022 23.17% 2,672,028Security 4,425,262 1,054,681 23.83% 3,370,581Corrections 1,112,080 253,301 22.78% 858,779Care 1,591,750 315,251 19.81% 1,276,499Development 448,683 85,078 18.96% 363,605Social reintergration 425,911 100,954 23.70% 324,957Facilities 1,756,832 277,126 15.77% 1,479,706Total 13,238,568 2,892,413 21.85% 10,346,155

10
STATE OF EXPENDITURE PER PROGRAMME FOR THE FIRST QUARTER: 30 JUNE 2009
0
2,000,000
4,000,000
6,000,000
8,000,000
10,000,000
12,000,000
14,000,000
Administration Security Corrections Care Development Socialreintergration
Facilities Total
Budget R'000
Exp to date R'000

11
STATE OF EXPENDITURE PER GFS CLASSIFICATION FOR THE FIRST QUARTER: 30 JUNE 2009
GFS Classification Budget R'000Exp to date
R'000% Spent Budg avail R'000
Compensation of Employees 8,292,350 1,955,243 23.58% 6,337,107Goods & Services 3,608,831 769,969 21.34% 2,838,862Thefts and losses 0 720 0.00% -720Interst & Rent on land 57 0 0.00% 57Transfers & Subsidies 37,844 8,662 22.89% 29,182
Payment of Capital Assets 1,299,486 157,819 12.14% 1,141,667Total 13,238,568 2,892,413 21.85% 10,346,155

12
STATE OF EXPENDITURE PER GFS CLASSIFICATION FOR THE FIRST QUARTER: 30 JUNE 2009
0
2,000,000
4,000,000
6,000,000
8,000,000
10,000,000
12,000,000
14,000,000
Compensation ofEmployees
Goods &Services
Interst & Rent onland
Transfers &Subsidies
Payment ofCapital Assets
Total
Budget R'000
Exp to date R'000

13
NATIONAL PROJECTED EXPENDITURE PER PROGRAMME FOR THE YEAR: 2009/10 FINANCIAL YEAR
Programme Budget R'000Exp to date
June 09: R'000
Proj. exp July 09 to March 10
R'000
Projected expenditure
%Shortfall R'000
Administration 3,478,050 806,022 2,672,028 100.00% 0Security 4,425,262 1,054,681 3,370,581 100.00% 0Corrections 1,112,080 253,301 858,779 100.00% 0Care 1,591,750 315,251 1,276,499 100.00% 0Development 448,683 85,078 363,605 100.00% 0
Social reintergration 425,911 100,954 324,957 100.00% 0Facilities 1,756,832 277,126 1,479,706 100.00% 0Total 13,238,568 2,892,413 10,346,155 100.00% 0

14
NATIONAL PROJECTED EXPENDITURE PER GFS CLASSIFICATION FOR THE YEAR: 2009/10 FINANCIAL
YEAR
GFS Classification Budget R'000Exp to date
June 09: R'000
Proj. exp July 09 to March 10
R'000
Projected expenditure
%Shortfall R'000
Compensation of Employees 8,292,350 1,955,243 6,337,107 100.00% 0Goods & Services 3,608,831 769,969 2,838,862 100.00% 0Interst & Rent on land 57 0 57 100.00% 0Transfers & Subsidies 37,844 8,662 29,182 100.00% 0
Payment for Capital Assets 1,299,486 157,819 1,141,667 100.00% 0Total 13,238,568 2,892,413 10,346,155 100.00% 0

15
Together doing more to break the cycle of crime
![Amazon Web Servicespmg-assets.s3-website-eu-west-1.amazonaws.com/18052… · Web viewreport of the standing committee on appropriations on the appropriation bill [b3-2018] (national](https://img.pdfslide.net/doc/110x75/5f1b6d9161341d744e59af1f/amazon-web-servicespmg-assetss3-website-eu-west-1-web-view-report-of-the-standing.jpg)