Embed Size (px)
Citation preview
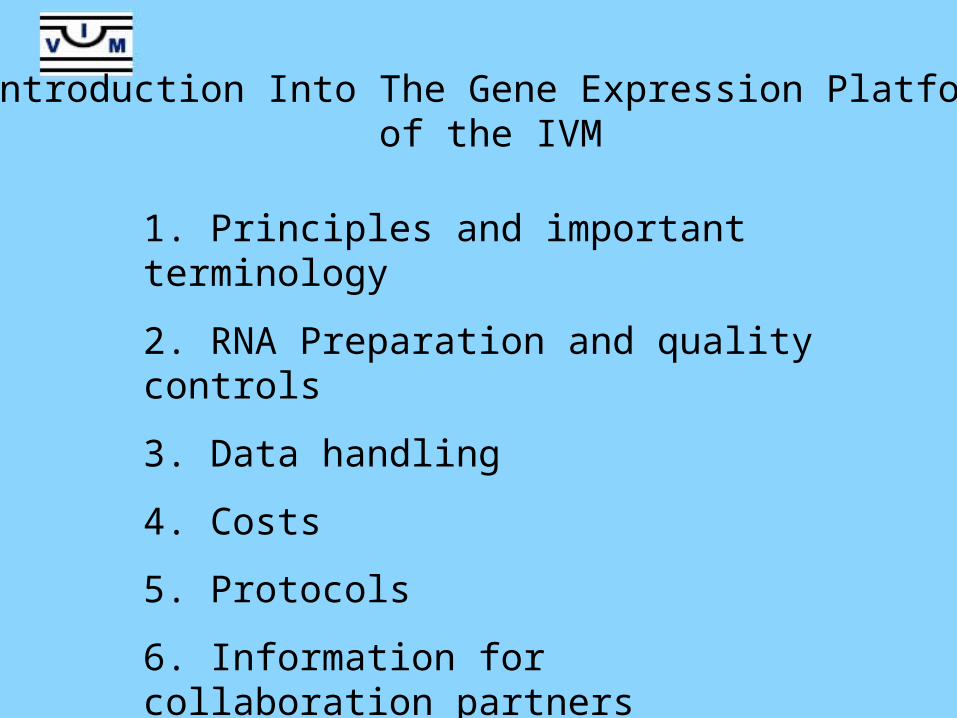
1. Principles and important terminology
2. RNA Preparation and quality controls
3. Data handling
4. Costs
5. Protocols
6. Information for collaboration partners
7. Downloads
Introduction Into The Gene Expression Platform of the IVM
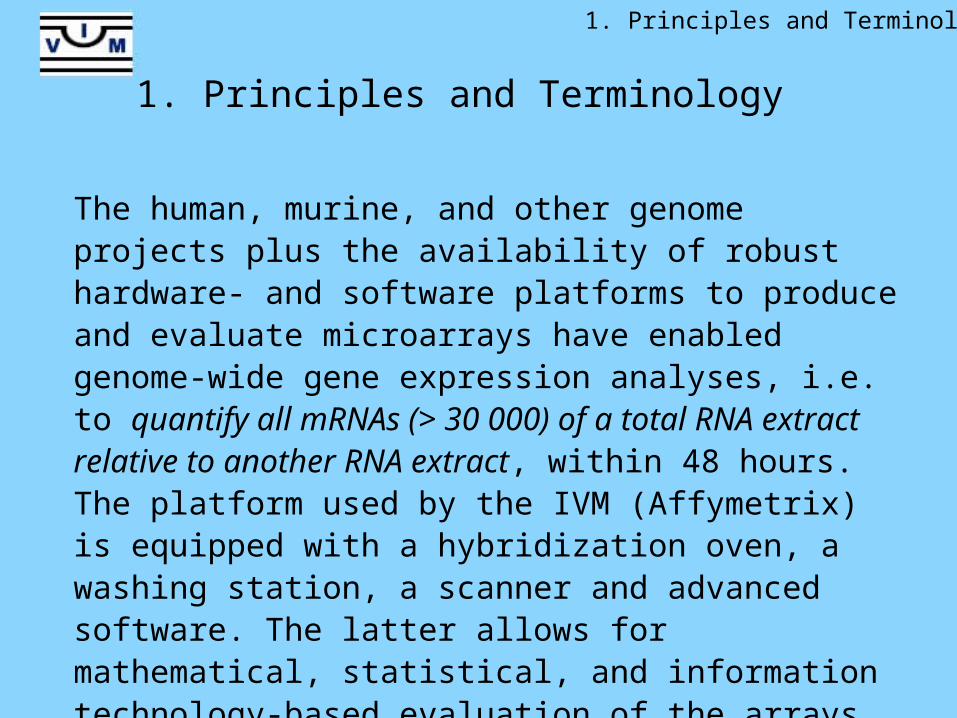
1. Principles and Terminology
The human, murine, and other genome projects plus the availability of robust hardware- and software platforms to produce and evaluate microarrays have enabled genome-wide gene expression analyses, i.e. to quantify all mRNAs (> 30 000) of a total RNA extract relative to another RNA extract, within 48 hours. The platform used by the IVM (Affymetrix) is equipped with a hybridization oven, a washing station, a scanner and advanced software. The latter allows for mathematical, statistical, and information technology-based evaluation of the arrays.
1. Principles and Terminology
Affymetrix produces expressionsarrays of several species (human, mouse, C. elegans and others; test the link !).
These are available in different formats.
Dependent on format and protocol 0,5 - 5 µg total RNA is required per array.
1. Principles and Terminology
Available: Whole Genome Arrays of Several Species
1. Principles and Terminology
Through Photolithography 25mer socalled „Perfect Match“ (PM) oligonucleotides (ON) whose sequences are derived from the genome projects are synthesized on a glass slide. To subtract unspecific hybridizations a „Miss Match“ (MM) ON is also synthesized, that differs from the PM ON by a single nucleotide exchange at position 13. This results in PM – MM ON pairs, i.e. „probe pairs“. Signals of MM ONs are subtracted from the corresponding PM ON thereby enhancing sensitivity and specificity of each PM ON. Each mRNA sequence represented by a „Probe Set“ consists of 11 probe pairs. This allows for statistical analyses and thus quality assessment of each measurement.
Production of Arrays
1. Principles and Terminology
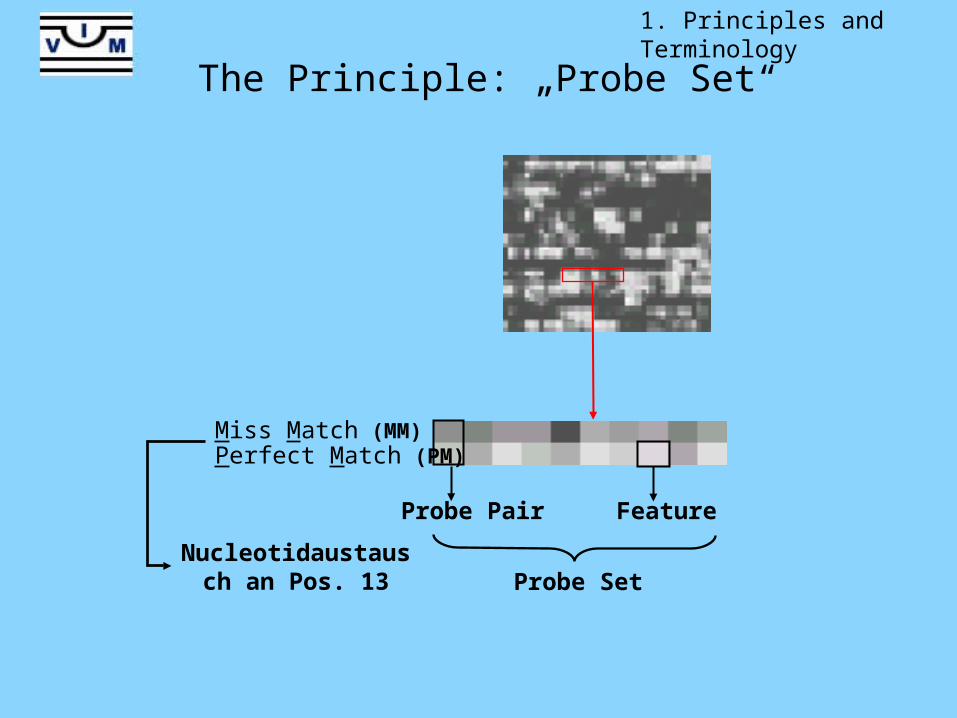
Probe Set
Probe Pair Feature
Miss Match (MM)Perfect Match (PM)
Nucleotidaustausch an Pos. 13
The Principle: „Probe Set“
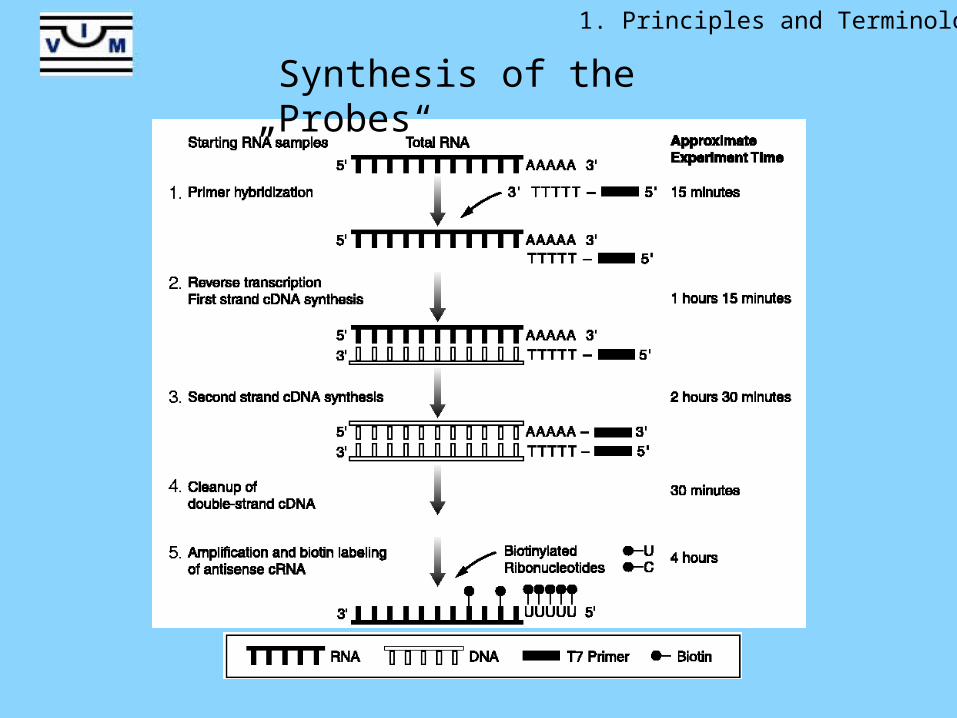
Synthesis of the „Probes“
1. Principles and Terminology
Fluidics Station
1. Principles and Terminology
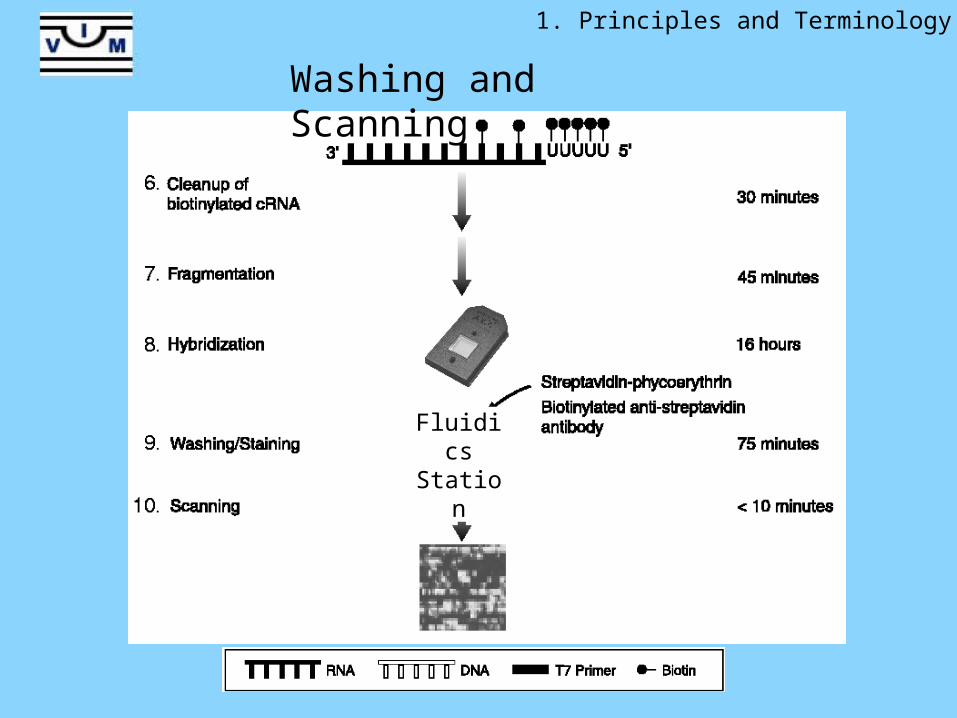
Washing and Scanning
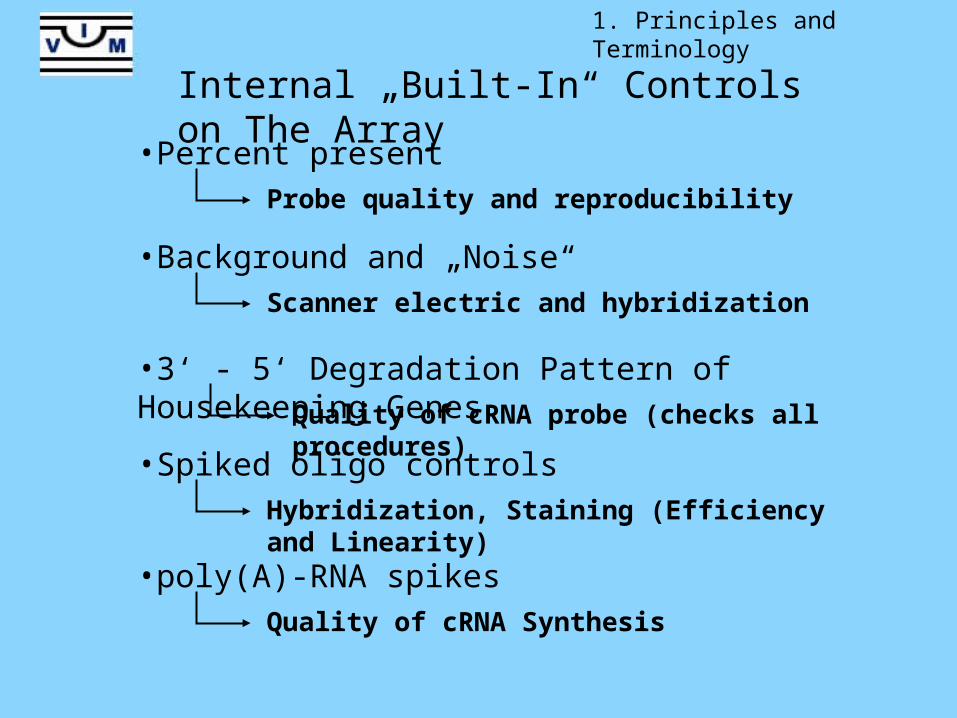
Internal „Built-In“ Controls on The Array
•Background and „Noise“Scanner electric and hybridization
•Percent presentProbe quality and reproducibility
•Spiked oligo controlsHybridization, Staining (Efficiency and Linearity)
•3‘ - 5‘ Degradation Pattern of Housekeeping GenesQuality of cRNA probe (checks all procedures)
•poly(A)-RNA spikesQuality of cRNA Synthesis
1. Principles and Terminology
2. RNA Preparation and Quality Control
A high quality RNA preparation is critical to generate an array of high quality. Degradation and contamination need to be avoided.
We recommend the Qiagen RNeasy Lipid Tissue Mini Kit.
In addition, sample preps, storage conditions, and homogenization prior to RNA extraction are important.
Protocols need to be worked out for each sample (cultured cell, tissue, type of organ).
2. RNA Preparation and Quality Controls
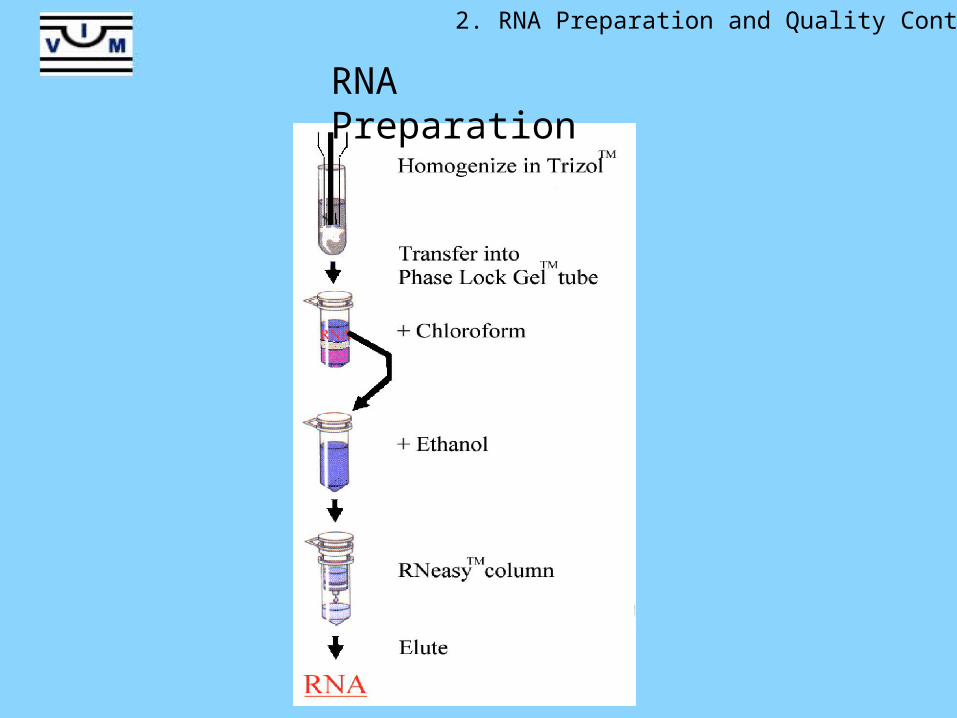
RNA Preparation
Agilent Lab on a Chip
18
S
28
S
Fluo
resc
ence
Time (seconds)
0
5
10
15
20
25
30
19 24 29 34 39 44 49 54 59
18
S
28
S
Fluo
resc
ence
Time (seconds)
0.0
2.5
5.0
7.5
10.0
12.5
15.0
17.5
19 24 29 34 39 44 49 54 59
18
S
28
S
Fluo
resc
ence
Time (seconds)
0.0
2.5
5.0
7.5
10.0
12.5
19 24 29 34 39 44 49 54 59
Fluo
resc
ence
Time (seconds)
0.0
0.5
1.0
1.5
2.0
2.5
3.0
3.5
4.0
19 24 29 34 39 44 49 54 59
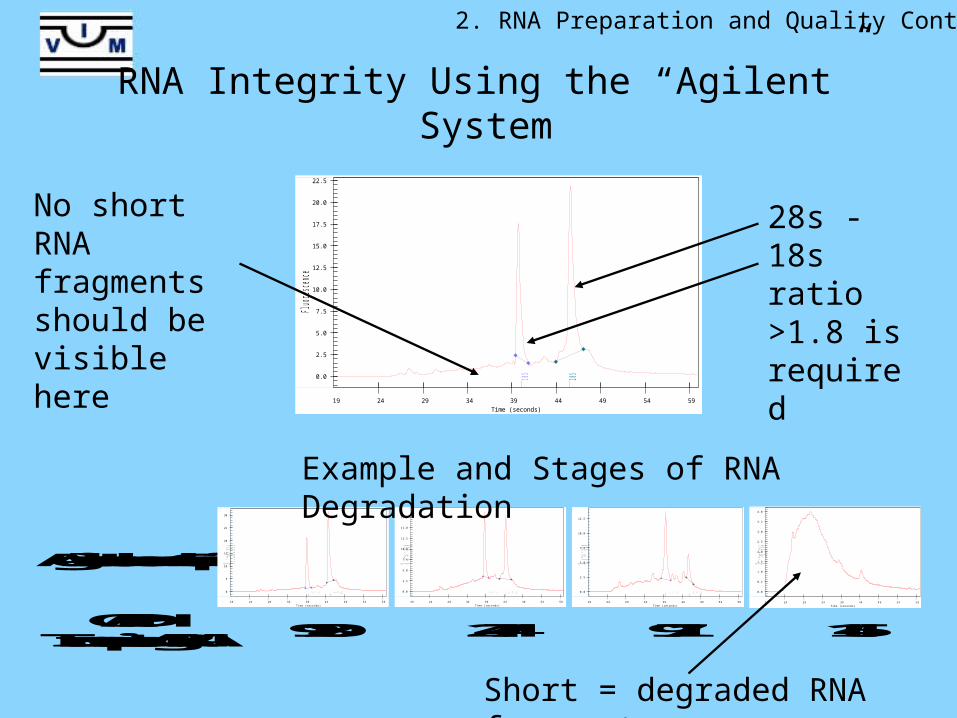
GAPDHTranscripts / ng RNA
9180 2474 971 145
Example and Stages of RNA Degradation
18S
28S
Fluo
resc
ence
Time (seconds)
0.0
2.5
5.0
7.5
10.0
12.5
15.0
17.5
20.0
22.5
19 24 29 34 39 44 49 54 59
RNA Integrity Using the “Agilent” System
28s - 18s ratio >1.8 is required
2. RNA Preparation and Quality Controls
No short RNA fragments should be visible here
Short = degraded RNA fragments
3. Data Evaluation
There are numerous approaches. Which one to choose depends on the questions asked in the experiment.
Data evaluation is principally done in three steps:
Raw data screening including „report“ on quality parameters.
Statistical evaluation and application of „filters“.
Annotation of genes and functional evaluation.
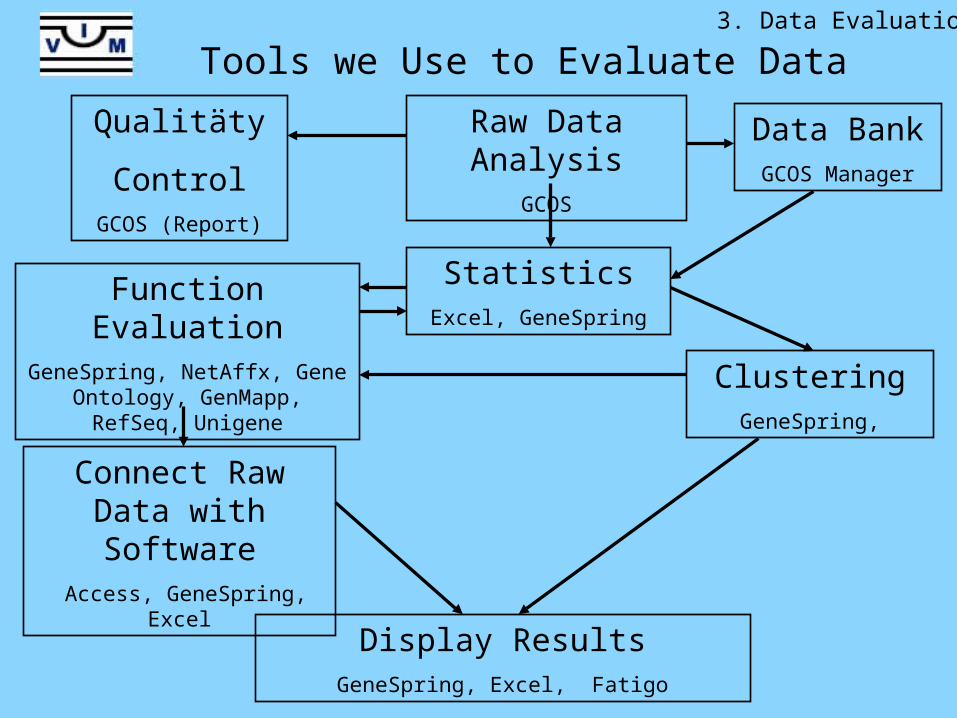
Raw Data AnalysisGCOS
StatisticsExcel, GeneSpring
Function EvaluationGeneSpring, NetAffx, Gene
Ontology, GenMapp, RefSeq, Unigene Clustering
GeneSpring,
Connect Raw Data with Software
Access, GeneSpring, Excel
Display ResultsGeneSpring, Excel, Fatigo
Qualitäty
ControlGCOS (Report)
Data BankGCOS Manager
3. Data Evaluation
Tools we Use to Evaluate Data
3. Data Evaluation
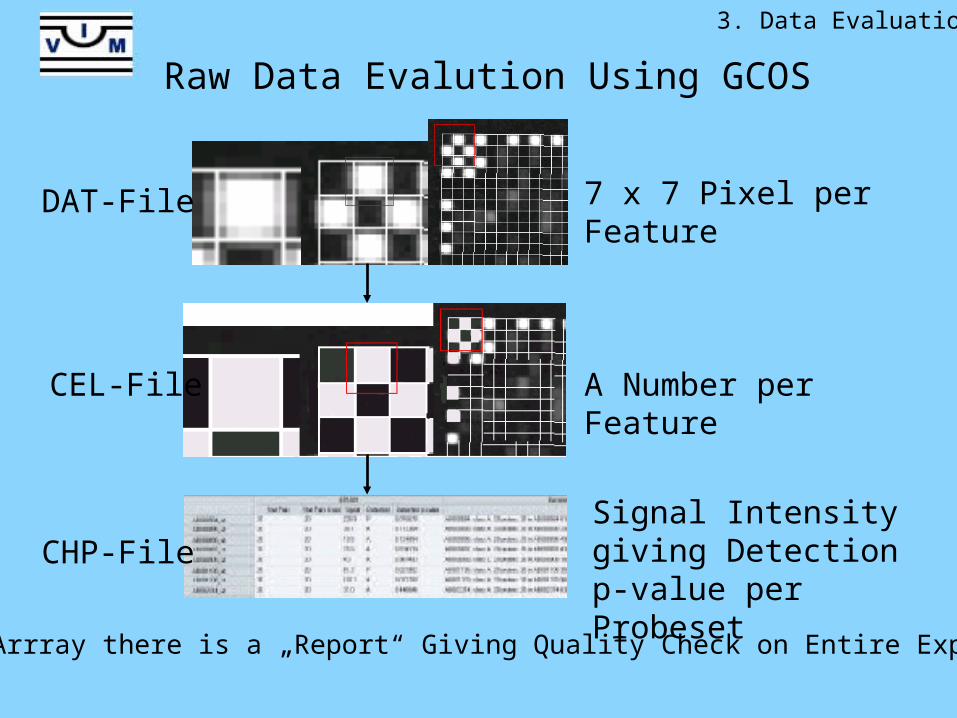
Raw Data Evalution Using GCOS
DAT-File
CEL-File
7 x 7 Pixel per Feature
A Number per Feature
Signal Intensity giving Detection p-value per Probeset
CHP-File
For Each Arrray there is a „Report“ Giving Quality Check on Entire Experiment
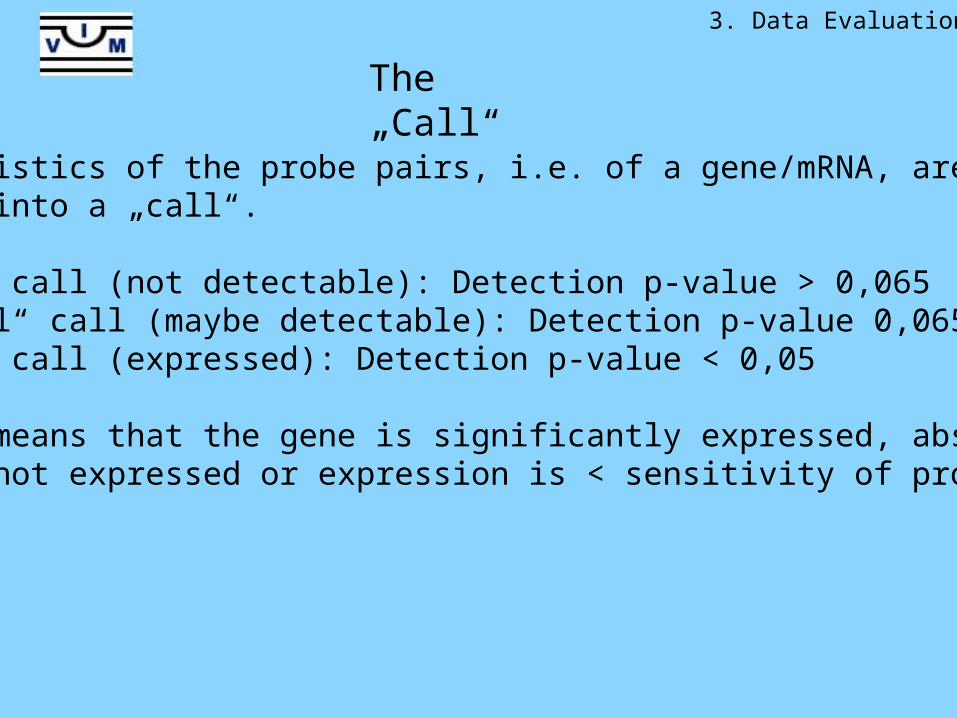
The „Call“
3. Data Evaluation
The statistics of the probe pairs, i.e. of a gene/mRNA, are converted by GCOS into a „call“.
„Absent“ call (not detectable): Detection p-value > 0,065 „Marginal“ call (maybe detectable): Detection p-value 0,065 - 0,05„Present call (expressed): Detection p-value < 0,05
Present means that the gene is significantly expressed, absent means gene is not expressed or expression is < sensitivity of probeset.
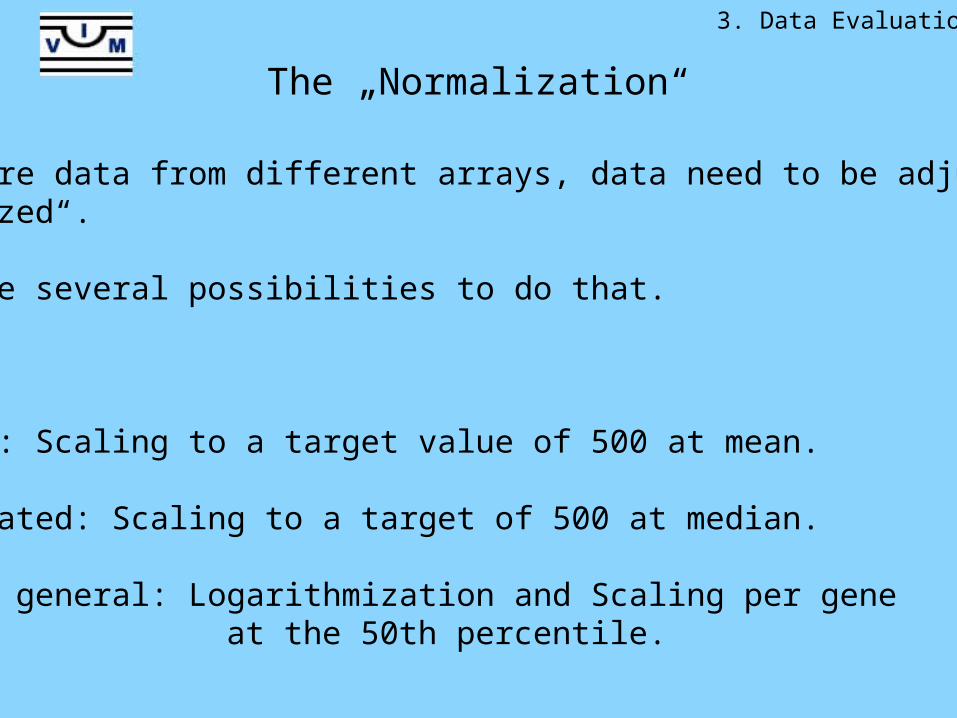
The „Normalization“
To compare data from different arrays, data need to be adjusted or „normalized“.
There are several possibilities to do that.
We use:
Standard: Scaling to a target value of 500 at mean.
If saturated: Scaling to a target of 500 at median.
Tests in general: Logarithmization and Scaling per gene at the 50th percentile.
3. Data Evaluation
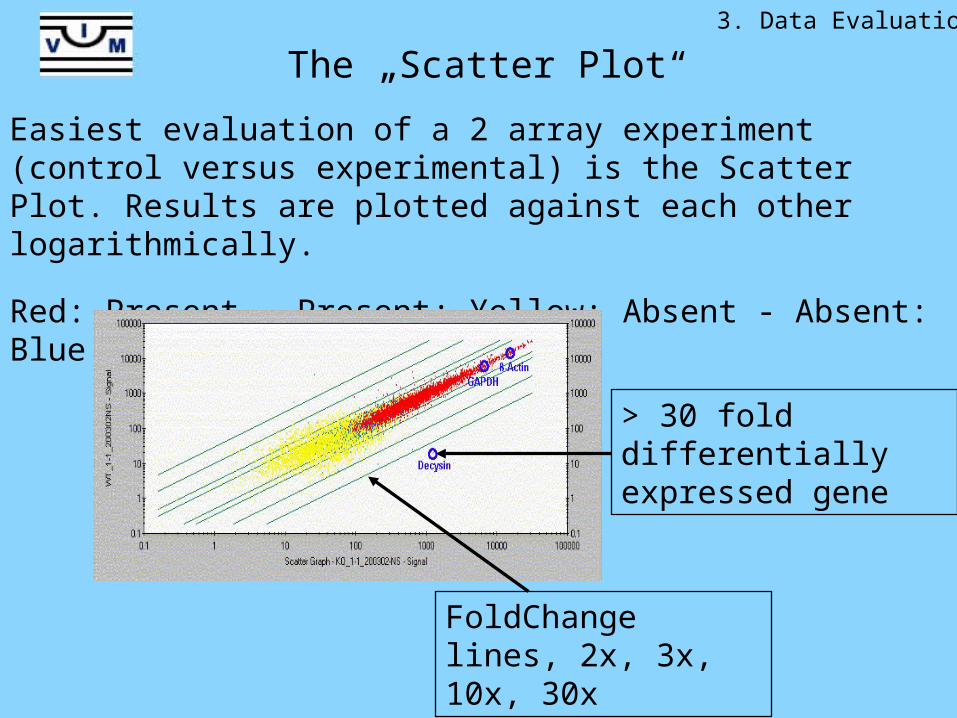
The „Scatter Plot“
Easiest evaluation of a 2 array experiment (control versus experimental) is the Scatter Plot. Results are plotted against each other logarithmically.
Red: Present - Present; Yellow: Absent - Absent: Blue: Absent - Present
FoldChange lines, 2x, 3x, 10x, 30x
> 30 fold differentially expressed gene
3. Data Evaluation
Statistics and Filters
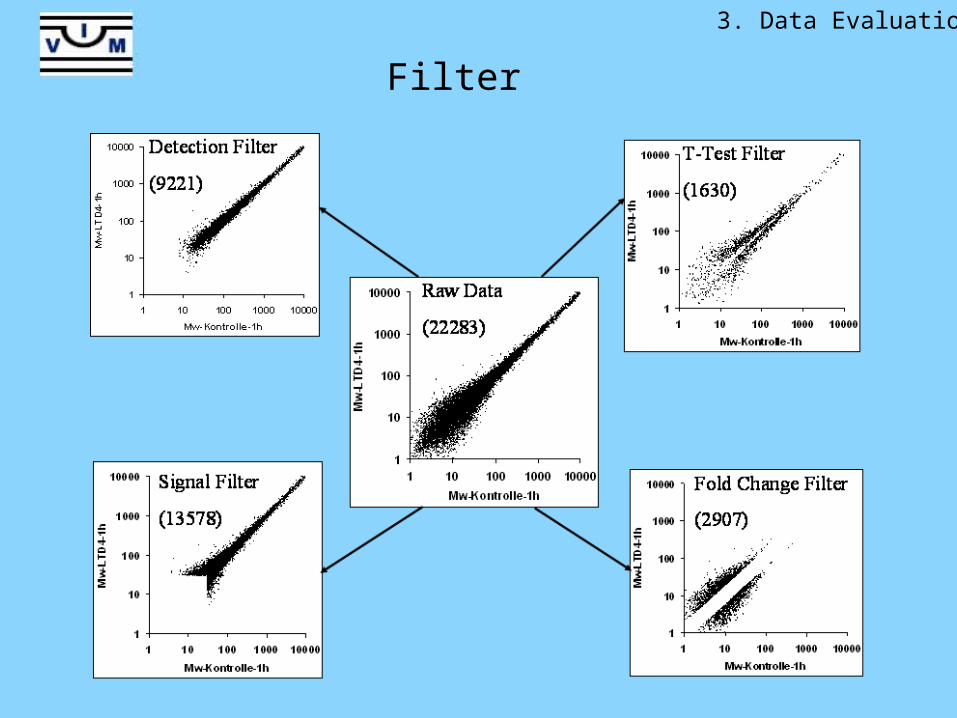
To perform statistics 3 repeated measurements are needed. This yields a p value. Filters then reduce the amount of data.
.
Filter: 1. Signal intensity value 2. Detection p-Wert 3. Fold Change 4. p-Wert of experiment
.
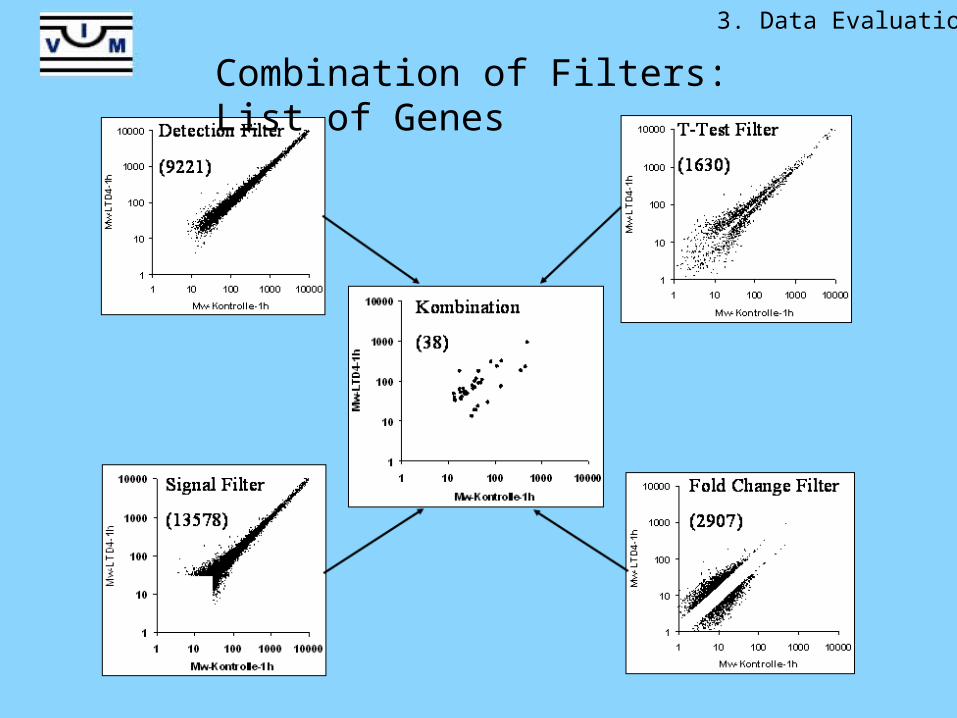
This results in a list of candidate genes that are - most likely - differentially expressed.
The stringency of 1. to 4. determines the quality of the candidate list.
3. Data Evaluation
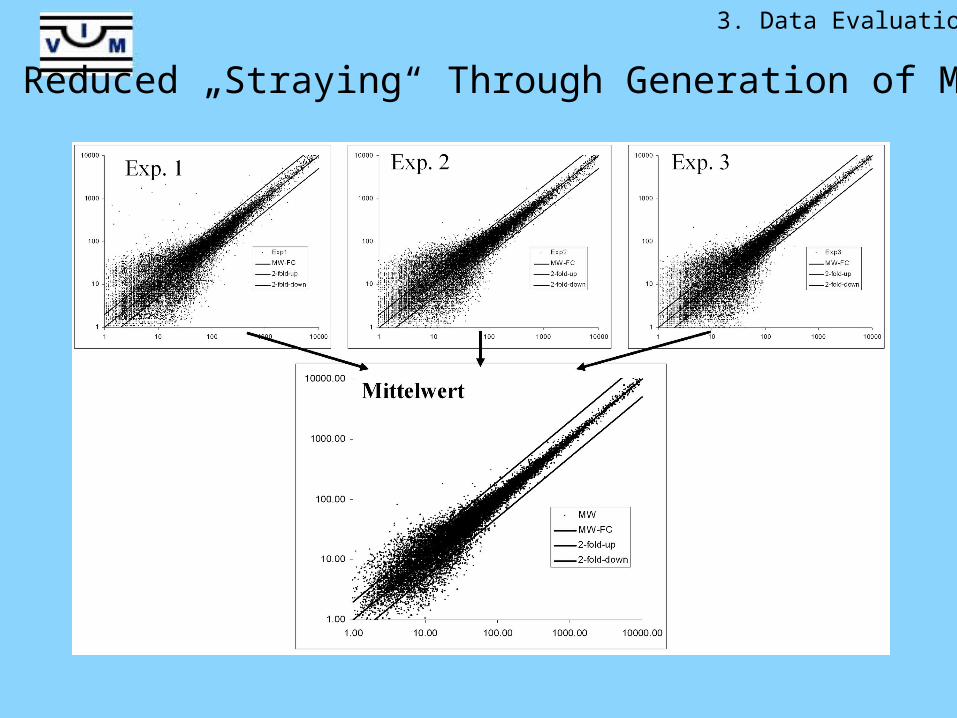
Reduced „Straying“ Through Generation of Means
3. Data Evaluation
3. Data Evaluation
Filter
3. Data Evaluation
Combination of Filters: List of Genes
The „Annotation“
List of Affymetrix Numbersvia Access, GeneSpring, NetAffx
Relate to Data Bank Terminology- Pubmed- UniGene- LocusLink / Entrez Gene- OMIM- Ensembl- ...
Problem: The investigator gets a list of genes that he doesn´t know:
Needed: Rapid procedure to identify the genes. Generate data banks and structure your gene lists. Test the links below !
3. Data Evaluation
4. Cost
The cost per array: 800.- € bis 1250.- €.
Depending on:
Array type and reagent/work load/experiment.
6. Information for collaborating partners
Contact per mail:
Discussion and advice
Sample transfer with „filled-in“ form (available at IVM)
Generation of Microarrays
Transfer of raw data files and Excel files
(Software tools available at IVM)

7. Downloads
•Contract
•Excel scheme for evaluating data
•Manual for Excel scheme
•Sheet „Project form“