Embed Size (px)
Citation preview

1
Profitability AnalysisAn Extended Look
Dr. Nancy Mangold
California State University, East Bay
2
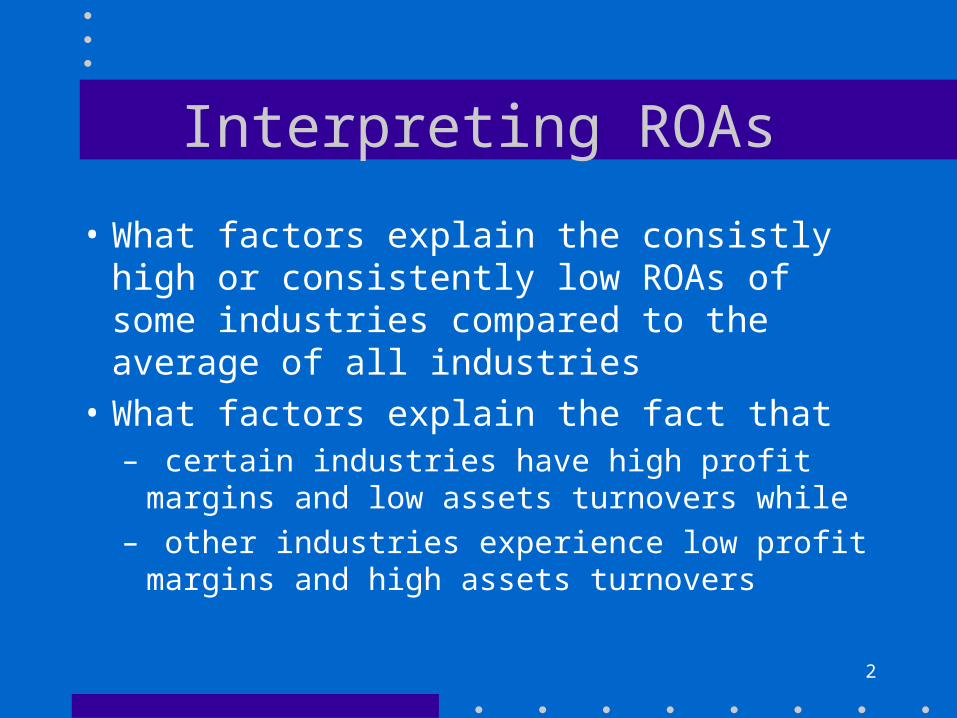
Interpreting ROAs
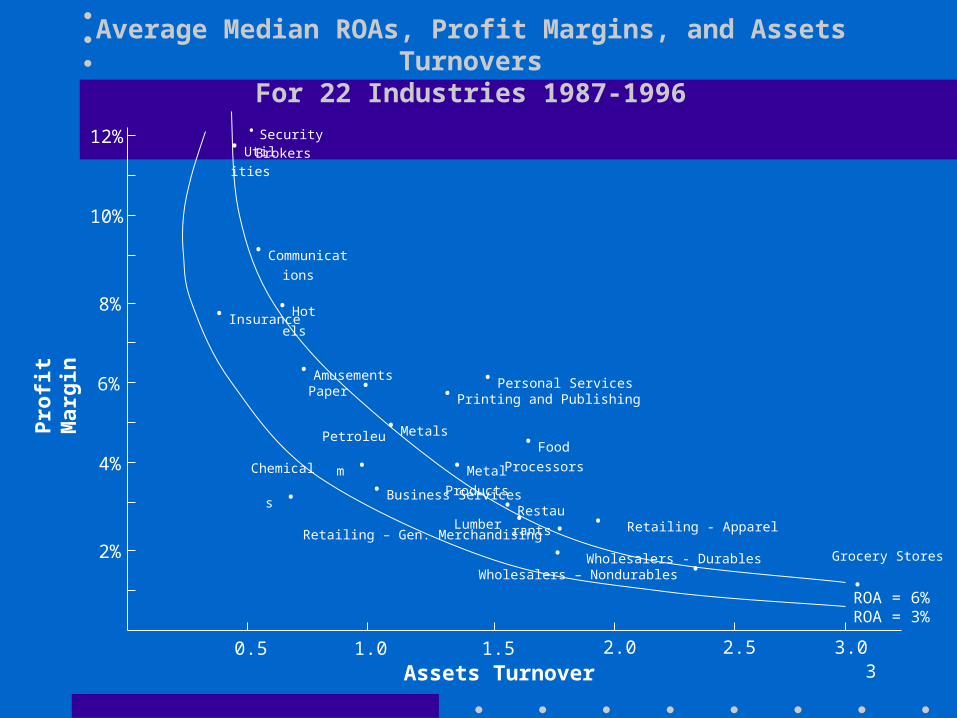
• What factors explain the consistly high or consistently low ROAs of some industries compared to the average of all industries
• What factors explain the fact that– certain industries have high profit margins and
low assets turnovers while– other industries experience low profit margins
and high assets turnovers
3
Pro
fit
Mar
gin
Assets Turnover
12%
6%
2%
4%
8%
10%
3.02.52.01.51.00.5
·Security Brokers·Utilitie
s
·Communication
s
·Insurance·Hotel
s
·AmusementsPaper · ·Personal Services·Printing and Publishing
·Metals ·Food
Processors
Petroleum
· ·Metal
Products
Chemicals
· ·Business Services·Restaurant
sLumber · · Retailing - ApparelRetailing – Gen. Merchandising ·
· Wholesalers - DurablesWholesalers – Nondurables ·
Grocery Stores
·ROA = 6%ROA = 3%
Average Median ROAs, Profit Margins, and Assets TurnoversFor 22 Industries 1987-1996
4
Operating Leverage
• Firms operate with different mixtures of fixed and variable costs in their cost structures
5
Operating Leverage
• Firms with high proportions of fixed costs
• High operating leverage firms
• Capital intensive industries– Utilities– Communications– Hotels– Petroleum– Chemical
6
Operating Leverage
• Firms with high proportions of variable costs
• Low operating leverage firms]
• Less capital intensive industries– Retailers– Wholesalers
7
Operating Leverage
• Firms with high proportions of fixed costs
• Significant increase in NI as sales increase– Fixed costs spread over a larger number of
units sold– average unit cost decreased
• Sharp decreases in NI when sales decrease
8
Operating Leverage
• High level of operating leverage
• Greater risk in their operations
• Should earn higher rates of return
9
Operating Leverage
• Unfortunately firms do not publicly disclose information about their fixed and variable cost structures
• One approach is to study the various cost items of a firm and attempt to identify the items that are likely to behave as fixed costs
10
Committed Fixed Costs
• Fixed costs committed regardless of actual level of activity during a period– Depreciation– Amortization– Rent – Lease payments
11
Discretionary Fixed Costs
• Firms can alter the amount of some other costs in the short run in response to operating conditions– R & D expenses– Maintenance– Advertising– Central corporate staff expenses
• Classify as FC or VC depending on behavior in a particular firm
12
Cost Structure
• Exhibit 8.3
• Kelley Services (.8%, 99.2%)
• Coke (3.2%, 96.8%)
• USX (US Steel) (4.6%, 95.4%)
• Consolidated Edison (18.3%, 81.7%)
13
Cyclicality of Sales
• The sales of certain goods and services are sensitive to conditions in the economy– Construction services– Industrial equipment– Computers– Automobiles– Other durable goods
14
Cyclicality of Sales
• When the economy is in an upswing– Healthy GNP growth– low unemployment– Low interest rate
• Customers purchase high-priced items
• Sales of these firms grow
15
Cyclicality of Sales
• When the economy enters a recession
• Customers curtail their purchases
• The sales of these firms drop significantly
16
Noncyclical Sales
• Industries sell products that most consumers consider necessities– Grocery stores– Food processors– non-fashion clothing producers– electric utilities
• Products have lower per unit costs
17
Cyclicality of Sales
• Firms with cyclical sales patterns incur more risk
• Firms with non-cyclical sales patterns incur less risk
18
Cyclicality of Sales
• A firm can reduce its risk by
• Incorporate high proportion of variable cost in its cost structure– Pay employee hourly wage vs fixed salary– Rent building and equipment under short-term
cancelable leases instead of purchasing facilities
• Airlines, railroads
19
Cyclicality of Sales
• A noncyclical sales pattern can compensate for high operating leverage and neutralize risk
• Electric utilities
• Telecommunication firms
20
Product Life Cycle
• Product life cycle– Introduction– Growth– Maturity– Decline
21
Introduction & Growth
• Product development– High R & D spending
• Capacity enlargement– Capacity spending
• high uncertainty regarding the market viability of a firm’s products
22
Maturity Phase
• Firms have gained market acceptance– Reduce capital expenditures on operating
capacity
• More intense competition-reducing costs through– improved capacity utilization (economies of
scale)– more efficient production
23
Decline Phase
• Firms exit the industry as sales decline and profit diminish
24
Product Life Cycle & ROA
• Introduction & early growth phase
• Negative ROAs– high expenditures on product development,
marketing, capital expenditure– Low sales– operating losses
• Higher risk
25
Product Life Cycle & ROA
• High growth phase
• Positive ROAs– Positive operating income
• ROA does not grow as rapidly as sales– Product development– marketing– depreciation– heavy capital expenditures to build capacity for
expected higher future sales
26
Product Life Cycle & ROA
• Maturity phase
• ROA increases significantly– Economies of scale– learning curve benefits– curtailment of capital expenditures
• Lower risk
27
Product Life Cycle & ROA
• Declining phase
• ROA deteriorates– operating income decreases– may remain positive
28
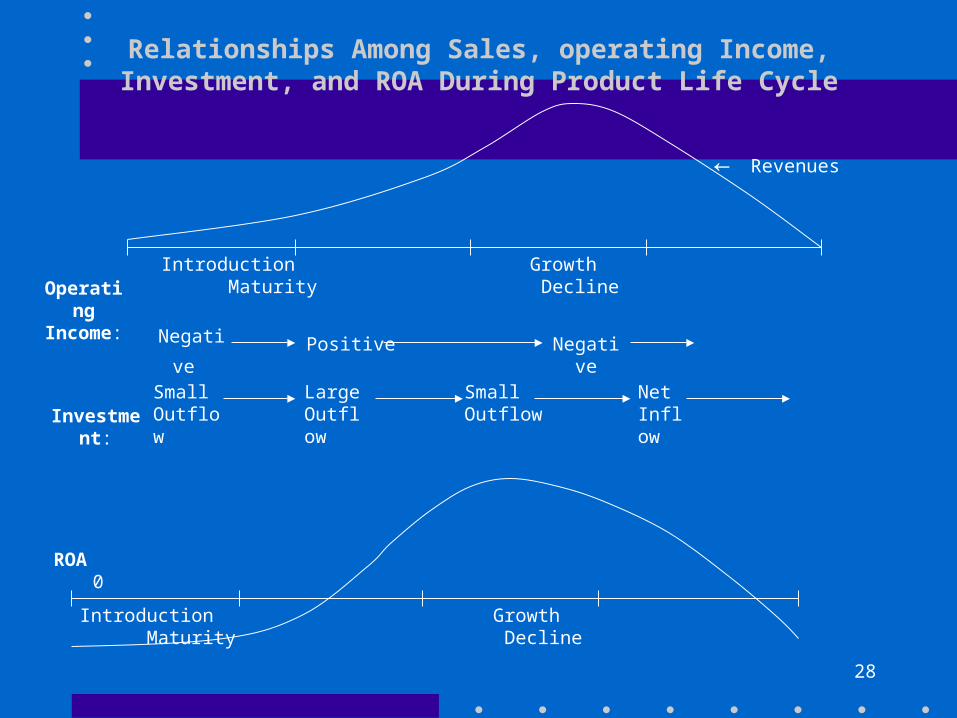
Relationships Among Sales, operating Income, Investment, and ROA During Product Life Cycle
← Revenues
Introduction Growth Maturity DeclineOperatingIncome:
Negative Positive Negative
Investment:
SmallOutflow
LargeOutflow
SmallOutflow
Net Inflow
ROA 0
Introduction Growth Maturity Decline
29
Product Life Cycle - Industry Level
• Computer industry in all phases– Overall in high growth phase
• Soft drinks and food processing industries– maturity phase– constantly introduces new products
• Steel industry– declining phase– modernize production to stave off decline
30
Consistent ROAs in Exhibit 8.1
• Amusements industry- high ROA -– High operating leverage, growth, dominant
market positions
• Apparel Retailers - low ROA– risk of fashion obsolescence
• Insurance companies - low ROA– low operating leverage, low sales cyclicality– less risk of life cycle
31
Inconsistent ROAs in Exhibit 8.1
• Petroleum, Chemical and Hotel industries
• Lower ROA– high operating leverage– risk of sales cyclicality
• Due to excess capacity and obsolete plant assets
32
ROA and GAAP
• Food processors
• Major assets - Brand names
• GAAP – expensed advertising and development costs– Assets understated– ROA overstated

33
ROA and GAAP
• Publishing industry– Value of copyrights not recognized
• Service firms– Value of employees not an asset
• Reverse the immediate expensing of advertising, R & D, recognize it as assets
34
Differences in Profit Margin and Assets Turnover
• Microeconomic theory
• Firms and industries characterized by capacity constraint (heavy fixed capacity costs, lengthy periods to add new capacity)– Upper limit on the size of assets turnover– Must generate high profit margin to attract
sufficient capital (Area A in Exhibit 8.5)

35
Differences in Profit Margin and Assets Turnover
• Firms achieve high profit margin by
• entry barrier– large required capital outlays– high risks– regulations
• Explain communications, utilities, hotels, and amusements industries in Exhibit 8.1
36
Differences in Profit Margin and Assets Turnover
• Lack of entry barrier
• Excess capacity
• Explains low ROA for chemical and petroleum industries
37
Differences in Profit Margin and Assets Turnover
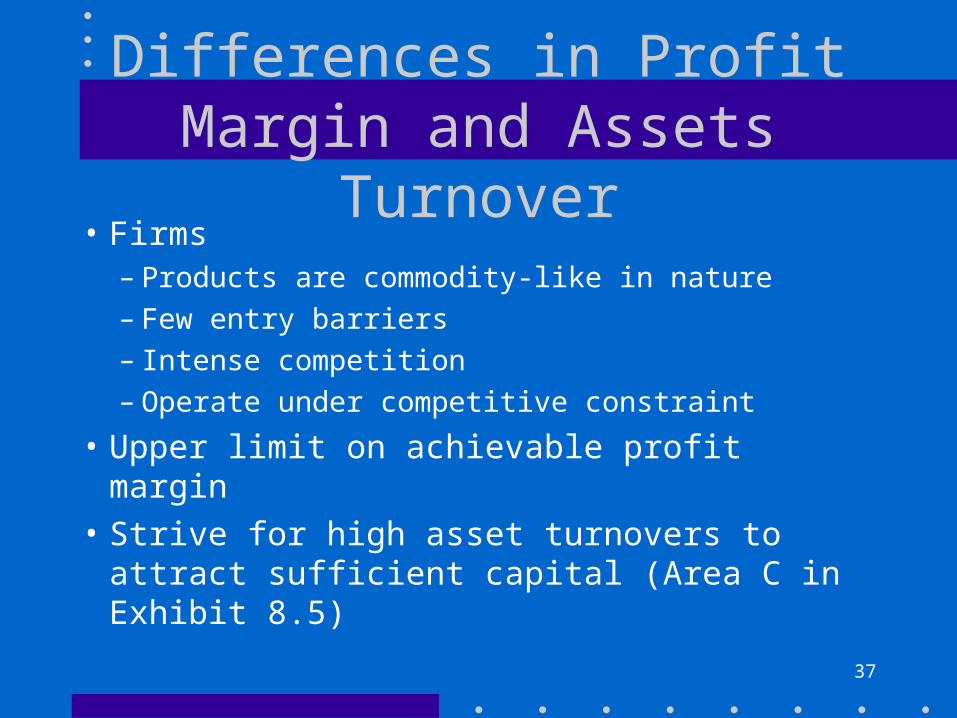
• Firms– Products are commodity-like in nature– Few entry barriers– Intense competition– Operate under competitive constraint
• Upper limit on achievable profit margin
• Strive for high asset turnovers to attract sufficient capital (Area C in Exhibit 8.5)
38
Differences in Profit Margin and Assets Turnover
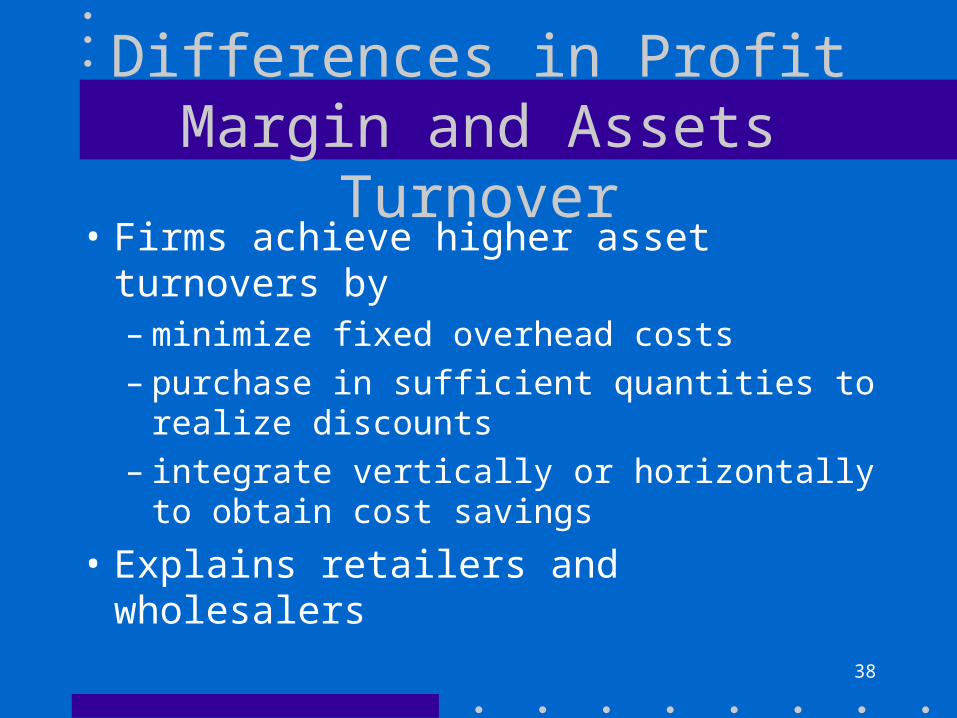
• Firms achieve higher asset turnovers by– minimize fixed overhead costs– purchase in sufficient quantities to realize
discounts– integrate vertically or horizontally to obtain
cost savings
• Explains retailers and wholesalers
39
Differences in Profit Margin and Assets Turnover
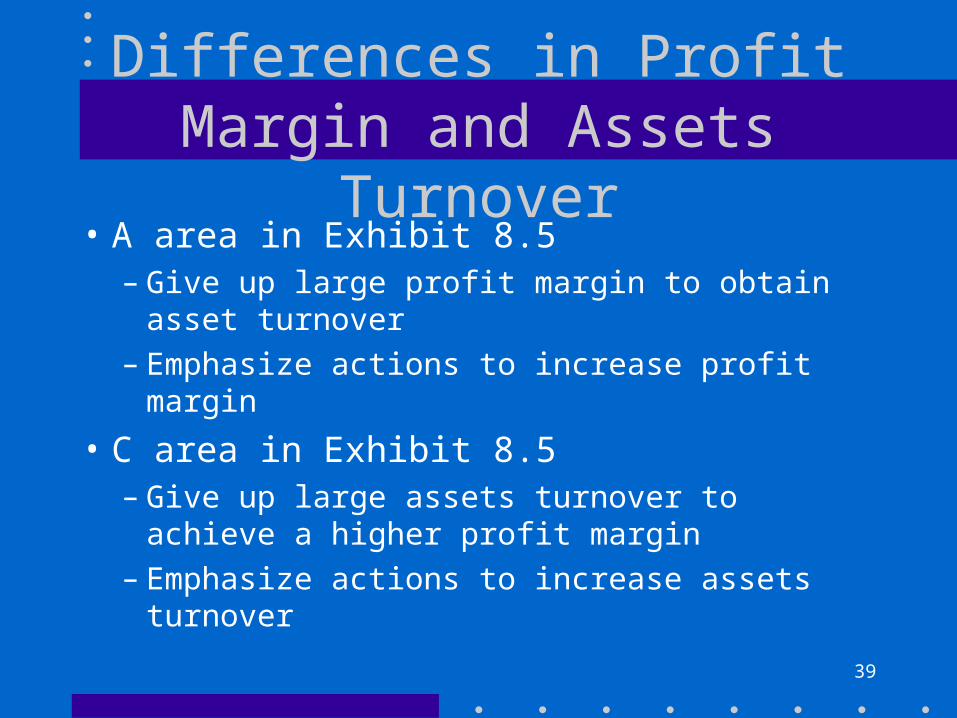
• A area in Exhibit 8.5– Give up large profit margin to obtain asset
turnover– Emphasize actions to increase profit margin
• C area in Exhibit 8.5– Give up large assets turnover to achieve a
higher profit margin– Emphasize actions to increase assets turnover
40
Differences in Profit Margin and Assets Turnover
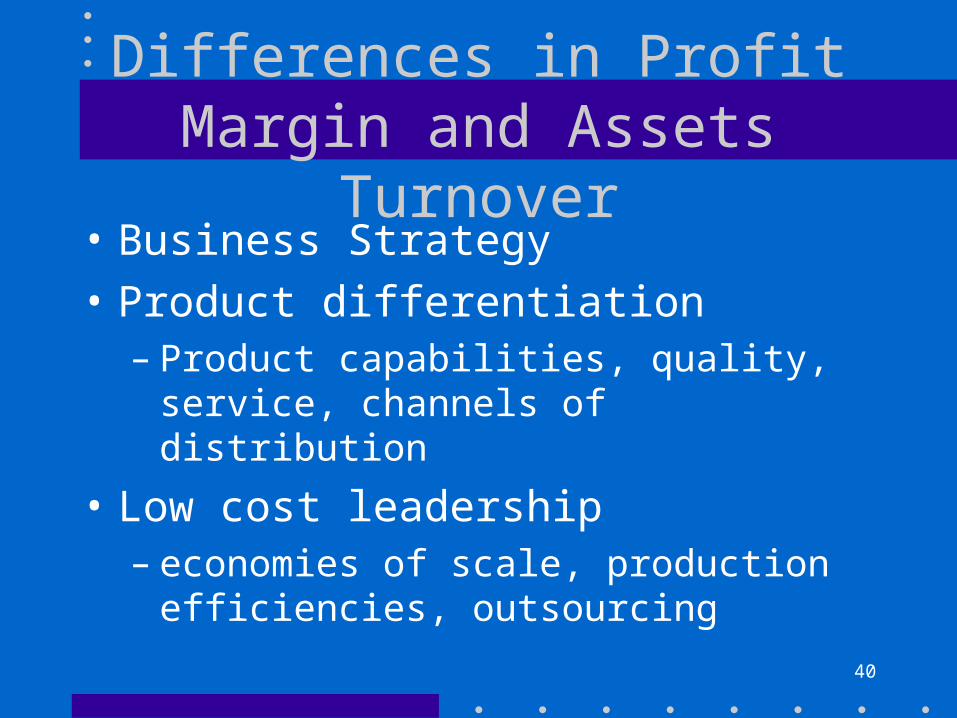
• Business Strategy
• Product differentiation– Product capabilities, quality, service, channels
of distribution
• Low cost leadership– economies of scale, production efficiencies,
outsourcing
41
Differences in Profit Margin and Assets Turnover
• Specialty retailers-
• Differentiation strategy
• Higher profit margin than general merchandise stores and grocery stores
42
Differences in Profit Margin and Assets Turnover
• External factors– Degree of competition– extent of regulation– entry barriers
• Internal strategic choices– Product differentiation– Low-cost leadership
43
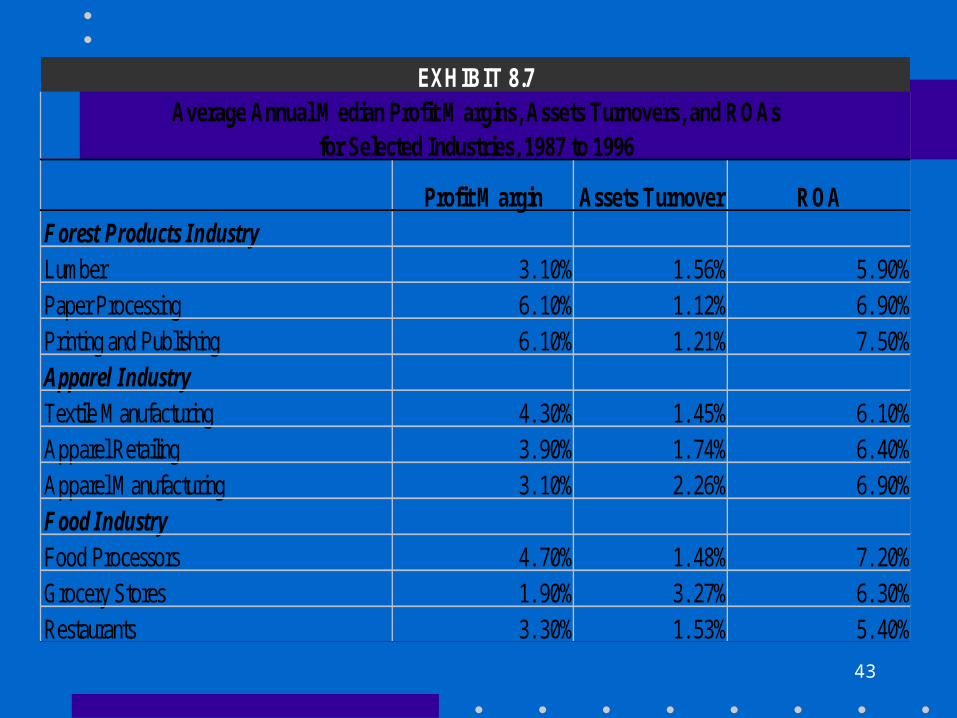
Profit Margin Assets Turnover ROAForest Products IndustryLumber 3. 10% 1. 56% 5. 90%Paper Processing 6. 10% 1. 12% 6. 90%Printing and Publishing 6. 10% 1. 21% 7. 50%Apparel IndustryTextile Manufacturing 4. 30% 1. 45% 6. 10%Apparel Retailing 3. 90% 1. 74% 6. 40%Apparel Manufacturing 3. 10% 2. 26% 6. 90%Food IndustryFood Processors 4. 70% 1. 48% 7. 20%Grocery Stores 1. 90% 3. 27% 6. 30%Restaurants 3. 30% 1. 53% 5. 40%
EXHIBIT 8.7Average Annual Median Profit Margins, Assets Turnovers, and ROAs
for Selected Industries, 1987 to 1996
44
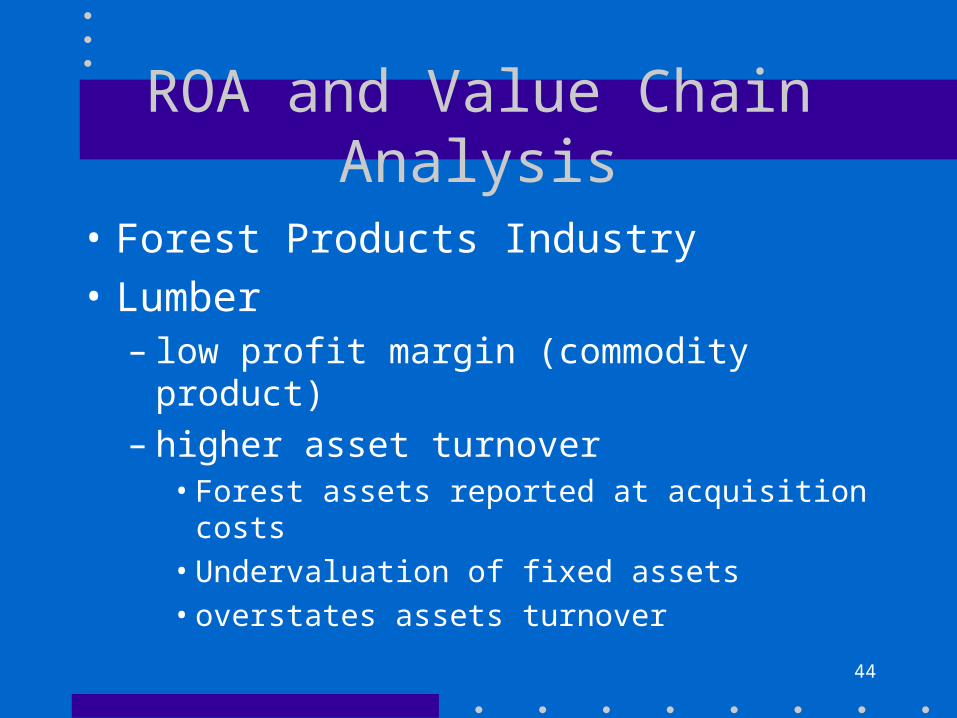
ROA and Value Chain Analysis
• Forest Products Industry
• Lumber– low profit margin (commodity product)– higher asset turnover
• Forest assets reported at acquisition costs
• Undervaluation of fixed assets
• overstates assets turnover
45
ROA and Value Chain Analysis
• Forest Products Industry
• Paper processing – higher profit margin than lumber– Capital intensive paper processing facilities– lower assets turnover
46
ROA and Value Chain Analysis
• Forest Products Industry
• Printing and Publishing– Higher profit margin
• Non-differentiated and differentiated products
– Capital intensive printing facilities– lower assets turnover– Highest ROA in industry
47
ROA and Value Chain Analysis
• Apparel industry
• Textile manufacturing – higher profit margin
• undifferentiated products - fabrics
– Lower asset turnover• capital intensive
• Risk of diseconomies of scale in capital-intensive manufacturing facilities
48
ROA and Value Chain Analysis
• Apparel industry
• Apparel manufacturing
• Higher profit margin– outsource manufacturing to lower wage rate
countries and– outsource to the brand names of apparel products
• Risk of exchange rate changes, political risk and fashion changes
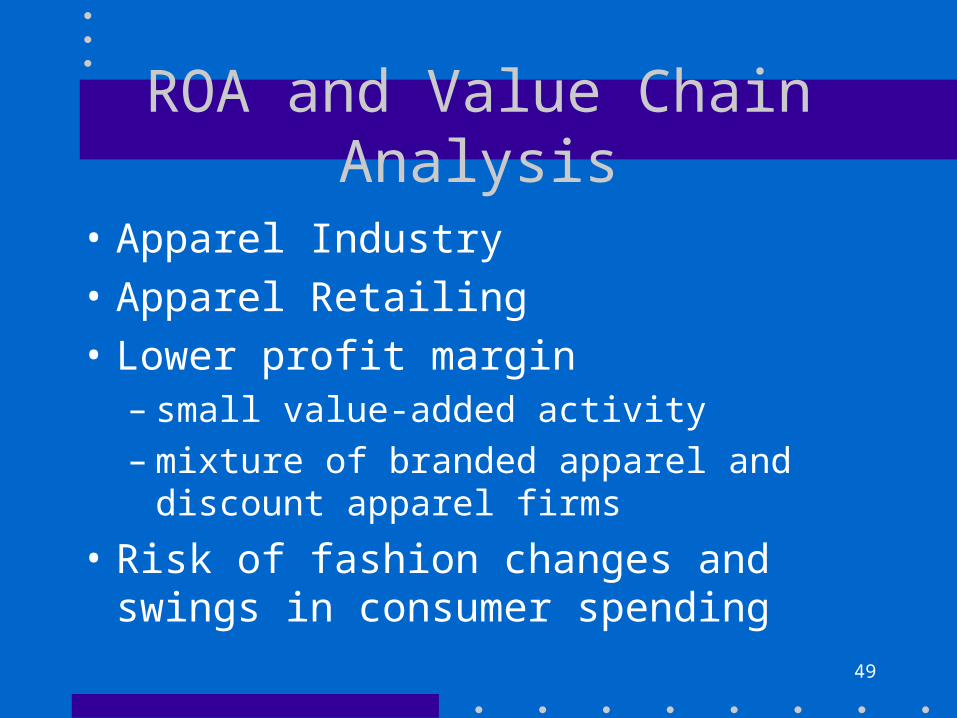
49
ROA and Value Chain Analysis
• Apparel Industry
• Apparel Retailing
• Lower profit margin– small value-added activity– mixture of branded apparel and discount apparel
firms
• Risk of fashion changes and swings in consumer spending
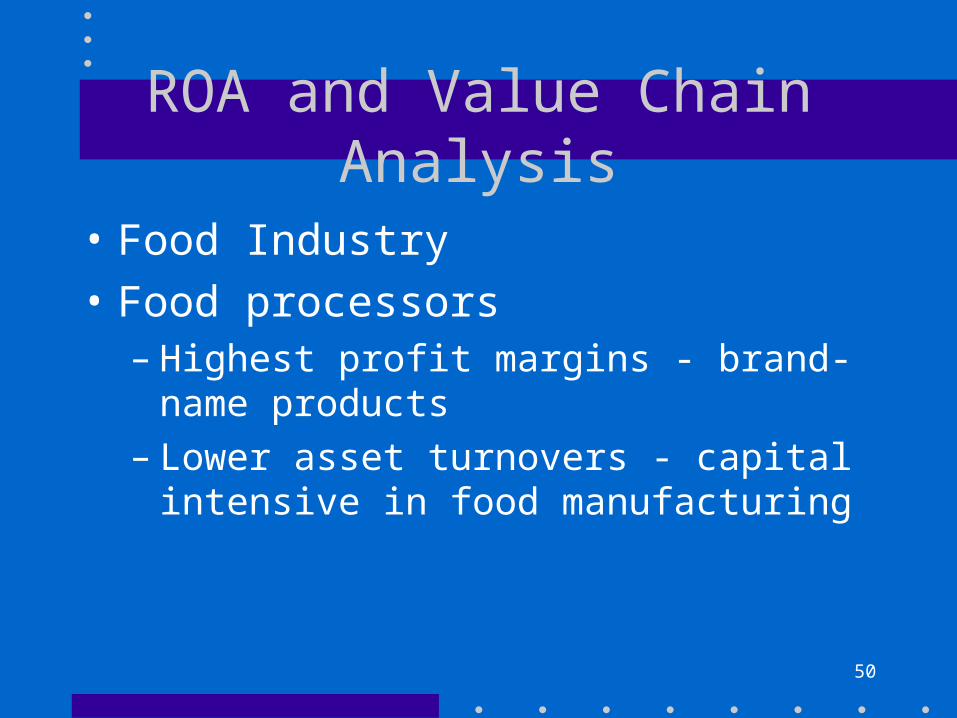
50
ROA and Value Chain Analysis
• Food Industry
• Food processors– Highest profit margins - brand-name products– Lower asset turnovers - capital intensive in
food manufacturing
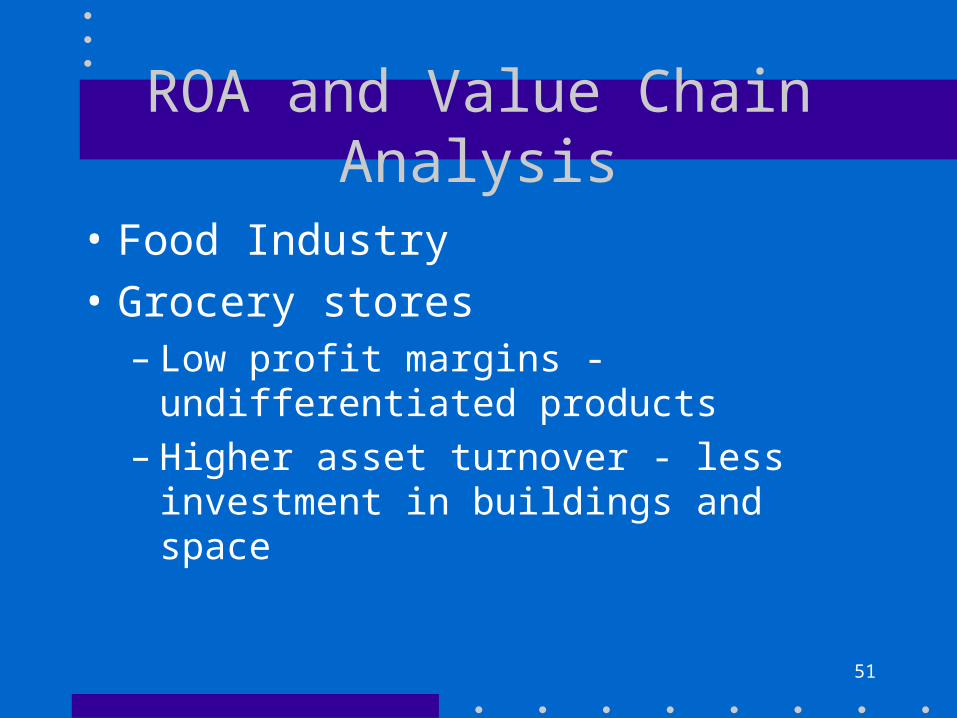
51
ROA and Value Chain Analysis
• Food Industry
• Grocery stores– Low profit margins - undifferentiated products– Higher asset turnover - less investment in
buildings and space
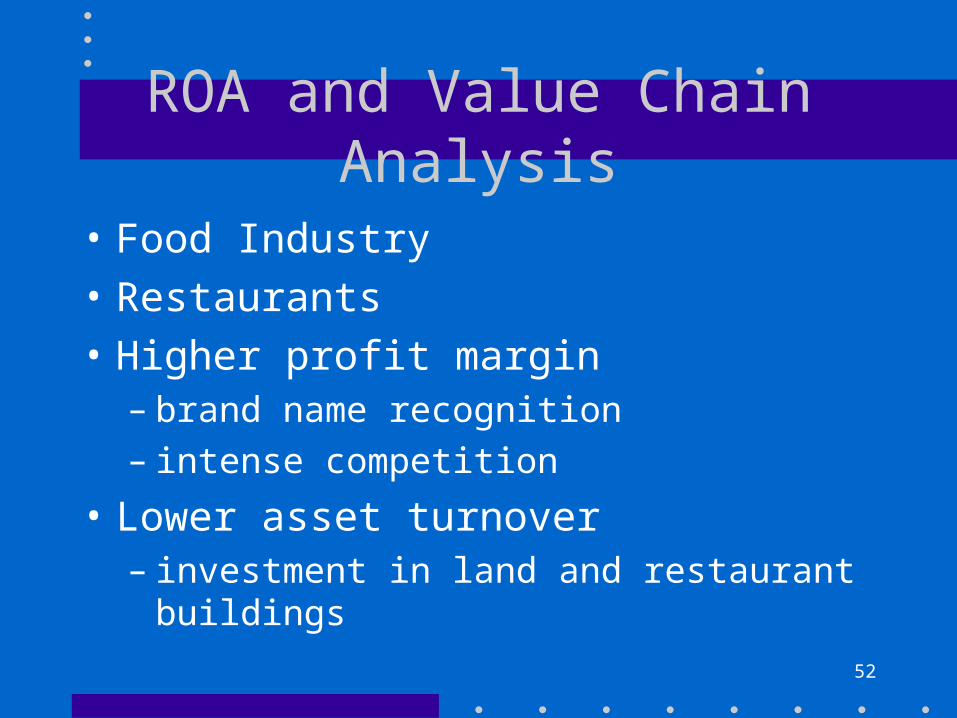
52
ROA and Value Chain Analysis
• Food Industry
• Restaurants
• Higher profit margin – brand name recognition– intense competition
• Lower asset turnover– investment in land and restaurant buildings
53
Supplementing ROA
• Analyzing Retailers
• Some own and some lease their stores
• Express sales, operating expenses, and operating income on a per square foot basis
• Exhibit 8.8
54
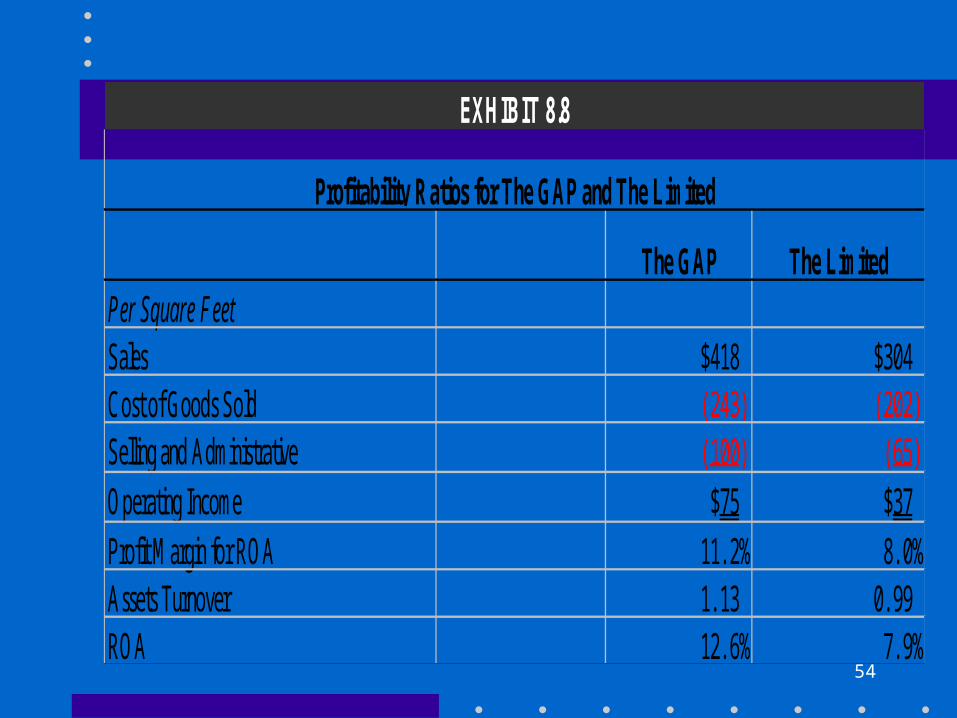
The GAP The LimitedPer Square FeetSales $418 $304Cost of Goods Sold (243) (202)Selling and Administrative (100) (65)Operating Income $75 $37Profit Margin for ROA 11. 2% 8. 0%Assets Turnover 1. 13 0. 99ROA 12. 6% 7. 9%
Profitability Ratios for The GAP and The Limited
EXHIBIT 8.8
55
Supplementing ROA
• Analyzing airlines
• Compute revenues and expenses– per available seat mile and– per seat miles flown
56
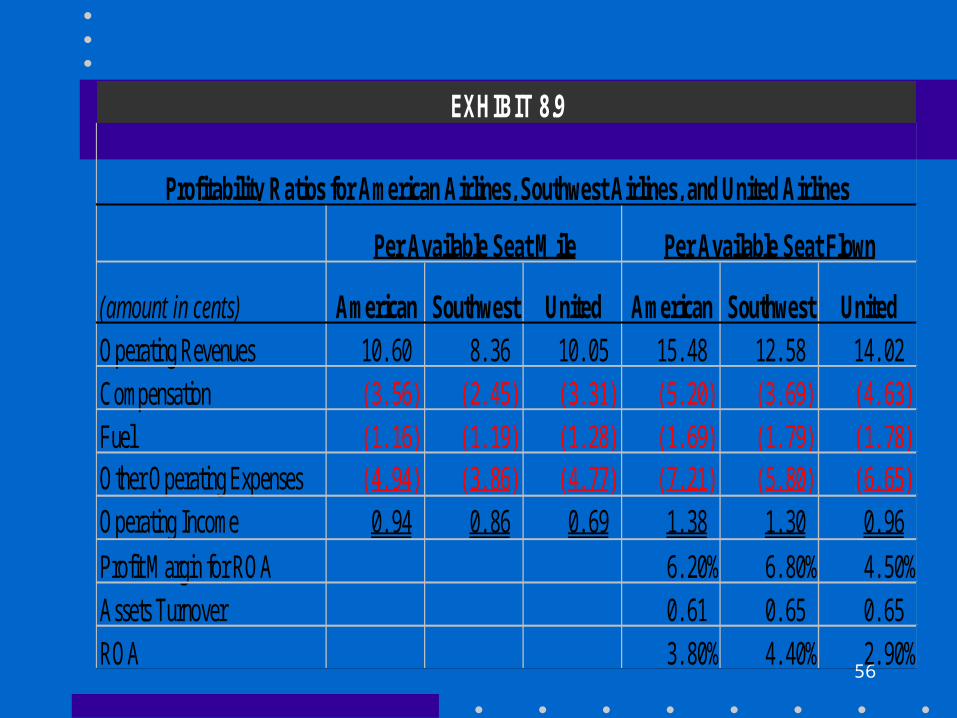
(amount in cents) American Southwest United American Southwest UnitedOperating Revenues 10. 60 8. 36 10. 05 15. 48 12. 58 14. 02Compensation (3. 56) (2. 45) (3. 31) (5. 20) (3. 69) (4. 63)Fuel (1. 16) (1. 19) (1. 28) (1. 69) (1. 79) (1. 78)Other Operating Expenses (4. 94) (3. 86) (4. 77) (7. 21) (5. 80) (6. 65)Operating Income 0. 94 0. 86 0. 69 1. 38 1. 30 0. 96Profit Margin for ROA 6. 20% 6. 80% 4. 50%Assets Turnover 0. 61 0. 65 0. 65ROA 3. 80% 4. 40% 2. 90%
Per Available Seat Mile Per Available Seat Flown
EXHIBIT 8.9
Profitability Ratios for American Airlines, Southwest Airlines, and United Airlines
57
Supplementing ROA
• Analyzing Advertising Firm
• Analyze income data on per employee basis
58
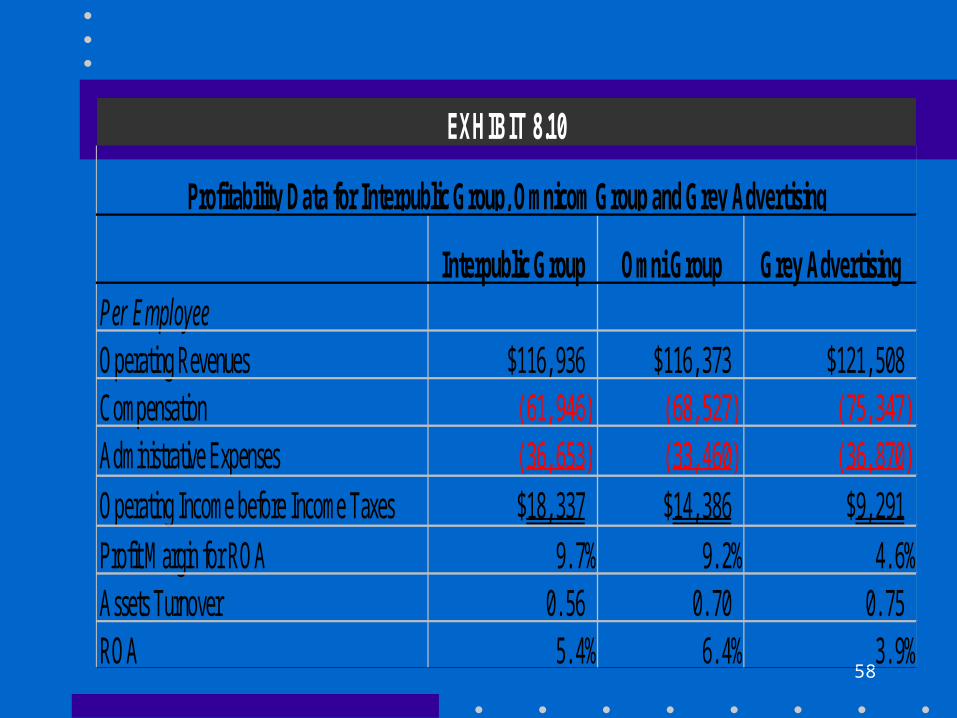
Interpublic Group Omni Group Grey AdvertisingPer EmployeeOperating Revenues $116, 936 $116, 373 $121, 508Compensation (61, 946) (68, 527) (75, 347)Administrative Expenses (36, 653) (33, 460) (36, 870)Operating Income before Income Taxes $18, 337 $14, 386 $9, 291Profit Margin for ROA 9. 7% 9. 2% 4. 6%Assets Turnover 0. 56 0. 70 0. 75ROA 5. 4% 6. 4% 3. 9%
EXHIBIT 8.10
Profitability Data for Interpublic Group, Omnicom Group and Grey Advertising
59
Supplementing ROA
• Analyzing Technology-Based Firms
• Two important resources not reported as assets– People– Technology (R & D expensed)
• Assets and net income understated