Embed Size (px)
Citation preview
1
Yulia Ignatyeva, Irina Morozova, Kristina VolkovaYulia Ignatyeva, Irina Morozova, Kristina Volkova
JSC«SRI Atmosphere»Section for Scientific-Methodological Basics of Environmental Impact Assessment,
Transboundary Transfer and State AccountingE-mail: E-mail: [email protected]@gmail.com
ТТelel. +7 812 297 . +7 812 297 53 0553 05
TFIAM 41, 7-9 May 2012, Bilthoven, The TFIAM 41, 7-9 May 2012, Bilthoven, The NetherlandsNetherlands
2
Russian-Swedish cooperation projectDevelopment of the Cooperation within the Convention on Long-range Transboundary Air Pollution — CLRTAP www.rusaco.se
Overall objective:
To raise the awareness of global air pollution and to strengthen the political profile of CLRTAP activities in the Russian Federation.
Phase III: 2011-2012

3
European territory of Russia is presented by regions:
• Russia, Kaliningrad• Russia, Kola and Karelia• Russia, St. Petersburg• Russia, Remaining
GAINS RUSSIA(earlier version)

4
GAINS_RUSSIA

5
Determining coefficients of source-receptor Determining coefficients of source-receptor dependencies for EMEP grid cells and dependencies for EMEP grid cells and Russian regions (federal districts), with the Russian regions (federal districts), with the help of the EMEP model help of the EMEP model
Introduction of the dependencies into the GAINS model for making it possible to calculate and show environmental and health impacts
6
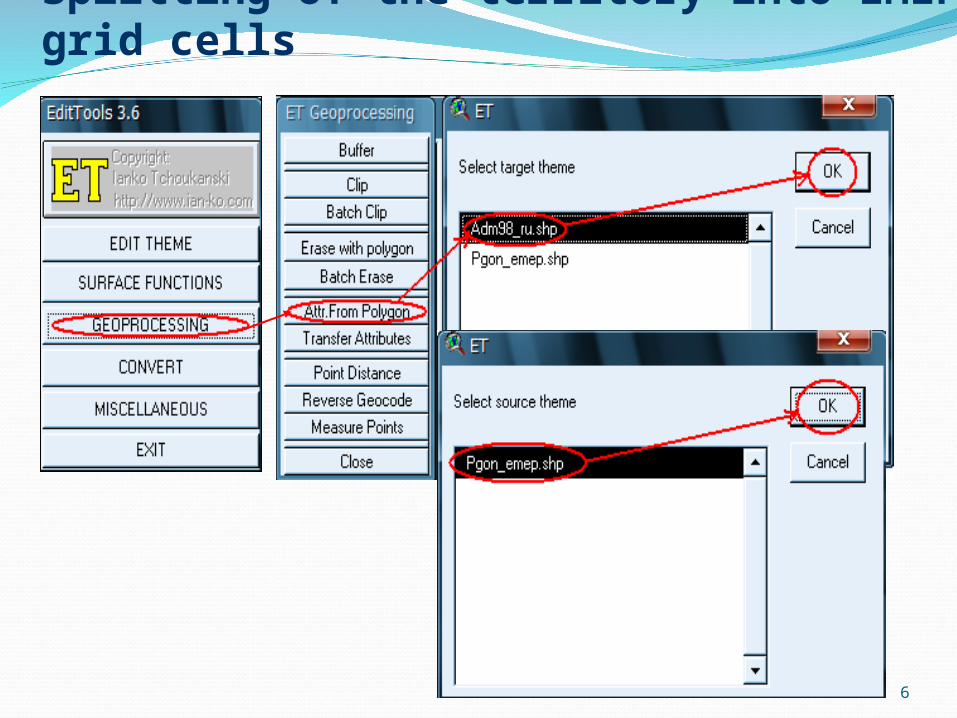
Splitting of the territory into EMEP grid cells

7
Splitting of the territory into EMEP grid cells

8
List of the substances
NH3
NMVOC
NOx
CO
PM2.5
PMcorca
SOx
700 – Central
701 – South
702 – Northern Caucasus
704 – Other central (Moscow excluded)
550 – Moscow
708 – Northwestern
709 – Volga
Codes of regions in the EMEP model

9
Spatial distribution of emissionsCO, t/yearCO, t/year SOSO22, t/year, t/year

10
Splitting of the territory into EMEP grid cells

11
CEIP data (2008) split over the European territory of Russia, EMEP input data format

12
GAINS input data sources
Main interregional center for processing and distribution of statistical information under the authority
of the Federal State Statistics Service
Federal State Statistics Service
Informational-analytical edition «Automobile market in Russia»
Territorial Bodies of GIBDD (State Inspection for Road Traffic Safety)

13
Production of electricity and heat, PJ
Region
Russia, totalNorthweste
rnCentral Volga South
Northern Caucasus
2005 2010 2005 2010 2005 2010 2005 2010 2005 2010 2005 2010
Electicity producted, total 3431.1 3736.9 342.1 398.6 755.4 823.8 675.0 686.4 171.1 181.9 80.9 90.3
including
Electiricty produced by nuclear power stations
536.4 613.5 120.3 137.6 263.4 301.2 100.7 115.2 39.1 44.7 0.0 0.0
Electiricty produced by hydropowerstations
630.0 598.3 49.1 46.6 6.6 6.3 92.6 87.9 42.9 40.7 31.1 29.5
Heat produced, total 6031.2 5749.8 745.7 710.9 1385.4 1320.8 1400.1 1334.7 269.1 256.5 80.7 77.0

14
Region
Northwestern
Central Volga SouthNorthern Caucasus
2005 2010 2005 2010 2005 2010 2005 2010 2005 2010
Fuel used, total 2320.22501.
24359.9 4722.8 5992.3 4120.3 1279.6 1281.7 548.4 549.3
including
Solid fuel 441.6 553.3 530.4 586.9 242.0 327.3 65.5 64.9 28.1 27.8
Biofuel 30.7 20.9 19.2 9.0 17.7 12.7 1.4 0.8 0.6 0.3
Liquid fuel 482.5 504.8 445.4 690.1 2286.6 546.9 163.3 190.9 70.0 81.8
Gaseous fuel 1365.41422.
33364.8 3436.8 3446.0 3233.3 1049.5 1025.2 449.8 439.4
Fuel consumption by type, PJ

15
Number of vehicles, thousands2005
2010
Northwestern
Volga
Northern Caucasus
Central
South
pass
enge
r car
she
avy
duty
truc
ksbu
ses
MC mop
eds
pass
enge
r car
she
avy
duty
truc
ksbu
ses
MC
mop
eds

16

17
Emission comparisons
RegionIIASA National emission inventory
2005 2010 2005 2010
SO2, th. ton
Northwestern 719 650 578 603
Central 256 232 261 172
Volga 560 507 493 359
South 260 235 160 111
Northern Caucasus 178 161 22 12
NOx, th. ton
Northwestern 402 348 311 317
Central 1133 979 790 727
Volga 882 762 513 627
South 409 353 374 215
Northern Caucasus 280 242 154 189
CO, th. ton
Northwestern 4050 4034 1513 1708
Central 10132 10088 3712 3165
Volga 8053 8018 2829 2594
South 3712 3696 2829 960
Northern Caucasus 2505 2494 958 827
18
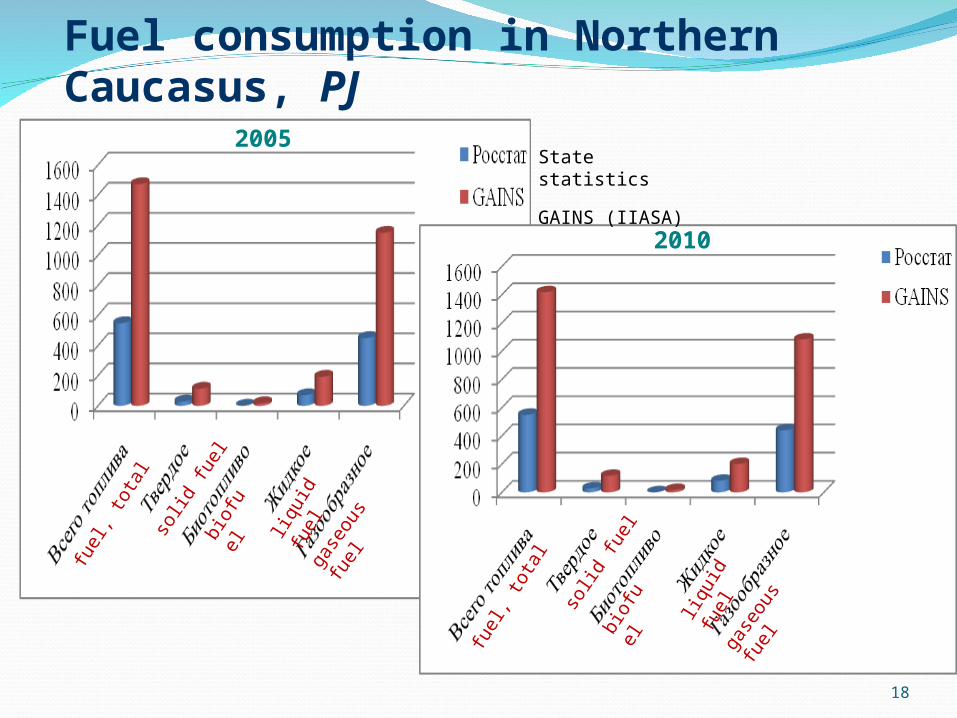
Fuel consumption in Northern Caucasus, PJ2005
2010
fuel
, tot
al
solid
fuel
biof
uel
liqui
d fu
elga
seou
s fu
el
fuel
, tot
al
solid
fuel
biof
uel
liqui
d fu
elga
seou
s fu
el
State statistics
GAINS (IIASA)

19
Further work
Studying development strategies for federal districts
Development of projections in the GAINS model
Calculations in the GAINS model

2020