Embed Size (px)
Citation preview

1
Relative Value
Average P/E’s
&
Toolkit
2
Relative Value
• Relative Value is a ratio that compares the current P/E to the Average P/E.
• Projected Relative Value is a ratio that compares the Projected P/E to the Average P/E
3
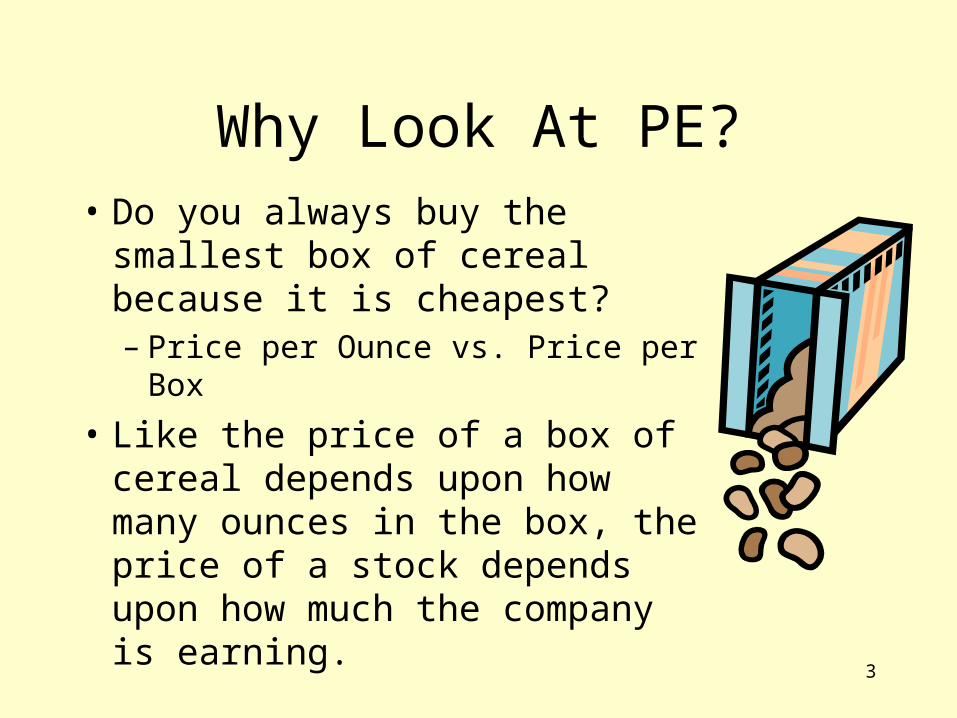
Why Look At PE?
• Do you always buy the smallest box of cereal because it is cheapest?– Price per Ounce vs. Price per Box
• Like the price of a box of cereal depends upon how many ounces in the box, the price of a stock depends upon how much the company is earning.

4
Why Look At Relative Value?
• Today the price of a gallon of gasoline is $1.40. Is that higher or lower than average?
• Relative Value compares today’s PE to the average PE to determine if today’s price is higher or lower than average?

5
Toolkit • Toolkit makes the assumption that the
Average P/E in Section 3 is the one you are using.
• What if you threw out all the P/E’s in Section 3 and arbitrarily selected a new Average High P/E and Average Low P/E for Section 4?
• In that case, Toolkit will calculate the Relative Value and Projected Relative Value using the wrong Average P/E

6
This is Dollar Tree
The high P/E’s for all of the last five years are above 30 and I have decided to be conservative and not go above 30 for my average high P/E.
I also notice that in all but one of the last five years the low P/E is less than half the high P/E. Therefore I want my average low P/E to be 15 or lower

7
This is the history of the of Dollar Tree’s P/E’s.

8
My Average P/E would be 22.5 not 29.

9
My Relative Value based on my judgment is 91.1 and my Projected Relative Value is 77.
10
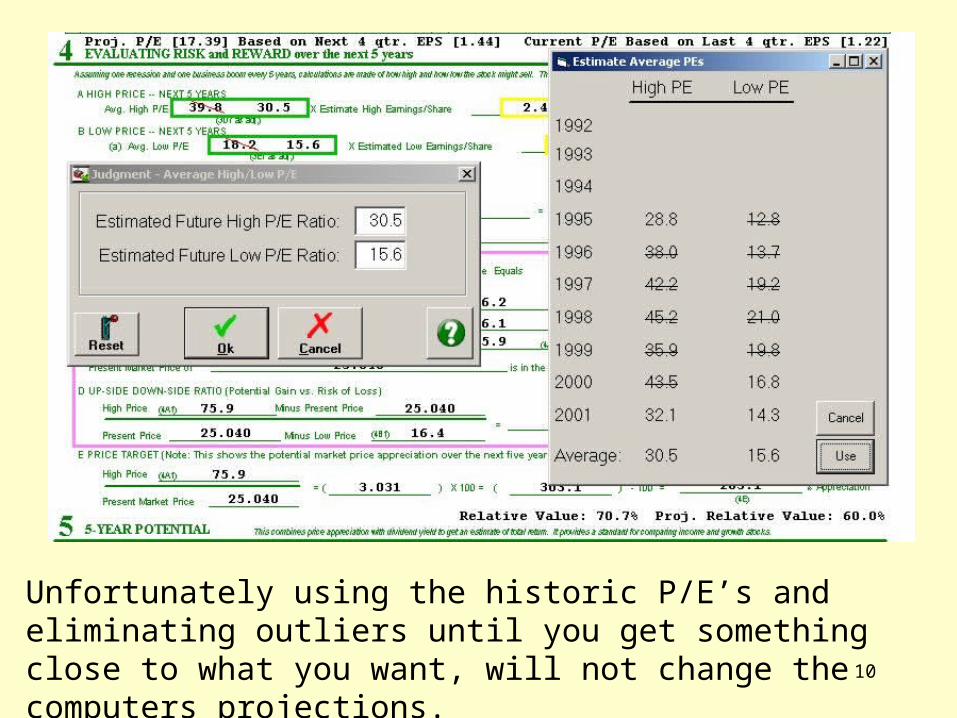
Unfortunately using the historic P/E’s and eliminating outliers until you get something close to what you want, will not change the computers projections.

11
Sometimes we are able to eliminate enough outliers in Section 3 to come up with an average high P/E and average low P/E we can use. Then our Relative Value and Projected Relative Value are correct.
Sungard Data Systems

12
Conclusion
• If you arbitrarily change the average high P/E and the average low P/E in Toolkit your Relative Value and Projected Relative Value will be wrong.
• In that case you have to calculate the Relative Value and Projected Relative Value Manually.