Embed Size (px)
Citation preview

e1 71n r r n m y
(T 1 ImI-U LUS Army CorpsREPORT 88w20 of EngineersDTIC Cold Regions Research &
ECT E Engineering Laboratory
_ _ _ _ _ _ _ _ _ _ _ _ _ _ _ _ _T E 8
Development and design of sludge freezing beds
cc,
N
89 10 2 04 4

For conversion of SI metric units to U.S./British customaryunits of measurement consult ASTM Standard E380, MetricPractice Guide, published by the American Society for Test-ing and Materials, 1916 Race St., Philadelphia, Pa. 19103.
Cover: Prototype sludge freezing bed.

CRREL Report 88-20December 1988
Development and design of sludge freezing beds
C. James Martel
Acces!-I'n For
I T
Prepared for
OFFICE OF THE CHIEF OF ENGINEERS
Approved for public release; distribution is unlimited.

UNCLASSIFIEDSECURITY CLASSa=ICATION OF THIS PAGE
Form ApprovedREPORT DOCUMENTATION PAGE OMB NO. 0704-0188
1 Exp. Dote: Jun 30. 1986
Ia. REPORT SECURITY CLASSIFICATION lb. RESTRICTIVE MARKINGS
Unclassified2o. SECURITY CLASSIFICATION AUTHORITY 3. DISTRIBUTION/AVAILABILITY OF REPORT
2b DECLASSIFICATION/DOWNGRADING SCHEDULE Approved for public release;distribution is unlimited.
4 PERFORMING ORGANIZATION REPORT NUMBER(S) 5. MONITORING ORGANIZATION REPORT NUMBER(S)
CRREL Report 88-20
6a. NAME OF PERFORMING ORGANIZATION 6b. OFFICE SYMBOL 7a. NAME OF MONITORING ORGANIZATION
U.S. Army Cold Regions Research (if applicable)and Engineering Laboratory CECRL6C ADDRESS (City. State. and ZIP Code) 7b. ADDRESS (City, State, and ZIP Code)
.a..ovcr, New Ha--pshirc C55-1190 Washington, D.C. 20314-1000
Ba. NAME OF FUNDING/SPONSORING 8b. OFFICE SYMBOL 9. PROCUREMENT INSTRUMENT IDENTIFICATION NUMBERORGANIZATION (if applicable)
Bc ADDRESS (City, State, and ZIP Code) 10. SOURCE OF FUNDING NUMBERS
PROGRAM PROJECT TASK WORK UNITELEMENT NO. NO. 4A7627 NO. ACCESSION NO
6.27.30A 30AT42 BS 029
11 TITLE (Include Security Classification)
Development and Design of Sludge Freezing Beds
12. PERSONAL AUTHOR(S)
Martel, C. James13a. TYPE OF REPORT 130. TIME COVERED 14. DATE OF REPORT (Year. Month, Day) 15. PAGE COUNT
FROM TO December 1988 58
16. SUPPLEMENTARY NOTATION
17. COSATI CODES 18. SUBJECT TERMS (Continue on reverse if necessary and identify by block number)
FIELD GROUP SUB-GROUP Freeze-thaw conditioning Sludge dewatering
7Sewage treatment, Sludge freezing
19. ABSTRACT (Continue on reverse if necessary and identify by block number)
This study develops design criteria for a new sludg- . -itering unit operation called a sludge freezing bed. This beduses natural freeze-thaw to condition the sludge. 71 ,, to' ) depth of sludge that can be frozen, thawed and dewatered bythis process in a year is the main criterion needed foi ;n. Laboratory tests assessed the dewaterability of freeze-thawconditioned water treatment plant sludge and both anax obically and aerobically digested wastewater sludges at variousdepths. Mathematical models for predicting the design depth were developed; values for the input parameters to themodels were obtained from the literature or from laboratory and pilot-scale experiments. The dewaterability tests indi-cated that the depth of sludge that can be applied is not limited by drainability. Up to 2.0 m of each sludge drained inminutes after freeze-thaw conditioning. Except for the aerobically digested sludge, the solids content after drainage ishigh enough to permit mechanical removal. The physical and thermal characteristics of frozen sludge were found to beequivalent to those of ice. An analysis of the freezing and thawing models rqvvals that the design of a freezing bed willdepend on the duration and intensity of the freezing and thawing seasons.
20. DISTRIBUTION/AVAI'LABILITY OF ABSTRACT 21 ABSTRACT SECURITY Cl ASSIFICATION[X UNCLASSIFIED/UNLIMFED (] SAME AS RPT. E:] DTIC USERS Unclassified
220. NAME OF RESPONSIBLE INDIVIDUAL 22b TELEPHONE (include Area Code) 22c. OFFICE SYMBOL
C. fames Martel 603-646-4100 CECRL-ECDD FORM 1473, 84 MAR 83 APR cditlon may be used until exhausted. ,ZCURITY CLASSIFICATION OF THIS PAGE
All other editions are obsolete.UNCLASSIFIED

PREFACE
This report was prepared by Dr. C. James Martel, Environmental Engineer, Civil andGeotechnical Engineering Research Branch, Experimental Engineering Division, U.S. ArmyCold Regions Research and Engineering Laboratory. This study was funded by DA Project4A762730AT42, Design, Construction, and Operations Technology for Cold Regions; TaskBS, Base Support; Work Unit 029, Solid Waste and Residuals Management in Cold Regions.The author thanks R. Sletten for sharing funding under this project.
Several people made significant contributions to this study. The author thanks: R. Forestand P. Stanley ior designing and constructing the sludge freezing trays; S. Gagnon, UNHwork study student, for conducting the drainage and drying tests; A. Tice, R. Stoops and M.Walsh for measuring the freezing point of sludges; C. Diener for setting up the prototypefreezing bed and analyzing the data; T. Plantc, also a UNH work study student, for dataanalysis and programming; P. Weyrick for laboratory analysis of filtrate; Dr. A. Gow andN. Perron for preparation and interpretation of thin sections from frozen sludge cakes; Dr.V. Lunardini for assistance in developing the freezing and thawing models; Dr. A. Vesilindfor a technical review; D. Harp for diligent typing of the manuscript; and D. Cate and M.Hardenberg for the editorial reviews. This report is from a dissertation submitted to the aca-demic faculty of Colorado State University in partial fulfillment of the requirements for thedegree of Doctor of Philosophy.
The contents of this report are not to be used for advertising or promotional purposes. Ci-tation of brand names does not constitute an official endorsement or approval of the use ofsuch commercial products.
ii
CONTENTSPage
A b stra ct . . . . . . . . . . . . . . . . . . . . . . . . . . . . . . . . . . . . . . . . . . . . . . . . . . . . . . . . . . . . . . . . iPreface ................................................................ iiN om enclature ............................................................ vIn tro d u ctio n .... . .... ... .. .. .... ... ... ... .. ... ... .. ... ... ... ... ... ... ... . I
B ackgro und ......................................... ................. IP u rp o se .. .. ... . .. ... .. .. ... .... ... ... .. ... .. ... ... ... .. ... ... ..... .. .. IS co pe ................................ ................................ 2
L iterature review ......................................................... 2Fundamentals of freeze separation ........................................ 2Applications of freeze separation technology ................................ 3C onclu sio ns ........................................................... 6
C oncept developm ent ..................................................... 6B ackground ........................................................... 6
S ite visits . ... ... .. .... .. ... .... ... ... ... .. ... ... .. ... ... ... ... .... ... ..F inal co ncept .......................................................... 9
D ew aterability studies ..................................................... 11Sludge characteristics ................................................... 11Specific resistance and capillary suction time ................................ 11F iltrate q uality ......................................................... 13D rainage tests .......................................................... 13D rying tests ............................................................ 20
Development of design m odels .............................................. 22Basic energy balance relationship .......................................... 22Development of freezing model ........................................... 24Development of thawing model ........................................... 28O ther m odels .......................................................... 30
Evaluation of sludge input parameters ....................................... 30Frozen sludge density, Lo ................................................. 30Layer thickness, .................................................. 31Settled solids fraction, 0 ................................................. 31Therm al conductivities, Kfs, K ............................................ 31Latent heat of fusion, L ................................................. 32A bsorptance, a ......................................................... 32
Freezing point, Tf ....................................................... 32Sum m ary .............................................................. 33
Evaluation of climatic input parameters ...................................... 34Ambient air temperatures, , Tat ..................................... 34Insolation, i ................. 34Convection coefficient, / c ........ ........................................ 34
U se of m odels for design ................................................... 37Freezing design depth ................................................... 37Thawing design depth ................................................... 39V alidation ............................................................. 39E xam p le .............................................................. 39
Conclusions and recommendations .......................................... 42L iterature cited .............................................. ............ 43Appendix A: Sludge freezing at the Salem, New Hampshire, Wastewater Treatment
P lan t .. ... ... ... . .... ... .... ... ... ... ... .. ... ... .. .... ..... ... ... .. . 4 7
iii
ILLUSTRATIONS
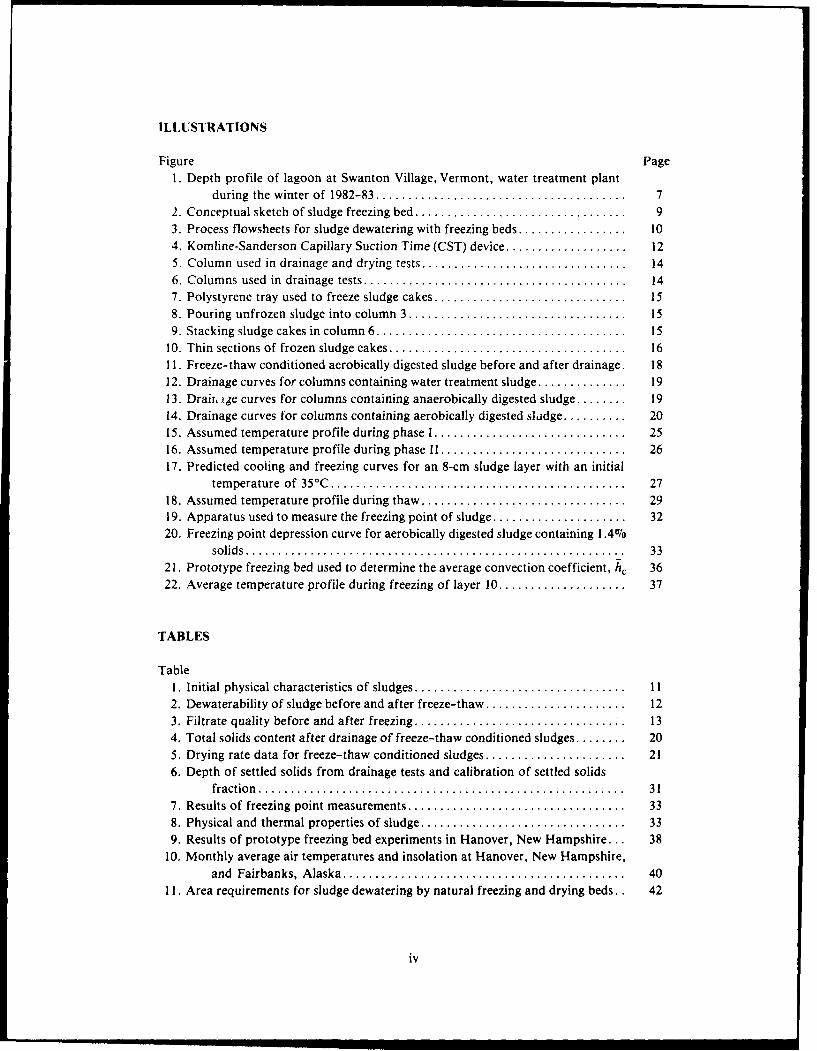
Figure Page1. Depth profile of lagoon at Swanton Village, Vermont, water treatment plant
during the winter of 1982-83 ....................................... 72. Conceptual sketch of sludge freezing bed ................................. 93. Process flowsheets for sludge dewatering with freezing beds ................. 104. Komline-Sanderson Capillary Suction Time (CST) device ................... 125. Column used in drainage and drying tests ................................ 146. Colum ns used in drainage tests ......................................... 147. Polystyrene tray used to freeze sludge cakes .............................. 158. Pouring unfrozen sludge into column 3 .................................. 159. Stacking sludge cakes in colum n 6 ....................................... 15
10. Thin sections of frozen sludge cakes ..................................... 1611. Freeze-thaw conditioned aerobically digested sludge before and after drainage. 1812. Drainage curves for columns containing water treatment sludge .............. 1913. Drair ige curves for columns containing anaerobically digested sludge ........ 1914. Drainage curves for columns containing aerobically digested sludge .......... 2015. Assumed temperature profile during phase I .............................. 2516. Assumed temperature profile during phase 11 ............................. 2617. Predicted cooling and freezing curves for an 8-cm sludge layer with an initial
tem perature of 35°C .............................................. 2718. Assumed temperature profile during thaw ................................ 2919. Apparatus used to measure the freezing point of sludge ..................... 3220. Freezing point depression curve for aerobically digested sludge containing 1.4%0
solids ......................................................... 3321. Prototype freezing bed used to determine the average convection coefficient, h, 3622. Average temperature profile during freezing of layer 10 .................... 37
TABLES
TableI. Initial physical characteristics of sludges ................................. 112. Dewaterability of sludge before and after freeze-thaw ...................... 123. Filtrate quality before and after freezing ................................. 134. Total solids content after drainage of freeze-thaw conditioned sludges ........ 205. Drying rate data for freeze-thaw conditioned sludges ...................... 216. Depth of settled solids from drainage tests and calibration of settled solids
fraction ......................................................... 3 17. Results of freezing point measurements .................................. 338. Physical and thermal properties of sludge ................................ 339. Results of prototype freezing bed experiments in Hanover, New Hampshire... 38
10. Monthly average air temperatures and insolation at Hanover, New Hampshire,and Fairbanks, A laska ............................................ 40
11. Area requirements for sludge dewatering by natural freezing and drying beds.. 42
iv
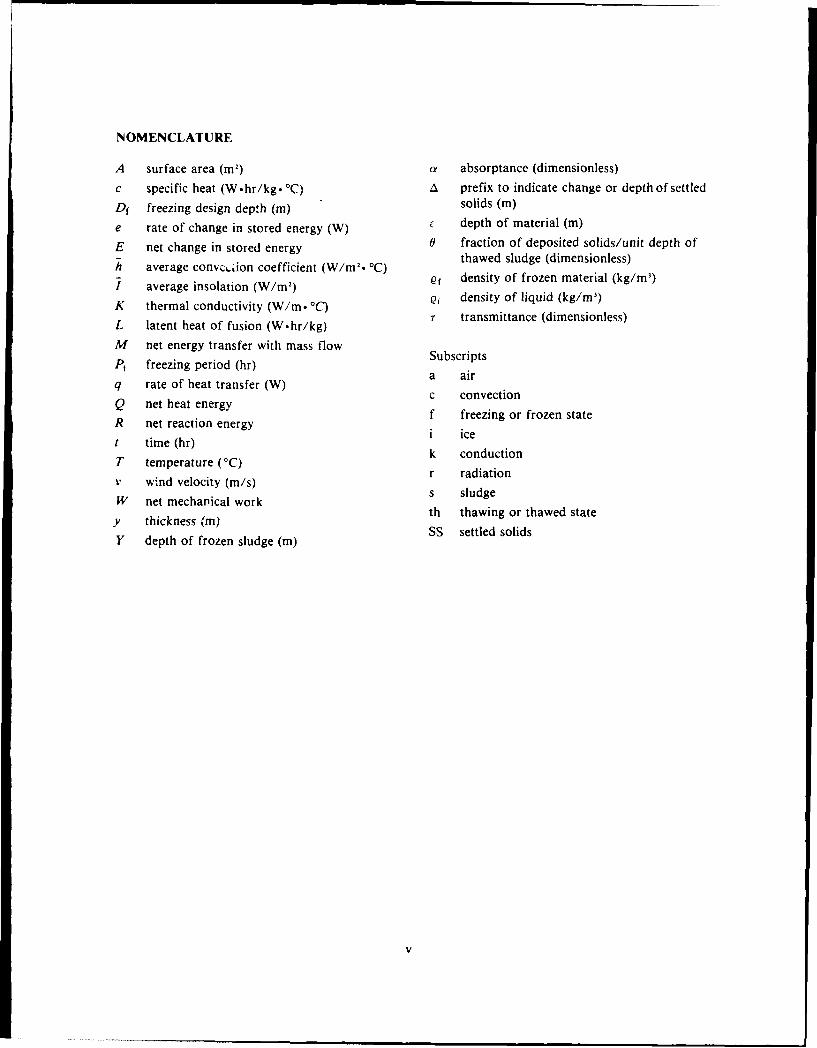
NOMENCLATURE
A surface area (m) a absorptance (dimensionless)
C specific heat (W.hr/kg. °C) , prefix to indicate change or depth of settled
Df freezing design depth (m) solids (m)
e rate of change in stored energy (W) f depth of material (m)
E net change in stored energy 0 fraction of deposited solids/unit depth ofSaverage convc,,ion coefficient (Wim2 . C) thawed sludge (dimensionless)
I average insolation (W/m 2 ) Q1 density of frozen material (kg/m3)K thermal conductivity (W/m. 'Q Q density of liquid (kg/mn)L latent heat of fusion (W.hr/kg) r transmittance (dimensionless)M net energy transfer with mass flowPt freezing period (hr) Subscriptsa airq rate of heat transfer (W) c convectionQ net heat energy f freezing or frozen stateR net reaction energy i icet time (hr) k conductionT temperature (0C) r radiationV wind velocity (m/s) s sludgeW net mechanical workW thne mecha l wth thawing or thawed state
ySS settled solids
Y depth of frozen sludge (m)
........................ .. . . ... . - m ~ m tam mm V

Development and Design of Sludge Freezing Beds
C. JAMES MARTEL
INTRODUCTION
BackgroundSludge management continues to be a major problem at both water and wastewater treat-
ment facilities. Although the volume of sludge produced is only a small fraction of the totalvolume of water or wastewater treated, it consumes over 50%V0 of the operation and main-tenance budget. Also, the sludge management problem is expected to increase as the numberof higher level treatment processes increases. A recent report by the Water Pollution ControlFederation (1982) identifies sludge treatment and disposal as one of the most pressing re-search needs of this decade.
One of the main problems in sludge management is dewatering. Typically, sludges result-ing from wastewater treatment processes contain only 0.25 to 12% solids (Metcalf and Eddy1979). Water treatment sludges may contain as little as 0.1%To solids before thickening andperhaps 2.50o after thickening (Fair et al. 1968). In most cases, direct disposal of these dilutesludges is unacceptable because of the cost of transportation. Also, the liquid in the sludgecould pollute surface or groundwaters. Therefore, some method of dewatering is usually re-quired before disposal. Commonly used methods include filter presses, horizontal beltfilters, centrifugation, drying beds and lagoons.
For facilities located in cold regions, selection of an effective dewatering method can beespecially difficult. Because of the remoteness of many northern communities, parts andequipment are not easily obtainable. Also, mobt communities are small and skilled operatorpeisonnel are scarce or not available. Therefore, ,.omplex mechanical dewatering methodsare often undesirable. Simpler methods such as drying beds and lagoons can be used but theyare inefficient in cold regions because of the shortness of the drying season. In addition,large storage facilities are often required to contain the sludge during the cold and wet winterand spring months.
A more efficient method of dewatering sludges in cold regions is to use naturalfreeze-thaw. Freeze-thaw is more effective than chemical conditioning for impioving sludgedewaterability (Metcalf and Eddy 1979). Some northern plants are already using naturalfreeze-thaw in their existing lagoons or drying beds. However, these operations were designedto dry sludge and thus are not able to take full advantage of freeze-thaw. To optimize thenatural freeze-thaw process, a specially designed unit operation is necessary.
PurposeThe purpose of this study was to develop design criteria for a new unit operation called a
sludge freezing bed. The main criterion needed for design is the depth of sludge that can befrozen and thawed naturally at a proposed site. Knowing this value and the volume of sludgegenerated, one can determine the size or area of the bed.
ScopeThe initial objective of this study was to develop a sludge freezing bed concept. This was
accomplished by reviewing previous work and visiting three plants with sludge freezingoperations.
Several tests were conducted to assess the dewaterability of freeze-thaw conditionedsluages. Dewaterability was measured using specific resistance and capillary suction timetests. The limiting depth for drainage and drying was evaluated in large-scale column studies.Four depths ranging from 30 to 220 cm were tested. Three types of stabilized sludges wereused in these tests: a water treatment sludge, an anaerobically digested wastewater sludgeand an aerobically digested wastewater sludge. Dewaterability tests were also conducted withthese sludges in the unfrozen state.
Mathematical models were developed to predict the design depth based on the naturalfreezing and thawing energy available at a proposed site. The input parameters to thesemodels were determined from the literature or experimentation. These models were validatedusing data from other sludge freezing operations.
LITERATURE REVIEW
There is a large body of literature on sludge dewatering by freezing. In addition, there is asignificant amount of associated literature on freeze separation of dilute solutions such asseawater. Also, freezing is being considered for isolating and concentrating hazardouswastes. Therefore, the scope of this review was broadened to include these areas.
Two other thorough reviews of this topic have been conducted. One is contained in aPh.D. thesis by Logston (1971) and the other is in a report for the U.S. Department of theInterior, Office of Water Resources Research (Tilsworth 1972).
Fundamentals of freeze separationAs explained by Glen (1974), ice is a solid that consists of a crystallographic arrangement
of water molecules. These water molecules are bonded together by the positive charge con-centrations of one molecule in contact with the negatively charged concentration of another.This purely electrostatic attraction between charge concentrations is very strong and plays amajor role in determining the mechanical strength of ice.
Because of the highly organized structure of ice, it cannot accommodate other atoms ormolecules without severe local strain. As explained by Chalmers (1959), an ice crystal growsby adding water molecules to its structure, as bricks are added to a wall. If a growing crystalcomes in contact with other atoms or impurities, it rejects them in favor of water molecules.This process continues until the accumulation of rejected impurities restricts water flow tothe crystal.
Rejection of impurities by freezing often occurs in nature. A typical example is tX,. desalin-ation of sea ice. Initially, brine is concentrated between ice crystal boundaries. Over a periodof time, this brine drains out by gravity leaving relatively pure ice (Cox and Weeks 1975).Another example is the formation of pure ice from polluted waters. At the turn of the cen-tury, all of the ice consumed by the general public was gathered from lakes and ponds duringthe winter and stored in ice-houses. Sedgwick (1903) noted that very few epidemics could beattributed to infected ice. He concluded that under the quiescent conditions beneath the ice,bacteria and other foreign particles were eliminated by the growing ice front.
Several studies have been conducted to understand the critical factors affecting migrationof discrete particles from a planar, solidifying ice froat. Corte (1962) demonstrated that animportant factor in particle migration is its shape or contact area with the interface. Particles
2

with large contact areas were easier to displace. Freezing rate was also important. Fine parti-cles migra-oc under a wide range of freezing rates while coarse ones migrated only at lowrates of :eezing. All particles were found to migrate at freezing rates less than I mm/hr.
1., ann et al. (1964) found that each particle has a "critical velocity" below which the par-ticle is rejected by the ice front. Continuous rejection of a particle requires both a force pre-
venting incorporation of the particle into the ice and a constant supply of water immediatelybehind the center of the particle. Cisse and Boiling (1971) found that particles with a greaternumber of contact points were more easily rejected. They also developed a mathematicalmodel for predicting the interaction of particles with a solidifying front (Boiling and Cisse1971). The critical trapping velocities of several particles in solutions of naphthalene, cam-phor, salol and benzophenone were investigated by Kuo and Wilcox (1973). They found thatseparation was improved by mixing the freezing solution in a horizontal zone refiner, whichessentially is a tube rotated about its horizontal axis. Halde (1979) conducted a comprehen-sive study of the interaction between ice and particles of various sizes. Contrary to Corte
(1962), he found that large particles or molecules were more easily separated than smallerones. Also, vigorous stirring was necessary to maintain particle migration at high freezingrates. Solutions containing higher solids concentrations were more difficult to separate.
When sludge is allowed to freeze naturally, most of the solids are not rejected along aplanar front. Instead, the solids become trapped within the frozen sludge (see the Resultssubsection of the Drainage Tests section). However, the same mechanism of particle rejec-tion is thought to occur, except that the plane of rejection is along singular or multiple crys-
tal boundaries.Although solids separation occurs during ice crystal formation, there is a question as to
whether the intercrystalline solids are coagulated by compression or dehydration. Studies byVol'khin and Ponomarev (965) and Logston (1971) conclude that dehydration is responsi-
ble. This conclusion is consistent with the theory of ice lens formation in soils. However,Halde (1979) reasoned that solids are coagulated by the compressive forces of expanding ice.Katz and Mason (1970) concluded that the conditioning effect produced by freezing is a re-sult of both dehydration and pressure exerted on the sludge particles by the ice structure.
Final separation of solids only occurs when the sludge is allowed to thaw and drain.
Ezekwo et al. (1980) found that the structural integrity of the remaining solid matrix was animportant factor in determining drainability. According to Baskerville (1971) there is a de-
crease in the drainability of sludges (except for alum sludge) if they are stirred.
Applications of freeze separation technologyPerhaps the most familiar application of freeze separation can be found in the food pro-
cessing industry. Freeze-drying is used to make instant coffee and to preserve foods. It is also
used to preserve biological specimens. In the freeze-drying process, the material is frozen andthe ice crystals are removed by sublimation in a vacuum (Mellor 1978). Because of the energyrequired, this process is not economically feasible for dewatering large volumes of waste-water and water treatment sludges.
Another frequently mentioned use of freeze separation is desalination. This was the firstapplication of freeze separation to receive significant development funding (Heist 1979).Several large pilot plants were built but none are in full-scale operation.
In the area of waste treatment, freeze sepe-ztion technology has been tried on many typesof waste and in many different ways. Generally, however, the reasons for applying this tech-nology are I) to separate solutes, 2) to dewater sludges, and 3) to concentrate hazardouswastes. Therefore, this review was organized according to these applications.
3

Separation of souhtes
The literature contains several references pertaining to separation of solutes by the freezecrystallization process. This is a direct contact process where a refrigerant is bubbled througha reactor containing the solution to be purified. The refrigerant extracts heat from the solu-tion and causes the formation of a slurry containing ice crystals and concentrate. The icecrystals are then separated in a hydrocyclone or gravity screening device, washed and meltedto produce a relatively pure product water. Electroplating wastes, cooling-tower blowdown,pulp-mill bleach streams, and various organic and inorganic effluents from chemical plantshave been successfully treated using this process (lammartino 1975).
Barduhn (1963) and Rose and Sweeney (1963) investigated the feasibility of using thefreeze crystallization technique to purify municipal wastewaters. In pilot-scale studies, 900removal of impurities was achieved by this process. Further tests were recommended to im-prove the process and reduce costs.
Campbell and Emmerman (1972) evaluated the freeze crystallization process for concen-trating plating rinsewater. Greater than 90°7o removals of nickel, cadmium, chromium, zincand sodium chloride were achieved in a 9460-L/day pilot plant. The capacity and operatingcosts were considered to be primarily a function of total flow and, to a limited extent, the ini-tial waste concentration in the feed stream.
Researchers at the Applied Science Laboratories, Inc. (1971) tried five different methods,including freeze crystallization and natural freezing, to purify acid mine water. They selecteda freezing technique that involves the tormation of an ice layer on the submerged surface of abayonet-type heat exchanger. When the ice layer was sufficiently thick, the exchanger was re-moved and the ice discharged. Bench-scale results indicated an 85 to 9076 reduction in vari-ous metals and acid components using this technique.
A laboratory technique for separating trace organics from aqueous solutions was evaluat-ed by Baker (1967). The advantage of this technique over thermal or solvent extraction isthat volatile or reactive compounds are not destroyed. Experimental results indicated thatlow concentrations of various organics could be effectively concentrated in the absence ofdissolved inorganic salts.
Dewatering of sludgesThe improved dewaterability of sludges after freeze-thaw has been recognized for several
decades. One of the earliest cited reports is that of Babbitt (1931), who noted that activatedsludges left on drying beds over the winter drained ajid dried very quickly after thawing.Since then, there have been several studies to evaluate the potential of sludge freezing as a de-watering process.
Pioneering work on sludge freezing was conducted by Clements et al. (1950). Their moresignificant findings include:
1. The dewmterability of all sewage sludges was improved by freeze-thaw.2. Complete freezing was essential but the freezing rate must be fairly slow. "Flash"
freezing was ineffective.3. The method of thawing was unimportant as long as it was not accompanied by vigorous
stirring.4. The quality of the supernatant was similar to that of raw sewage. Also, they developed
a freezing machine and conducted tests using digested and activated sludges with andwithout coagulating chemicals in varying concentrations.
Several references can be found concerning attempts to build a mechanical freezing andthawing device. Doe et al. (1965) proposed a process scheme consisting of 1) gravity thicken-ing with slow picket stirring, 2) storage and decanting for at least 16 hours, and 3) freezingand thawing in a specially designed tank. However, the cost of this process was high because
4

of the energy requirements and the capital, operation and maintenance costs of the freezingtank (Benn and Doe 1969). Studies by Cheng et al. (1970) indicated that mechanical freezingcan be made more economical by a film freezing technique. This technique was tried by theSewerage Commission of the City of Milwaukee (1971) but the production rates were still notsufficient to compete with other mechanical dewatering processes. In a state-of-the-art re-view of sludge freezing, Farrell (1971) concluded that mechanical freeze-thaw is greatly lim-ited by the need to freeze slowly.
Instead of freezing the sludge within a tank or on a surface, Randall et al. (1975) and Ran-dall (1978) proposed the use of freeze cyrstallization. This is the same process that has beentried for separation of solutes (see the Separation of Solutes section). Randall concluded thatthis method results in better conditioning and better supernatant quality than does solidfreezing. Also, he concluded that the cost of this process would be competitive with other de-watering processes.
Honda et al. (1981) successfully operated a pilot-scale freeze-thaw device for two years.This device was essentially a shell-tube heat exchanger that was separated into two compart-ments: a front part for freezing and a rear part for thawing. Sludge was forced into the tubesat the freezing end and thawed at the other end. Reportedly, this device operated auto-matically and proved to be reliable.
Natural freezing in lagoons or drying beds has been proposed and studied by several inves-tigators (Bishop and Fulton 1968, Medding 1969, Farrell et al. 1970, Bishop 1971, Logstonand Edgerly 1971, Mahoney and Duensing 1972, Tilsworth 1972, Rush and Stickney 1979,Reed et al. 1985). These investigators found similar results in that natural freeze-thaw waseffective on all types of sludges. Typically, the solids content after drainage was greater than2007o. A snow cover was considered undesirable because it reduced freezing and thawingrates.
The literature contains several reports of actual sludge freezing operations on drying bedsand lagoons. Fulton (1970) described plans to build a special sludge freezing basin for theAuburn, New York, Water Tieatment Plant. Sludge freezing was successfully demonstratedat several small sewage treatment plants in Finland (Puolanne 1980). Sludge was dewateredfrom 4.6 to 25-36076 solids by freezing on a drying bed with a peat filter bottom. Canfieldand Sutphen (1982) reported on a sludge freezing operation at the Lake Ontario TreatmentPlant near Oswego, New York. Sludge from the dentention lagoon was pumped to severalshallow basins at a depth of about 30 cm. The sludge was then allowed to freeze over the win-ter. Results from the first year of operation indicated that the solids content was increasedfrom 8% to greater than 2507o. Sludge from the basins was easily removed with standardearth-moving equipment. Johnson and Doe (1983) concluded that the freeze-thaw methodof sludge treatment is working well at the Trap Falls Water Treatment Plant in Sheldon,Connecticut. Frozen in lagoons, the solids content approached 900/6 in dry weather and hadthe consistency of coffee grounds. Schleppenbach (1984) reported on a successful sludgefreezing operation at the Duluth, Minnesota, water treatment plant. Layers of sludge werefrozen by cutting holes in the ice and pumping sludge from the bottom of the lagoon to thesurface. Morin et al. (1986) conducted pilot-scale tests with sludge from the Dominion Tex-tile, Inc., plant in Magog, Quebec, Canada, during the winter of 1983-84. Sludge was ap-plied in 2- to 5-cm layers on two pilot-scale lagoons at depths of 1.2 and 0.75 m. They con-cluded that the maximum allowable solids loading was about 9 kg/m.
Chamberlain and Blouin (1978) conducted studies on the densification of dredged materi-als by freeze-thaw. They found that freezing and thawing increased the vertical permeabilityby as much as two orders of magnitude. A natural freezing scheme was proposed in whi.h se-quential layers of dredged material would be frozen during the winter months.
5

Concentration of hazardous wastesIskandar (1986) proposed the use of freeze separation to concentrate hazardous wastes in
uncontrolled disposal sites. The initial step is to contain the contaminated site by surround-ing it with a wall of frozen soil. This wall is created by boring holes around the site to thedepth of the underlying confining layer. Pipes are then installed in the holes and connected
to artificial refrigeration equipment. The soil between the pipes is rapidly frozen, creating animpermeable wall around the site. Concentration of the hazardous wastes is achieved by pro-
gressively freezing inward. The concentrated wastes are removed by pumping. The efficiencyof the process is currently under investigation.
Conclusions
Based on this review it was concluded that:I. The basic mechanism of freeze separation by crystal formation is well understood.
However, there is some controversy as to whether sludges are dewatered by compression, de-
hydration or both.2. Although freezing by mechanical means such as freeze crystallization has proven to be
effective, it is still not cost-competitive with other mechanical or natural dewatering pro-cesses.
3. Sludge dewatering by natural freeze-thaw has been successfully demonstrated at a num-
ber of water and wastewater treatment plants. However, sludge freezing was not designed in-to these plants. Instead, each operation is a site-specific modification to an existing lagoon or
drying bed. To effectively use this process, a specially designed unit operation is necessary.
CONCEPT DEVELOPMENT
Background
A specially designed unit operation utilizing natural freeze-thaw for sludge dewatering has
been proposed by several investigators. Bishop and Fulton (1968) suggested a system with atleast two lagoons: one for settling and storing the sludge and another for freezing it in thewinter months. The storage lagoon would have a capacity equal to the annual sludge produc-
tion rate. The freezing lagoon would be sized such that, when decanted before winter, thetotal remaining depth of sludge would freeze completely.
Farrell et al. (1970) proposed a similar scheme except that the sludge would be frozen in
layers by periodically pumping it to a freezing pond. Snow cover would be controlled byplowing, by not pumping when snow is anticipated, or by pumping over the snow to melt it.
A method of calculating the depth of frozen sludge was developed based on modified freez-ing degree-days.
Tilsworth (1972) proposed a system with two lagoons, each designed to handle the entire
sludge volume wasted during the year. A sludge depth of 30 cm was selected for application.From April through May, the first lagoon would receive all the sludge up to a depth of 30 cm
or less. It would then be allowed to dry in the summer and be removed in the fall. Mean-while, sludge generated over the summer months would be discharged into the second lagoon
to a depth of 15 cm. Once the first lagoon is emptied, it would be refilled with sludge up to adepth of 30 cm over the winter months and allowed to freeze. The remaining capacity in the
second lagoon (15 cm) would be used during the spring thaw and drying period.Rush and Stickney (1979) envisaged a combination drying bed-Aludge lagoon consisting of
a sand bed with underdrains located in the bottom of a I- to 3-m-deep lagoon. Several of
these lagoons would be necessary. During the summer some lagoons would be used as con-
ventional drying beds. This sludge would remain in the lagoon during the winter until it was
6

frozen. It would then be removed with large "rototiller" type equipment like that used atWinnipeg, Manitoba (Penman and Van Es 1973). In the winter, sludge would be applied inlayers to other lagoons and allowed to freeze. After thawing and drainage this sludge wouldbe removed for final disposal to farmland. Snow cover would be removed or melted withfresh sludge or plant effluent.
Prototype freezing beds were designed and built at three small biological-chemical waste-water treatment plants in Sweden (Hernebring and Lagesson 1986). Each freezing bed wasslightly different in design to accommodate site-specific needs. At one installation the bedwas divided into two parts: one part was used as a freezing bed and another part was used asa drying bed. Sludge was pumped onto the bed in layers of 5, 10 and 20 cm. The smallamounts of snow that fell during the test were removed by applying a layer of sludge to meltthe snow. Mechanical removal was planned to handle greater depths of snow.
Site visitsTo learn more about the present state of the art, three water treatment plant- that claim to
use natural freeze-thaw to dewater their sludge were visited. The following is an account ofthese visits.
Swanton Village, Vermont
Completed in 1979, the Swanton Vil:age Water Treatment Facility was designed to treat3800 m/day. Present flow is approximately 1900 m'/day. Treatment processes includechemical coagulation (where alum is added), sedimentation (tube settlers) and filtration(dual media filters). Sludge from the settling compartments and backwash from the filters ispumped to one of two lagoons. Each lagoon is 36 m long by 21 m wide by 1.2 m deep.
According to the facility's O&M manual, sludge freezing can be accomplished by drainingout as much supernatant as possible during the fall and allowing the remaining sludge tofreeze over the winter. After trying this procedure for two years, the operator found little re-duction in sludge depth and the expected granular consistency was never achieved.
A small study was initiated to see if the sludge froze completely when the lagoon was oper-ated according to manual instructions. With the cooperation and assistance of F. Mastriani,Superintendent, one of the lagoons was drained of all supernatant and allowed to freeze overthe winter of 1982-83. The initial depth ofsludge in the lagoon was 96 cm.
On three separate occasions during the win-ter (9 December 1982, 25 January 1983 and 7March 1983), ice cores and sludge sampleswere taken in each quadrant of the lagoon. Anaverage depth profile of the lagoon observed 6_l
on each of these dates is shown in Figure 1.This profile indicates that the lagoon never 0completely froze to the bottom. The maxi-
mum ice thickness observed was 29 cm on 7 XMarch 1983. This thickness is probably less 20- A al sude _
than the average because the winter of 1982- - 04 Suematce• Clear Ice -
83 was warmer than normal. However, it is snow
doubtful that the lagoon would ever freeze 9Dec 82 25Jon83 7Mor 83
completely. Even during the coldest winters, Figure 1. Depth profile of lagoon atGow and Govoni (1983) reported that the Swanton Village, Vermont, water treat-maximum ice thickness on Post Pond in ment plant during the winter ofLyme, New Hampshire, which has approxi- 1982-83.
7

mately the same number of freezing degree-days, should range between 40 and 70 cm. There-fore, it is unlikely that the lagoon would ever freeze to the bottom unless the initial depth waslowered considerably.
It is interesting to note that all ice cores were very clear and did not contain sludge parti-cles. This is evidence of the separation process that occurs as the ice front moved downward.This separation caused the solids content beneath the ice to increase from 2.07 to 2.550o be-tween 9 December 1982 and 7 March 1983. The lower solids content observed on 7 March1983 was probably a result of a previous heavy rainstorm, which washed much of the solidsout of the lagoon.
Oswego, New YorkThe Lake Ontario Filtration Plant, located near Oswego, New York, was visited on 15
March 1983. It has a design capacity of 136,300 m/day and was designed as a conventionalflocculation-settling-filtration plant with upflow clarifiers and dual media filters. However,the plant was converted to a direct filtration system in 1981 to comply with state limitationson discharge of suspended solids into Lake Ontario. These filters are cleaned by "backwash-ing," which produces large volumes of wastewater with low solids concentration. This back-wash water is pumped into two detention lagoons that allow the solid particles to settle out.The supernatant is then discharged into Lake Ontario where it must meet a permit standardof 20.0 mg/L suspended solids.
According to C. Canfield, Plant Manager, sludge freezing has been used since the winterof 1977-78. In the fall, sludge from the bottom of the detention lagoons is pumped to un-lined earthen basins called freeze-thawing beds. These beds are filled to a depth of 30 to 45cm and allowed to freeze over the winter. At this depth the sludge freezes completely, evenunder a snow cover. In the spring, the beds are allowed to thaw naturally and the remainingwater evaporates or percolates into the ground. By July or August the sludge has dried to 25to 3007o solids and has characteristics ranging from powdery and clay-like to granular andsand-like. Finally, the sludge is removed with standard earth-moving equipment and truckedto a nearby containment area.
Duluth, MinnesotaThe Lakewood Water Treatment Plant in Duluth, Minnesota, which draws water from
Lake Superior, has an average design flow of 113,500 m3/day. The treatment processes in-clude screening, chemical coagulation with alum and polymers, and multi-media filtration.Backwash from the filters is pumped to a clarifier, which concentrates the sludge and sendsthe clarified supernatant back through the treatment processes. The clarifier underflow ispumped to three lagoons where further sedimentation occurs and the supernatant is returnedto the plant.
During a visit to the plant on 17 March 1983, F. Schleppenbach, Manager of the Waterand Gas Division, stated that the sludge-freezing operation has been working for five years.Because of the effectiveness of this operation in reducing sludge volume, the lagoons havenot needed emptying during this period. This is fortunate because the sludge contains asbes-tos fibers that could make ultimate disposal difficult.
Duluth uses the freezing process by draining all supernatant from two of three lagoons andallowing them to freeze over. When the ice is thick enough to support men and equipment(about 10 cm), holes are bored into the ice and the sludge is pumped onto the ice where itfreezes. After the sludge layer is completely frozen, another layer is pumped to the surface.This operation continues all winter until the lagoon is empty or the freezing season is over.Sludge generated during winter is frozen by spraying it into the third lagoon. Spraying wasfound to be necessary to evenly distribute the sludge. Snow is removed with a snowblower.
8
Final conceptBased on ideas obtained from the literature and the site visits, it was concluded that the es-
sential design features of a freezing bed were as follows:1. It should be designed so that sludge is applied in several thin layers rather than a single,
thick layer. Each layer should be applied as soon as the previous layer has frozen. This willincrease the freezing rate and maximize the total depth of sludge that can be processed.
2. The bed should be covered to prevent snow from accumulating on the surface. This fea-ture is critical if the unit is to operate as designed. An open freezing bed would be difficult todesign because of the unpredictability of snow removal operations. Also, snow removalwould be practically impossible if there was a large snowfall soon after sludge was applied.In this case the operator would have to delay snow removal until the frozen sludge was thickenough to support snow removal equipment. This could take several days, depending on thedepth of snow.
3. The sides of the bed should be left open to allow free air circulation. However, a half-wall or louvered wall may be necessary to control drifting snow.
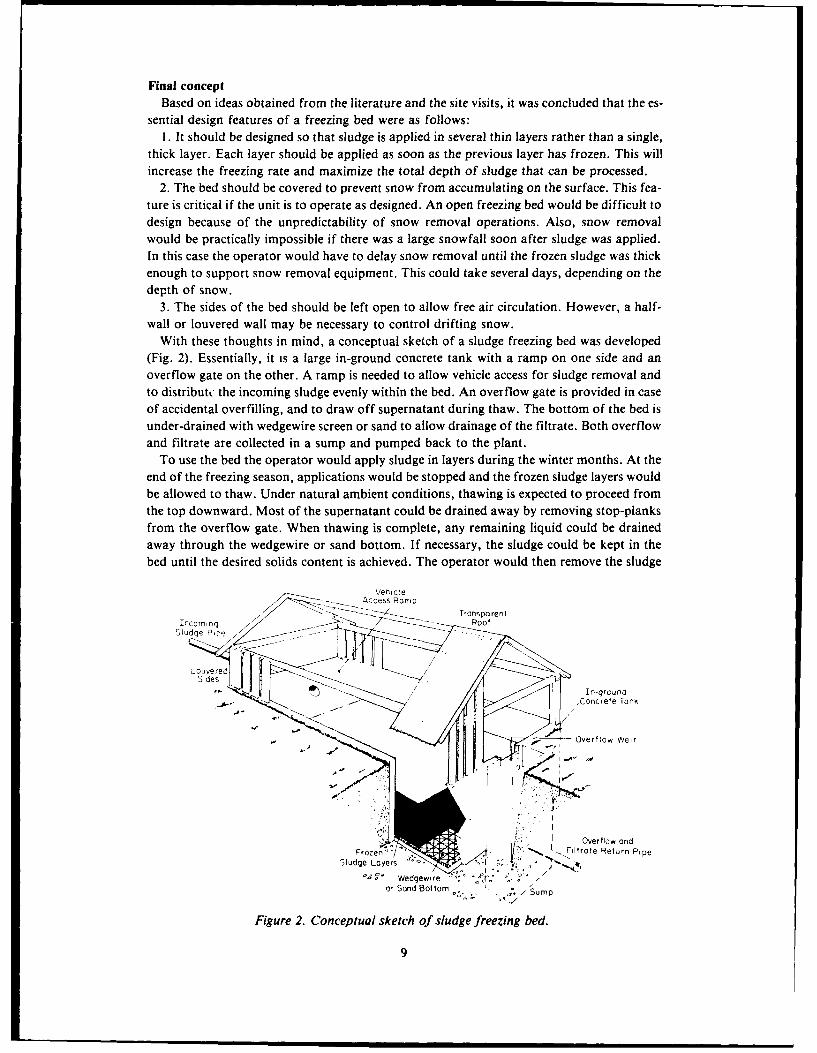
With these thoughts in mind, a conceptual sketch of a sludge freezing bed was developed(Fig. 2). Essentially, it is a large in-ground concrete tank with a ramp on one side and anoverflow gate on the other. A ramp is needed to allow vehicle access for sludge removal andto distributt: the incoming sludge evenly within the bed. An overflow gate is provided in caseof accidental overfilling, and to draw off supernatant during thaw. The bottom of the bed isunder-drained with wedgewire screen or sand to allow drainage of the filtrate. Both overflowand filtrate are collected in a sump and pumped back to the plant.
To use the bed the operator would apply sludge in layers during the winter months. At theend of the freezing season, applications would be stopped and the frozen sludge layers wouldbe allowed to thaw. Under natural ambient conditions, thawing is expected to proceed fromthe top downward. Most of the supernatant could be drained away by removing stop-planksfrom the overflow gate. When thawing is complete, any remaining liquid could be drainedaway through the wedgewire or sand bottom. If necessary, the sludge could be kept in thebed until the desired solids content is achieved. The operator would then remove the sludge
Veh c!eAccess Romp
-'/ T-o _ Transporent
Incoming RoofSiudge Pipe
L ouveredSdes /
• " /In-ground.-. '" Concrete Tank
"" ---. "-------Overflow weir
Overflow andFe ' " ,- Filtrate Return Pipe
Sludge Layers 4
Wedgewire % . "
or Sand Bottom . Sump
Figure 2. Conceptual sketch of sludge freezing bed.
9

Effluent
influent Wastewate Sludge Stabizaion/ Freezing DisposalTreatment St o d of dBe derin
Supern-,tont and Filtrate Return
a. Freezing bed as sole method of dewatering.
f fluentogh re
beds.
Inftuent Wastewoter Sde f sufiintrmTreatment
Ulcmate
Ascoceve, sude reezing be9ol1eue sasl eto fdwtrn Fg a
Supernatant andl Filtrate R~eturn
b. Freezing bed in combination with drying bed.
Figure 3. Process flowsheets for sludge dewatering with freezingbeds.
with a front-end loader or other device. If sufficient warm weather remains, the operatorcould continue sludge dewatering by using the freezing bed as a drying bed.
As conceived, a sludge freezing bed could be used as a sole method of dewatering (Fig. 3a)or in combination with other methods such as drying beds (Fig. 3b). If used as the only meth-od of dewatering, a storage facility will be necessary to contain the sludge during the summer
months. This storage facility could be a lagoon, tank or even a digester if excess capacity wasavailable. When used in combination with other methods, it would be designed to handle thewinter sludge production only. A freezing and drying bed combination is particularly attrac-tive because both dewatering operations are conducted under naturally optimum conditions.
To maximize the depth of sludge in the bed, each layer should be applied as soon as theprevious layer has frozen. This could be difficult to accomplish unless the plant is manned 24hours per day, 7 days per week. Instead, it may be possible to automate the bed using a ther-mostatic controller. The controller could begin pumping of a new layer once a preset numberof degree-hours or -days had elapsed. A model for predicting the time needed to freeze alayer of specified thickness can be found in the Development of Design Models section.
The relative cost of dewatering sludge by this method is expected to be significantly lessthan mechanical systems because minimal energy is needed. Also, there is no need for chemi-cal conditioning. Compared to drying beds, the construction costs should be similar becausethey are similarly constructed. However, the O&M costs of a freezing bed should be less be-cause sludge would normally be removed only once per year and with the aid of mechanicalequipment.
10

DEWATERABILITY STUDIES
The size of a freezing bed will depend on the volume of sludge generated by the plant and
the depth of sludge that can be applied. The sludge volume can be estimated based on waste-water characteristics and flow, but the depth of sludge is unknown. Past experience is con-fined to drying beds, which normally receive only 30 to 40 cm of sludge per application. Po-tentially, the freezing bed could receive several times this depth over the winter. The questionthen arises as to whether this sludge will drain and dry adequately even after freeze-thaw. To
answer this question, a series of dewaterability studies were conducted. Three commonsludges were selected for evaluation: a water treatment sludge, an anaerobically digestedwastewater sludge and an aerobically digested wastewater sludge.
Sludge characteristicsThe water treatment sludge was obtained from the Lebanon, New Hampshire, Water Treat-
ment Plant. This plant has a design flow of 15,140 m 3/day. Treatment processes includerapid mixing with potassium permanganate and alum addition, pH control with soda ash,flocculation, sedimentation, rapid sand filtration and chlorination. Sludge is dewatered by
evaporation and filtration in a shallow, gravel-bottomed basin.The anaerobically digested sludge was collected at the Hanover, New Hampshire, Waste-
water Treatment Plant, which has a design flow of 5700 m 3/day. Primary treatment only isprovided and the sludge is stabilized in an anaerobic digester. Sludge from the digester is pe-
riodically withdrawn and dewatered on drying beds.
Aerobically digested sludge was obtained
from the Woodstock, Vermont, WastewaterTreatment Plant. Present flow at the plant is Table 1. Initial physical characteristics of
approximately 1700 ml/day and treatment is sludges.
achieved using the contact stabilization pro- Total Volatilecess. Waste-activated sludge is aerobically Sludge solids solids Specificdigested for approximately 10 days and then type (%) (%) gravity
spread on land in the summer.The initial physical characteristics of each Water treatment 0.9 52 1.005
Anaerobic 8.7 48 1.006sludge are shown in Table 1. fhese charac- Aerobic 1.5 77 1.005teristics are typical of each type. All analyseswere performed in accordance with Standard
Methods, 15th Ed. (APHA 1980).
Specific resistance and capillary suction timeSpecific resistance and capillary suction time tests were conducted on all three sludges, be-
fore and after freeze-thaw conditioning. The freeze-thaw conditioned sludge samples werefrozen at -10'C for seven days.
Specific resistance tests were conducted using the procedure developed by Adrian et al.(1968). The best results were obtained using a Whatman No. 5 paper for the water treatmentand aerobically digested sludges, and Whatman No. 1 paper for the anaerobic sludge. Afterfreezing, the solids had a tendency to separate from the liquids and settled to the bottom ofthe Buchner funnel. This made it difficult to take a representative sludge sample. To avoidthis problem the solids content (after drainage) was determined by dividing the total mass ofcake solids by the volume of filtrate generated at the end of the test, as suggested by Chris-tensen and Dick (1985).
The results of the specific resistance tests before and after freeze-thaw are shown in Table2. The specific resistance of water treatment sludge decreased slightly after freeze-thaw,
11

Table 2. Dewaterability of sludge before and after freeze-thaw.
Specific Coefficient of Capillaryresistance compressibility suction time
(s'/g @38.1 cm Hg) (dimensionless) (s)Sludge type Before After Before After Before After
Water treatment 4.8 x 10' 6.0 x 10' 1.53 2.79 32 6Anaerobic 1.5 x 10' 1.7 x 10' 0.69 0.74 212 57Aerobic 2.1 x10' 1.3 x10' 0.14 1.18 37 11
whereas it increased for both wastewater sludges. An increase in specific resistance indicates
a degradation in dewaterability, which is contrary to observed results. However, this anoma-ly is not unusual with freeze-thaw conditioned sludges. Rush and Stickney (1979) obtained
similar results. In Adrian and Nebiker (1969), Roule concluded that specific resistance maynot be a valid dewaterability parameter for freeze-thaw conditioned sludges because of the
rapid separation of solids from liquids. Apparently, these solids clog the filter paper when avacuum is applied causing a high specific resistance measurement.
As shown in Table 2, the coefficients of compressibility for all three sludges increased as aresult of freeze-thaw. This implies that the sludge will be easily compressed, and dewateringwill be more difficult. Again, these results contradict the fact that freeze-thaw improves de-waterability. However, each coefficient was determined from a specific resistance test,which, as mentioned earlier, is an inappropriate test for freeze-thaw ,,nditloned sludges.
Therefore, the coefficients of compressibility, which were determined from this test, are
meaningless.
Capillary suction time (CST) is a more recently developed measure of sludge dewaterabili-ty (Baskerville and Gale 1968). It is the time taken by a constant volume of filtrate, acting
under the influence of capillary suction pressure, to saturate a piece of filter paper. The rateat which the paper becomes wetted is an indication of the filterability of the sludge. Thelower the CST, the better the filterability of the sludge.
CST values for each sludge were measured using the Komline-Sanderson Capillary SuctionTimer (Fig. 4). Five tests were conducted on each sludge to determine an average value.
Based on a statistical analysis of previous CST data, this value should be within ± 10% of
the true mean at the 950%6 confidence limit.
Figure 4. Komline-Sanderson Capillary Suction Time (CST) device.
12

Unlike the specific resistance tests, the CST tests showed a definite improvement in sludgedewaterability after freeze-thaw. For example, the water treatment sludge had a CST of 32seconds before freezing and only 7 seconds after freezing (see Table 2). Similar results wereobtained with the anaerobically and aerobically digested sludges. Rush and Stickney (1979)noted similar reductions in their study. Thus, for freeze-thaw conditioned sludges, the CSTtest appears to be a better indicator of relative dewaterability.
Filtrate qualityTo determine the effect of freezing on filtrate quality, the filtrate obtained during the spe-
cific resistance tests was analyzed for 5-day Biochemical Oxygen Demand (BOD), Chemical
Oxygen Demand (COD), turbidity and pH. All analyses were conducted according to Stan-dard Methods, 15th Ed. (APHA 1980).
Examination of these data (see Table 3) indicates that freeze-thaw reduces the quality ofthe filtrate. Turbidity, BOD and COD concentrations were all higher in the filtrate from thefreeze-thaw conditioned sludges. The reason for this decrease is not known but it may be therelease of interstitial waters that contain higher concentrations of dissolved materials thanthe surrounding free water. Similar results were obtianed by Rush and Stickney (1979), whoconcluded that BOD, COD, Total Organic Carbon (TOC) and total phosphorus concentra-tions in the filtrate were three to six times higher than those in raw sewage. However, theirmass balance calculations indicated that even during the most rapid spring thawing condi-tions, the hydraulic and organic loads to a plant would increase by less than 0.8 and 5.007o,resoectively.
Table 3. Filtrate quality before and after freezing.
BOD COD TurbiditySludge (mg/L) (mg/L) (NTU) pH
type Before After Before After Before After Before After
Water treatment - - - - 1.4 2.7 5.3 5.2Anaerobic 117 459 500 1064 58 72 8.2 7.8Aerobic 51 65 117 230 3.4 43 7.4 7.5
Drainage testsThe limiting depth for each sludge was evaluated by conducting a series of drainage tests at
four depths ranging from 30 to 220 cm. Both freeze-thaw conditioned and unfrozen sludgeswere used. The reason for testing unfrozen sludges was to provide a basis for comparison.All tests were conducted during the spring and summer of 1985 in CRREL's greenhouse.
Materials and methodsThe drainage tests were conducted in 15-cm-diameter clear cast acrylic columns. Each col-
umn was attached to a funnel-shaped base, which was machined from a solid piece ofacrylic. The filter media at the base of each column consisted of 15 cm of 20-30 Ottawa sand
underlain by I- to 3-cm-diameter support gravel. A sheet of black polypropylene geotextilewas used to separate the sand and the gravel. Another sheet of the same material was placedover the sand surface to provide a clean base for core sampling of sludge. To maintain anequal reference head, each column was connected to a constant head tank. A sketch of thesecomponents is shown in Figure 5.
Eight columns, one pair for each depth, were constructed. Each columr was graduated incentimeter increments from the bottom to the top. For easier observation of sludge depth,the columns were mounid on a white backboard. The columns were numbered sequentially
13

1 through 8 from tallest to shortest.Th ,.dd-numbered column of each
pair received unfrozen sludge whilethe even-numbered column received
an equal amount of frozen sludge.Photos of these columns are shown
in Figure 6.
Sludge could not be frozen insidethe columns because expansion forc-
es would cause them to fracture. Tocircumvent this problem sludge was
frozen in the form of individualcakes. Each cake contained 1400 to1700 mL of sludge and was sized to Figure 5. Column used in drainage and dryingfit snugly inside the column. These tests.
cakes were then stacked in the even-numbered columns. This technique
closely simulated the layered config-uration of a sludge freezing bed.
a. Columns 1, 2, 3, 4. b. Columns 5, 6, 7, 8.
Figure 6. Columns used in drainage tests.
14

S t.i , ' , ---- The sludge cakes were made by freezing
sludge in several trays made of expandedpolystyrene insulation. The insulation re-duced the freezing rate from the side andbottom, which more closely simulates natu-ral freezing from the top only. Five 15-cm-diameter by 15-cm-deep holes were drilledinto each tray using a specially fabricatedbit. The sides of the hole were tapered out-ward to promote easier extraction of thefrozen sludge cakes. The inside surfaces ofthe holes were waterproofed with a flexiblerubberized membrane, and a thin coatingof petroleum jelly was spread over themembrane to facilitate cake removal. A"sludge cake" and freezing tray are shown
in Figure 7.Drainage tests were initiated on the un-
Figure 7. Polystyrene tray used to freeze frozen sludge sotn after it was collectedsludge cakes. Five cakes were frozen in each and transported to CRREL. Upon arrival,tray. A sludge cake is visible in the foreground, the sludge was placed in a large container
111<
Figure 8. Pouring unfrozen sludge into col- Figure 9. Stacking sludge cakes in column 6.umn 3.
15
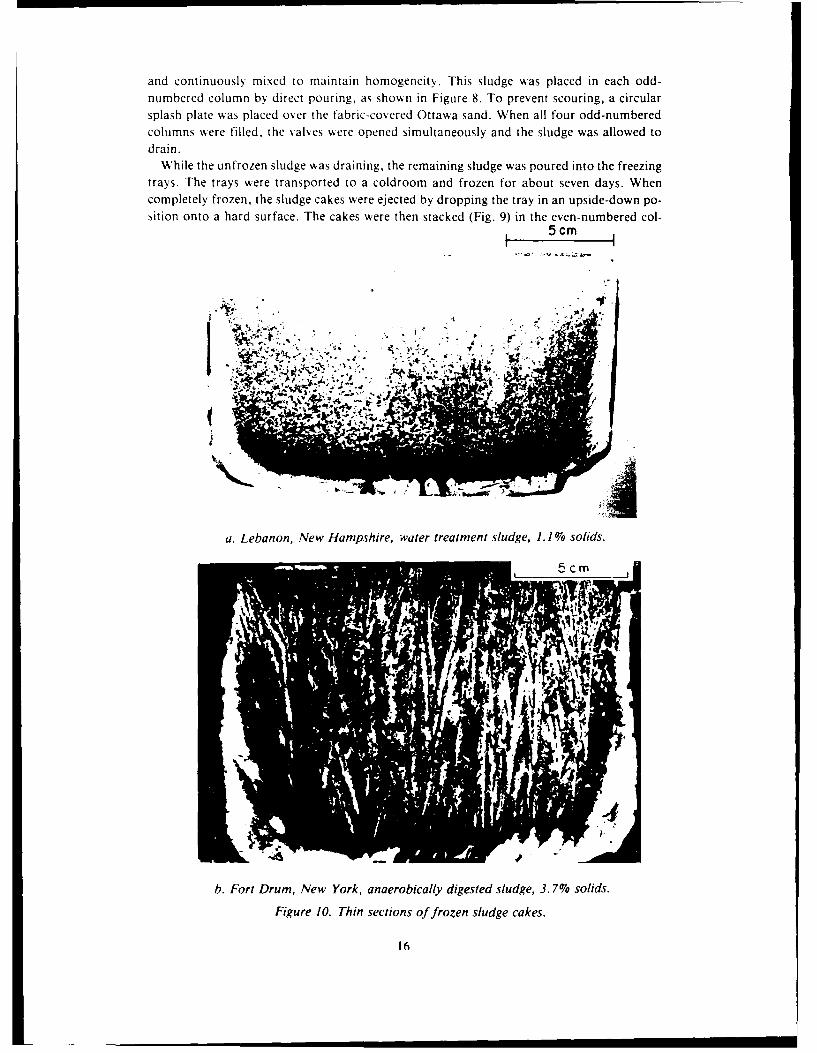
and continuously mixed to maintain homogeneity. This sludge was placed in each odd-numbered column by direct pouring, as shown in Figure 8. To prevent scouring, a circularsplash plate was placed over the fabric-covered Ottawa sand. When all four odd-numberedcolumns were filled, the valves were opened simultaneously and the sludge was allowed todrain.
While the unfrozen sludge Aas draining, the remaining sludge was poured into the freezingtrays. The trays were transported to a coldroom and frozen for about seven days. Whencompletely frozen, the sludge cakes were ejected by dropping the tray in an upside-down po-sition onto a hard surface. The cakes were then stacked (Fig. 9) in the even-numbered col-
7-7
5c
a. Lebanon, New Hampshire, water treatment sludge, 1. 1 solids.
5cm
b. Fort Drum, New York, anaerobically digested sludge, 3.7% solids.
Figure 1O. Thin sections of frozen sludge cakes.
16

umns to a depth equivalent (after allowing for expansion) to the sludge depth in the adjacentodd-numbered columns. The cakes were allowed to melt overnight before the drain valveswere opened.
As each column drained, sludge depths were recorded with time. Drainage was assumed tobe complete when the Ottawa sand no longer looked saturated.
ResultsPrior to conducting the drainage test, vertical thin sections were cut from selected sludge
cakes to observe the effect of freezing. Approximately 0.3 cm thick, each thin section wasmounted on a glass plate and placed on a light table in a coldroom. Photos of two thin sec-tions are shown in Figure 10.
Inspection of these photos reveals several transparent zones of relatively clear ice. Thezones of clear ice along the sides and bottom are an indication that the freezing rate was slowenough for solids to be rejected ahead of the advancing ice front. The freezing rate wasslower in these areas because of the insulation. At the top surface the sludge was in directcontact with the cold ambient air. In the case of the dilute Lebanon sludge (Fig. 10a), thefreezing rate was still slow enough to exclude most solids up to a depth of approximately 3cm. As the ice front advanced, more and more particles became trapped between ice crystalboundaries. The rejection of solids to ice crystal boundaries is clearly evident in the thin sec-tion of a Ft. Drum sludge (Fig. 10b). Whether the solids were rejected along a front or be-tween ice crvtal boundaries the effect was the same, i.e., a separation of solid and liquidfractions.
As the cakes in the columns thawed, large angular fragments were observed falling to thebottom where they accumulated to form a loose aggregate. Overlying the solids aggregatewas the relatively clear supernatant. When the drain valve was opened, the overlying super-natant rapidly permeated this aggregate although some consolidation was observed. In con-trast, the solid particles in the unfrozen sludge remained finely divided, forming an increas-ingly dense blanket that became relatively impermeable. These observations were common toall three sludges tested. Photos of a column containing freeze-thaw conditioned aerobicallydigested sludge before and after drainage are shown in Figure I1.
Data from the drainage tests on the water treatment sludge are plotted in Figure 12. Theunfrozen sludge drained very slowly, especially in columns I and 3, which were still drainingafter 21,000 minutes (14.6 days). In sharp contrast, drainage of the freeze-thaw conditionedsludge proceeded very quickly. For example, column 2, which contained 220 cm of freeze-thaw conditioned sludge, drained in only 6.5 minutes.
Drainage curves for the anaerobically digested sludge are shown in Figure 13. Again thecolumns containing the unfrozen sludge drained very slowly. Surprisingly, the sludge level inthese columns increased during the early part of the drainage period. This rise was caused byfloating sludge produced as a result of gas formation. This did not occur with the freeze-thawconditioned sludge, which drained very rapidly. For example, it took only III minutes todrain 2.0 m of freeze-thaw conditioned sludge vs 29,000 minutes (20 days) for the sameamount of unfrozen sludge.
As shown in Figure 14, similar results were observed during drainage tests on the aerobic-ally digested sludge. Columns containing the unfrozen sludge drained slowly and experi-enced the same rising sludge problem noted during the previous tests with anaerobically di-gested sludge. After 21,000 minutes (14.6 days), 2.0 m of unfrozen sludge was still draining,while the same depth of freeze-thaw conditioned sludge drained in only 18.5 minutes.
17

an I /
a. Before drainage. b. After drainage.
Figure 11. Freeze-thaw conditioned aerobically digested sludge before and after drainage.
DiscussionThe drainage tests clearly demonstrated the remarkable improvement in drainability at-
tributable to freeze-thaw. All columns containing the freeze-thaw conditioned sludgesdrained in minutes compared to days for the equivalent depth of unfrozen sludge. This hap-pened for all three sludges tested. Thus, it is reasonable to expect that up to 2.0 m of thesesludges could be applied to a freezing bed. Considering the rapid drainage of all sludges atthis depth, even greater depths may be possible.
An attempt was made to use a model developed by Nebiker et al. (1968), Sanders (1968)and Clark (1970) to predict drainage times. This attempt was not successful because themodel predicted much longer drainage times than were actually experienced. For example,the model predicted a drainage time of five days for 2.0 m of anaerobically digested sludgewhere the actual drainage time was only III minutes. Presumably, this lack of agreementwas ascribable to a physical change in sludge particle size caused by frecze-thaw. Instead of asuspension of finely divided particles, which the model assumes, the sludge was converted toa slurry of settleable particles in water.
Because of the short drainage times experienced with freeze-thaw conditioned sludgesthere is no practical need to develop a drainage model for design. Also, most of the watercould be removed from the freezing bed as supernatant rather than filtrate. In addition, if
18

25 'rr E '---
-- Column 2
6
D 10 20 3C,. 1'0 2 3 4~ 5 6
D-iiooze T,,re - - Drainage T me (min
a. Unfrozen. b. Freeze-thaw conditioned.
Figure 12. Drainage curves for columns containing water treatmnent sludge.
250 T --T
200. 20C i- T-VT -TColumn I
-I ~ CoI,, 2, 100 1 00)
50504
Fiur rniooge Timne(min) ;r~uus 0 rige Troe r,,.O
a. Unfrozen. b. Fez-hwconditioned.
19

I I I I I
2--,- -
50- Z -Colann I Column 2
IOU100
3 50 4
- 6___L_________________8 I
0 I0 20 30 x0A 0 4 8 12 16 20
Drainage Time (min) Drainage Time (min)
a. Unfrozen. b. Freeze-thaw conditioned.
Figure 14. Drainage curves for columns containing aerobically digested sludge.
filtration was allowed to take place simultaneously with thawing, then the slower thawingrate would control the rate of drainage.
Drying testsThe end of the drainage period marked the beginning of the drying rate studies. Drying
tests were conducted by leaving the sludge in the drainage columns for several days. Period-ically, core samples were taken and analyzed for total solids.
Materials and methodsSludge samples were taken with a coring device made from a 2.54-cm-diameter brass pipe.
The pipe was slowly pushed into the sludge layer until it contacted the geotextile sheet. Thesample was then extracted with a plunger. This technique provided a composite sample ofthe vertical cross section. All sludge samples were analyzed for total solids content accordingto Standard Methods, l5th Ed. (APHA 1980).
ResultsAs shown in Table 4, the total solids content of the freeze-thaw conditioned water treat-
ment sludge after drainage ranged from 28.2 to 31.6% and averaged 30.301o. An increase insolids from 0.9 to 30.3% means that 97076 of
Table 4. Total solids content after drain- the water was removed from the originalge of freeze-thaw conditioned sludges. sludge. In contrast, the average solids content
Total solids content (6) in the drained unfrozen sludge was only 9.8076.
Water The average solids content in the freeze-Column treatment Anaerobic Aerobic thaw conditioned anaerobic sludge after drain-
age was 35.1%. This increase represents a1 - 17.2 5.92 3 37.0 1.6 7507o removal of water. The unfrozen sludge2 30.1 37.0 16.63 - 21.2 6.8 contained an average of 20.10% solids.4 28.2 36.3 17.5 From Table 4 the average solids content in5 10.4 23.0 6.0 the freeze-thaw conditioned aerobically digest-6 31.6 33.0 16.77 9.3 19.1 7.3 ed sludge was 16.6%, which means than 910768 31.2 34.2 15.6 of the water in the original sludge was re-
20

Table 5. Drying rate data for freeze-thaw condi-tioned sludges.
Driing
time Total solids content (%)(hr) Column 2 Column 4 Column 6 Column 8
a. Water treatment sludge
0 30.1 28.2 31.6 31.221 31.7 -.
49 - 28.9 60.9 44.997 32.3 - - -
125 - 34.3 43.8 72.7188 34.6 - - -
217 - 34.1 36.3 38.5308 37.5 - - -337 - 41.1 -
430 39.5 - - -
b. Anaerobically digested sludge
0 37.0 36.3 33.0 34.296 40.8 - - -
120 - 43.3 42.7 44.7168 42.8 - - -
192 - 46.0 43.4 55.7
c. Aerobically digested sludge
0 16.6 17.5 16.7 15.666 17.0 18.0 18.4 19.3
165 23.6 20.1 23.6 23.4236 19.3 18.5 26.6 21.6335 19.7 21.4 34.6 38.1405 20.7 21.6 36.2 45.9550 16.9 21.1 - -715 19.2 24.2 -
moved. The average solids content in the odd-numbered columns containing the unfrozensludge was only 6.507o.
Drying rate data for each of the drained sludges are shown in Table 5. Generally, the solidsdried more quickly in the columns containing less sludge. For example, after drying for 405hours (almost 17 days) the solids content in column 8 (Table 5c) was 45.9%. During thissame period, the solids content in column 2 was only 20.7%, Originally, the depth of sludgein columns 2 and 8 was 30 cm and 200 cm, respectively.
Contrary to expectations, the solids content in some of the columns seemed to decreasewith increasing drying time. For example, the solids content in column 6 after 49 hours ofdrying time (Table 5a) was 60.907o; 76 hours later the solids content was lower at 43.8%.What caused this reduction? A check of the analytical data did not reveal any errors. The on-ly reasonable explanation seems to be that some portions of sludge in the columns dried
faster than others. Thus the core sampling technique may not have always provided a repre-sentative sample of the entire contents of the column.
DiscussionAfter drainage, the solid contents in the water treatment and anaerobically digested sludge
were greater than 20%. According to WPCF (1983), this solids content is high enough to per-mit mechanical removal by a front-end loader or truck-mounted vacuum. Therefore, furtherdewatering by drying does not appear to be necessary with these sludges.
21

Based on the WPCF criteria, only the freeze-thaw conditioned aerobically digested sludgewould require further dewatering by drying. This may take several days depending on thedepth of sludge in the bed. According to the drying rate data shown in Table 5c, the timesneeded to achieve 2007o solids in columns 8, 6, 4 and 2 were approximately 66, 165, 335 and405 hours respectively.
The reason for a lower solids content in the aerobically digested sludge than in the othersludges was not clear. Perhaps the reason is related to the greater volatile solids content ofaerobically digested sludges (see Table 1). Rush and Stickney (1979) noted similar results inexperiments conducted with both digested and undigested sludges. The digested sludges,which contained less volatile solids, were dewatered more efficiently than the undigestedsludges.
No attempt was made to use the model developed by Nebiker (1967) to predict the totaldrying time for the freeze-thaw conditioned sludges. The initial moisture content of thesesludges (after drainage) was already lower than the critical moisture content. This means thatdewatering had already progressed beyond the constant-rate drying period, which violates anassumption of his model.
The greatest mass of sludge in terms of dry solids content was applied to columns 1 and 2during the tests on anaerobically digested sludge. At 8.707o total solids and a depth of 2.0 m,the total mass of dry solids was 3.09 kg, or 174 kg/m 2 on a per unit area basis. If applied an-nually this mass is equivalent to a bed loading of 174 kg/m 2 oyr. By comparison, typical load-ings for open drying beds range from 50 to 125 kg/m 2 .yr (WPCF 1983). Therefore, a sludgefreezing bed is capable of exceeding the maximum bed loading rates of open drying beds.
DEVELOPMENT OF DESIGN MODELS
The previous study demonstrated that all three sludges drained within minutes after freeze-thaw. Therefore, the design depth will not be limited by the drainage rate, at least to a depthof 2.0 m. Instead, the design depth will be limited by the duration and intensity of the freez-ing and thawing seasons. The purpose of this section is to develop a mathematical relation-ship that can be used to design a freezing bed based on local climatic conditions.
Basic energy balance relationshipA relationship between time, temperature and depth of freezing and thawing can be devel-
oped from the first law of thermodynamics, which states that energy can neither be creatednor destroyed but only changed from one form to another. Thus, the net flow of energy intoand out of a system at equilibrium must equal the change in stored energy in the system. Inthis case the system is a layer of liquid sludge bounded at the top by air and at the bottom bypreviously frozen layers of sludge.
For any thermodynamic system, a general energy balance may be written as follows (Lu-nardini 1981):
Q+ W +M+ R = E (1)
where Q = net heat energy transferred across system boundariesW = net mechanical work across system boundariesM = net flow of energy carried into the system with the mass flowR = energy developed within the system by electrical, chemical and nuclear meansE = change in stored energy.
22

For a sludge freezing bed, W, M and R will all be zero. Therefore eq 1 can be reduced to
Q = E. (2)
Heat energy (Q) can be transferred by three methods: conduction (Qk), radiation (Qr) andconvection (Qc). Conduction is a process by which heat flows from a region of higher tem-
perature to a region of lower temperature within a medium or between different mediums in
physical contact. During heat flow by conduction, energy is transferred by direct molecularinteraction. Radiation is a process by which heat flows from a high-temperature body to alow-temperature body when the bodies are separated. Heat transfer by radiation becomes in-creasingly important as the temperature of the object increases. Convection is a process ofenergy transport between a solid surface and a liquid or gas. This mechanism does not de-pend solely on temperature difference but upon the mixing motion of the fluid as well. Sub-dividing net heat transfer according to these mechanisms yields
Qk + Q, + QC = E. (3)
By taking the derivative of each term with respect to time t, eq 3 becomes
dQk dQ, dQr dEdt + + dt =dt (4)
or in a simpler terminology
qk + q, + q, = e. (5)
The rate of heat transfer by conduction (q) is
AKqk= - AT (6)Yl
where A = surface area perpendicular to the direction of heat flowK = thermal conductivity of the materialy = thickness of material
AT = temperature difference across the material.
The rate of heat transfer by convection (qc) is
qc = h ' (AT) (7)
where A = surface areahc = average convective heat transfer coefficient
AT = temperature difference between surface and fluid.
Solar radiation will be a main source of heat transfer into a freezing bed. Terrestrial radia-tion (radiation from the earth to the bed) should not be a factor because the bed surface can-not "sei" any part of the earth. Diffuse radiation from the atmosphere will not be signifi-cant because it amounts to only 100/o of the total direct radiation reaching a horizontal sur-face on a bright sunny day (Kreith 1973).
23

A black sludge could emit radiation to the atmosphere on cold, clear nights if there is nosnow on the roof. This would cause the sludge to freeze more quickly. However, this sourceof radiation was not included in this analysis because the frequency of this should be mini-mal.
From Kreith (1973) the rate of heat transfer by solar radiation (qr) is
qr = rTIA (8)
where a = solar absorptance of the sludger = transmittance of the roofi = average insolation
A = surface area.
The net rate of heat transfer by convection, conduction and radiation must equal the rateof change in stored energy (e). When the sludge is in a liquid state, e can be calculated from
e =coA dTe dcQeAf-t (9)
where c = specific heat0o = density of liquid materialf = depth of liquid material.
During the phase transfer from a liquid to a solid state,
e = fLA dy(10)dt (0
whereof = density of solidified materialL = latent heat of fusion.
By substituting the above equations into energy balance relationships, mathematicalmodels for predicting the design depth of a freezing bed are developed below.
Development of freezing modelThe process of freezing each layer will take place in two phases. During phase I, liquid
sludge will be cooled to the freezing point. During phase II, liquid sludge at the freezingpoint will be converted to a frozen solid by loss of the latent heat of fusion. Further coolingof the layer below the freezing point should not be significant because the operational plancalls for immediate application of the next layer as soon as the previous layer has frozen (seethe Final Concept section).
Phase I modelDuring phase I the liquid sludge cools from its initial temperature (To) to its freezing tem-
perature (T). For simplicity, it is assumed that the average ambient air temperature duringthis cooling period (Ta,) will be at or below the freezing point. The underlying ice tempera-ture (T) should be at or near the freezing point if the bed is operated according to plan. Theassumed temperature profile in the bed during this phase should be approximately as shownin Figure 15.
24
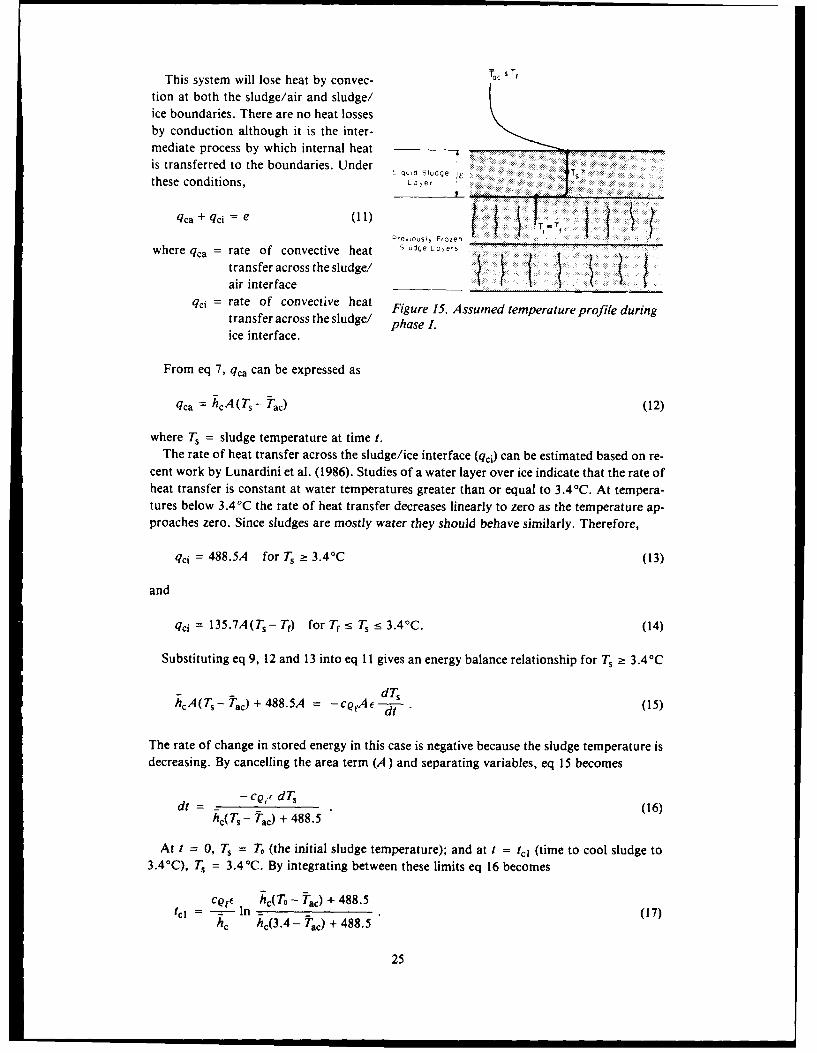
This system will lose heat by convec- ,
tion at both the sludge/air and sludge/ice boundaries. There are no heat lossesby conduction although it is the inter-mediate process by which internal heat -
is transferred to the boundaries. Under Iw , q ' a Sludge/
these conditions, L
qca + qci = e Preios) Frozen TST,where qca = rate of convective heat S!.dge .3,els
transfer across the sludge!air interface
qci = rate of convective heat Figure 15. Assumed temperature profile duringtransfer across the sludge/ phase Lice interface.
From eq 7, qca can be expressed as
qca hcA(T - 7Tac) (12)
where T = sludge temperature at time t.The rate of heat transfer across the sludge/ice interface (qci) can be estimated based on re-
cent work by Lunardini et al. (1986). Studies of a water layer over ice indicate that the rate ofheat transfer is constant at water temperatures greater than or equal to 3.4°C. At tempera-tures below 3.4°C the rate of heat transfer decreases linearly to zero as the temperature ap-proaches zero. Since sludges are mostly water they should behave similarly. Therefore,
qci = 488.5A for Ts z 3.4°C (13)
and
qci = 135.7A(T- Tf) for Tf !_ T _ 3.4°C. (14)
Substituting eq 9, 12 and 13 into eq 11 gives an energy balance relationship for T, _> 3.4°C
hA(Ts- Tca) + 488.5A = -cE dt (15)dt (5
The rate of change in stored energy in this case is negative because the sludge temperature isdecreasing. By cancelling the area term (A) and separating variables, eq 15 becomes
dt = - c dT (16)h,(T- Ta) + 488.5
At t = 0, T = T (the initial sludge temperature); and at t = td (time to cool sludge to3.4C), Ts = 3.4 °C. By integrating between these limits eq 16 becomes
cQ2e h(T - Tc) + 488.5
t C h,(3.4 - 7,,) + 488.5
25
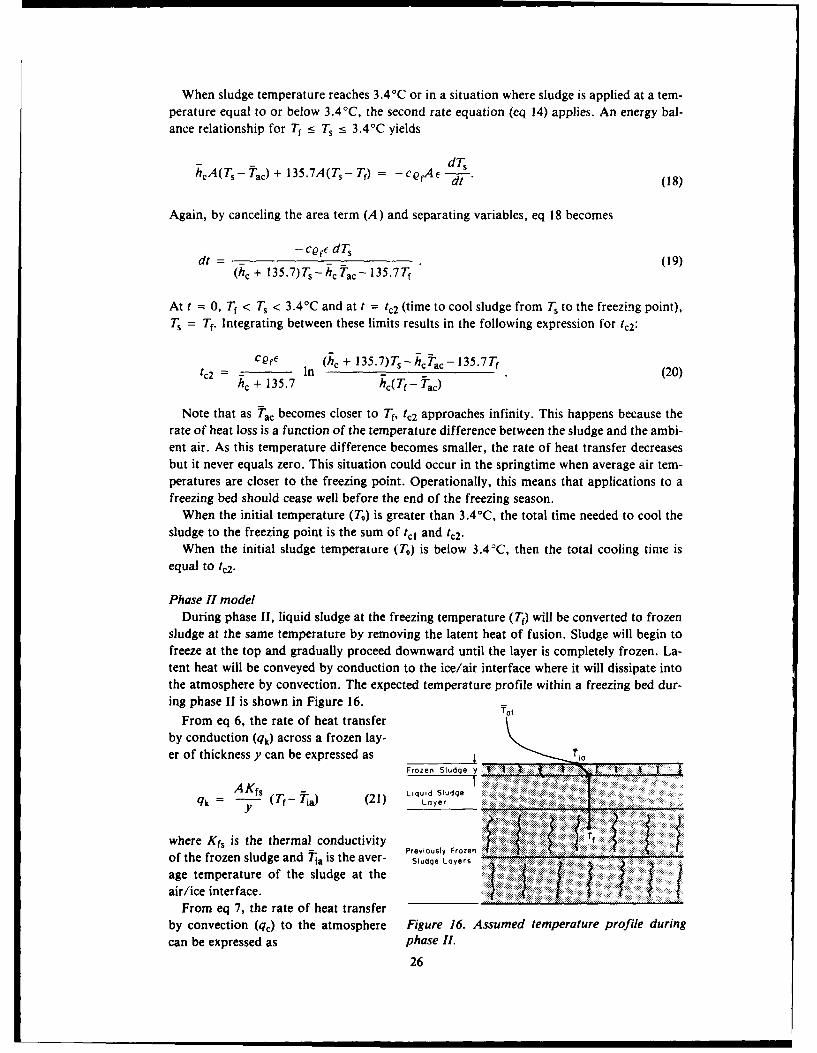
When sludge temperature reaches 3.41C or in a situation where sludge is applied at a tem-perature equal to or below 3.41C, the second rate equation (eq 14) applies. An energy bal-ance relationship for T <_ T :s 3.4'C yields
dThCA(T- Tac) + 135.7A(Ts- Tf) -CQfAE dt (18)
Again, by canceling the area term (A) and separating variables, eq 18 becomes
- c e dTs-tdT (19)
(hc + 135.7)Ts - cTc - 135.7Tf(
At t = 0, Tf < T, < 3.4°C and at t = tc2 (time to cool sludge from T, to the freezing point),T = Tf. Integrating between these limits results in the following expression for 1,2:
CQef (he + 135.7)Ts - hcTcat - 135.7Tf= In - (20)
hc + 135.7 hc(Tf- TC)
Note that as 'ac becomes closer to Tf, t, 2 approaches infinity. This happens because therate of heat loss is a function of the temperature difference between the sludge and the ambi-ent air. As this temperature difference becomes smaller, the rate of heat transfer decreasesbut it never equals zero. This situation could occur in the springtime when average air tem-peratures are closer to the freezing point. Operationally, this means that applications to afreezing bed should cease well before the end of the freezing season.
When the initial temperature (T) is greater than 3.4°C, the total time needed to cool the
sludge to the freezing point is the sum of tel and tc2.When the initial sludge temperature (T) is below 3.4'C, then the total cooling time is
equal to tc2.
Phase H modelDuring phase II, liquid sludge at the freezing temperature (T) will be converted to frozen
sludge at the same temperature by removing the latent heat of fusion. Sludge will begin tofreeze at the top and gradually proceed downward until the layer is completely frozen. La-tent heat will be conveyed by conduction to the ice/air interface where it will dissipate intothe atmosphere by convection. The expected temperature profile within a freezing bed dur-ing phase II is shown in Figure 16.
From eq 6, the rate of heat transfer
by conduction (qk) across a frozen lay-er of thickness y can be expressed as 1 -77
Frozen Sludge y
AK (Tf- Tia) (21) Layed Sludgeqlk = - Laoyer ..........
where Kfs is the thermal conductivity frvuyFoe iPeouly Frozen ..
of the frozen sludge and T7 a is the aver- Sl0,,uge Laoy er sage temperature of the sludge at theair/ice interface.
From eq 7, the rate of heat transferby convection (q,) to the atmosphere Figure 16. Assumed temperature profile duringcan be expressed as phase I.
26

qc = hcA(Tia - Taf) (22)
where Taf is the average ambient air temperature during freezing.Neither of the above expressions is very useful in practical applications because Tia is diffi-
cult to determine. However, by solving eq 21 and 22 for the temperature differences
(Tia - Taf) and (Ti- Tia) and adding, Tia can be eliminated. The result of this mathematicalmanipulation is the following:
- qky qcTfTaf Kf + (23)
Because all heat transfer is upward to the atmosphere, the rates of heat loss by conductionand convection must be equal. Substituting qc for qk in eq 23 and solving for qc yields
A (Tf - af) (24)
y 1Krs hc
which must also equal e, the change in stored energy. Therefore,
Tf Taf QfLdy (25)
y I dfLKs hc
Separating variables causes eq 25 to become
4__T a = (--$- + I)dY. (26)
At t = 0, y = c;and at t = tf, y = 0. Inte-
o2 -- grating eq 26 between these limits results in
tf= L + \h ). (27)
0o L Ramsay (1971) selected this solution for a
- -simulation model of natural freezing ofsludge in lagoons or drying beds. Also, this
solution is the same as that presented byt - Adams et al. (1960) for the case of ice bridge
10 formation by layer freezing.Examination of eq 27 indicates that con-
vection is the primary heat loss mechanism.
This can be recognized by comparing the rel-ative magnitudes of the convection (Il/hc)
0 -10 -20 -30 and conduction (E/ 2 Kfs) terms. By use ofAveroge Am~bieft A,r remperoture ('C) typical Kfs, h, and f values of 2.21 W/m. °C,
Figure 17. Predicted cooling andfreez- 7.5 W/ml',C and 0.08 m, respectively, theing curves for an 8-cm sludge layer with convection value (0.1333) is almost onean initial temperature of 35 °C. order of magnitude larger than the conduc-
27

tion value (0.0181). The conduction term does not equal the convection term until the layerthickness is 0.6 m or greater.
If h, is assumed to approach infinity and Tf 0 C, eq 27 is simplified and the depth offreezing can be determined from
2 = 2TafKfstf/fL
This solution, developed by J. Stefan (Ingersoll et al. 1954), is often used to predict lake icethickness. However, this model generally overestimates the depth of freezing because of theassumption that hc is infinite (Environment Canada 1979).
Analysis of modelsAn analysis was conducted to determine the relative importance of each model (eq 17, 20
and 27) for predicting the total cooling and freezing time (tei + tc2 + tif). This analysis wasconducted for the most extreme case when the initial sludge is hot and temperature (T) is ex-pected to be high. For most water and wastewater applications this would occur when anaer-obically digested sludge was pumped directly from the digester onto the freezing bed. Thetemperature of this sludge could be as high as 35 °C.
Specific heat (c), sludge density (oe Qf), latent heat (L), thermal conductivity (Kfs) andfreezing point (T) values used in this analysis are those of water and ice. These values are1.16 W.hr/kg. °C, 998 kg/m, 917 kg/m', 93 W.hr/kg, 2.21 W/m. °C and 00 C respectively.A later evaluation will show that these values are also valid for sludges (see the Summarysubsection of the Evaluation of Sludge Input Parameters section). The average convectiveheat transfer coefficient (he) was assumed to equal 7.5 W/m'. °C based on experiments con-ducted in a prototype freezing bed (see the Convection Coefficient, hc section). To simplifythis analysis, the average ambient air temperatures during cooling and freezing (Tac and Taf)were assumed to be equal.
A plot of each model (Fig. 17) indicates that tel and tc2 are small compared to the totalcooling and freezing time. For example, at Tc = - 10°C, tcl and tc2 are 4.2 and 1.3 hours,respectively, and collectively represent only 5.0% of the total cooling and freezing time(108.8 hours). Therefore, for design purposes, both t1 and tc2 could be eliminated fromfreezing time predictions without serious error. This elimination simplifies the freezingmodel to only one equation, i.e. eq 27.
Development of thawing modelThawing will proceed downward from the surface and inward from the walls of the freez-
ing bed. As thawing continues, solids will accumulate on the submerged frozen surface caus-ing an insulating effect. Therefore, the sludge at the bottom of the bed will take longer tothaw than the sludge at the top. The expected temperature profile in the bed during thaw isshown in Figure 18. Essentially, it is a reverse image of the temperature profile during phaseII (Fig. 16).
To maximize the thawing rate, most of the supernatant should be removed as quickly aspossible. This can be accomplished in the freezing bed by removing the stop-planks as thaw-ing progresses. Also, the sludge should not be allowed to dry because air will be introducedinto the open pores. This will reduce the thawing rate because air has a lower conductivitythan water.
Since sludge is typically dark, it should absorb solar radiation and heat up quickly duringsunny days. This added heat will increase the surface temperature and speed up the thawingprocess. Therefore, solar radiation was included in the thawing model.
28

Sioed SLudge s
Figure 18. Assumed temperature profile during thaw.
Another source of heat will be from convection, as warm air flows over the frozen surface.The rate of heat transfer by both mechanisms must equal the rate of energy gain resulting
from the phase change from frozen to liquid states. Thus, an energy balance per unit area atthe sludge/air interface yields qc + qr= e, or
hc(Ta-Tsa+arl dyhcQa- s) + or fL - (28)
Depth
where ti is the average ambient air temperature during thaw.Another energy balance relationship can be obtained across the settled solids layer. The
rate of heat transfer by conduction across the settled solids layer must also equal e becauseboth heat transfer processes are acting in series. Thus an energy balance across this layeryields qk = e or
less-dy
-ji- TsaTf) t= fL - (28)
where A is the depth of settled solids and K is the thermal conductivity of the settled solids.Neither eq 28 nor 29 is very useful because tsa is difficult to determine. However, as was
done in the freezing model, by can be eliminated by solving eq 28 and 29 for the temperaturedifferences and adding. This procedure results in the following expression in terms of t and
Tf only:
7at- T = 1 + L dt h(3)
Solving eq 30 can be simplified by assuming that the ratio of A tO y is constant for alldepths. Then A can be expressed as Oy, where 0 is the fraction of deposited solids per unitdepth of thawed sludge. Substituting this expression into eq 30 and separating variablesresults in
Tt -Tf+ h+ A hC er
an! ,, )r (I C er d. (31)
At t = 0, y = 0 and at t = tth (time to thaw), y = Y (the total depth of thawed sludge). In-tegrating between these limits and solving for tth results in the following mathematical modelfor predicting thawing time:
29
result inlJ

tth QfL Y t + Y (32)- ari (h C 2Ks /
Tt - r +
Other modelsFarrell et al. (1970) conducted several freezing experiments at Ely, Minnesota, to deter-
mine the freezing rate of aluminum hydroxide sludges. They adopted the following modelfor predicting freezing time for a layer with a depth of E:
tf = QfLf 1(3
3600(T - Taf)Kfs 2 1
where Qf = 0.917 g/cm', L = 80 cal/g, Kfs = 0.0057, cal/cm2 os, c is in centimeters, and Tf,Taf are in degrees Celsius. This empirical equation is dimensionally inconsistent and must beused with the units given. The data they obtained from bench-scale studies agreed reasonablywell with this model, although a safety factor of 2.0 was recommended when this model isused for design.
Reed et al. (1985) and Hernebring and Lagesson (1986) recommend using a modified ver-sion of the Stefan equation. In modified form this equation is
tf = 24- Tafr (34)
Tr -Taf M)
where c is the layer thickness in centimeters and m is a proportionality coefficient dependenton thermal conductivity, density and latent heat of fusion. Based on three experiments in apilot-scale drying bed, Reed et al. (1985) found the value of m to be 2.04 cm/(°C-day) '/ .
As pointed out earlier (Phase II Model section), a major assumption of the Stefan model isthat the convective heat transfer coeffiL it is infinite. This assumption makes the surfacetemperature equal to the ambient air temperature. Under high wind conditions and greaterice thicknesses this assumption may be valid. However, for thin layers such as those appliedto a freezing bed the surface temperature is closer to the freezing point than the ambient airtemperature. This phenomenon was observed by Adams et al. (1960) during layer freezingexperiments with seawater. Data obtained during convection coefficient measurements con-cur with this observation. Therefore, freezing times predicted by the Stefan model will be lessthan actual and a freezing bed designed with this model could be seriously undersized.
EVALUATION OF SLUDGE INPUT PARAMETERS
Eight physical and thermal properties of sludge must be determined before eq 27 and 32can be used to predict freezing and thawing times. These include the physical properties ofQf, f and 0, and the thermal properties L, Kfs, K,,, a and Tf. The following is an analysis ofeach of these variables.
Frozen sludge density, QrThe specific gravities of all three sludges tested during the drainage and drying experi-
ments (see the Dewaterability Studies section) were nearly equal to 1.0. This is typical ofmost sludges because they contain mostly water, and organic solids have a specific gravityalmost equal to that of water. Therefore, the difference in density between frozen sludge andice should be negligible. The density of ice is 917 kg/m', which is the value used for Qf.
30

Layer thickness, EAs shown in eq 27, the freezing time is directly proportional to E. Therefore, the thinnest
layer possible should be applied to minimize freezing time. However, the application of verythin layers is not practical because the layer would probably freeze before it became evenlydistributed. This will result in a buildup of frozen sludge near the inlet end, and the full cap-acity of the bed would not be utilized. Based on experience with sludge applications to a fro-zen drying bed (see Appendix A), the layer thickness should be greater than 5.0 cm. Reed etal. (1985) concluded that a layer thickness of 8.0 cm would be practicable.
Settled solids fraction, 0The settled solids fraction, 0, is the ratio of the depth of settled solids to the depth of
thawed sludge. The value of 0 will depend on solids content and compressibility. A sludgewith a high solids content will have a greater 0 value than the same sludge with a lower solidscontent. Also, a compressible sludge will have a lower 0 value than a noncompressiblesludge.
Values of 0 for the sludges used in the previously described drainage tests are shown inTable 6. The average values were 0.34, 0.15 and 0.07 for the anaerobically digested, aerobic-ally digested and water treatment sludges respectively.
Table 6. Depth of settled solids from drainage tests andcalibration of settled solids fraction.
Thawed Settledsludge solids Settled
Sludge Column depth depth solidstype number (cm) (cm) fraction, 6
Anaerobically 2 220 55 0.25digested 4 110 38 0.35
6 60 22 0.378 34 13 0.38
Aerobically 2 220 27 0.12digested 4 110 14 0.13
6 60 9 0.158 34 6 0.18
Water treatment 2 242 16 0.074 132 8 0.066 66 5 0.088 33 2 0.06
Thermal conductivities, K, , K,Because of its high water content, sludge should have the same thermal conductivity as ice,
which is 2.21 W/m °0 C. The actual Kf, value could be slightly higher because the solids gen-erally have a higher conductivity than ice.
There was no information in the literature on the thermal conductivity of settled solids(Ks,). However, the thermal conductivities of water and mud are 0.55 and 0.87 W/m. 0C, re-spectively (Ingersoll et al. 1954). The water content in mud ranges from 150 to 300% (Lunar-dini 1981), which is equivalent to a solids content of 40 to 25%. Data from the drainage testsindicate that the solids content of thawed sludge will also be in this range. Based on thisinformation, the value of K,5 was assumed to equal that for mud, which is 0.87 W/m.°C.
31

Latent heat of fusion, LThe L value for a sludge will be directly proportional to its water content (Lunardini
1981). Pure water has a latent heat of 93.0 W.hr/kg. For a sludge containing 95% water byweight, L will be 88 W.hr/kg. In this study the pure water value for L was used because it re-sults in a slightiy more conservative design.
Absorptance, aAbsorptance is the ratio of the solar energy absorbed by a body to total amount that falls
on it. For an ideal black body the absorptance would be 1.0. Since sludge is nearly black itshould have a very high absorptance. As expected, no values of solar absorptivity for sludgewere found in the literature. However, a reported value for dry plowed ground, which is sim-ilar in color, is 0.9 (Lunardini 1981).
Freezing point, TrAlthough there appears to be no sludge freezing point information in the literature, a con-
siderable amount of work has been done to determine the freezing point of other substanceswith high water contents, such as foods and soils. Heldman (1974) explains that water in afood product can freeze over a wide range of temperatures. This phenomenon is attributedto an increase in the salt concentration of the solute as ice is formed. Salts depress the freez-ing point, and additional freezing will not occur until the temperature is lowered. Hsieh et al.(1977) present freezing points for several foods, including asparagus (-0.67°C), cherries(-1.440C) and plums (-2.28°C). This same phenomenon can occur in soils. For silts andclays the temperature depression can be as much as 5°C (Lunardini 1981).
A depressed freezing point could have a significant effect on the freezing and thawingtimes predicted by eq 27 and 32. Consequently, it was necessary to measure freezing pointsexperimentally. These experiments were conducted in the CRREL soils laboratory duringDecember 1985 with the same three sludges used in the previous drainage and drying studies.A photo of the device used to measure freezing points is shown in Figure 19. The basic com-ponents of this device were a refrigerated circulating bath (Endocal Model RTE, 400), a spe-
Figure 19. Apparatus used to measure the freezing point of sludge.
32

cially fabricated stainless steel sample con- 8 -
tainer, and a temperature recorder (KayeDigistrip Il). A thermistor, with an accu- -
racy of --O.1°C, was used to measure tem-
perature.Before each test, the sample container was -040
cooled to -8'C. A 20-mL sample was then °C -poured into the container and allowed to -080freeze. As freezin, progressed, the elapsedtime and temperature inside the sample were -120
recorded. A total of nim tests were conduct- -ed, three for each type of sludge. -160
A typical freezing point depression curve is -L
shown in Figure 20. This curve was obtained -2 oor-while freezing a sample of aerobically digest- -- , - I_ _ed sludge containing 1.4076 solids. Examina- 2
4 0 4 8 12
tion of Figure 20 indicates that the sample Elapsed T me (min)
became supercooled down to -2.2°C after an Figure 20. Freezing point depression curveelapsed time of four minutes. At this time, for aerobically digested sludge containingnucleation occurred, after which the temper- 1.4% solids.ature quickly rose to the freezing point. Forthe next six minutes, the temperature re-mained essentially constant because of the Table 7. Results of freezing pointlatent heat released during the freezing pro- measurements.cess. The average temperature at the freezingpoint was -0.0480 0 C. After the phase Solids Freezingchange was complete, the temperature of the Sludge content point
sample began to decrease below freezing. type (M) (0C)
The results of each freezing point meas- Water treatment 0.3 -0.0933
urement, along with the solids content, is 0.5 -0.0787
shown in Table 7. Analysis of these data in- 1.1 -0.0730
dicate that none of the sludges tested exhibit- Anaerobic 3.7 -0.1406
ed a large depression of freezing point. 7.7 -0.1450
Based on these results it was concluded that
the freezing point of sludge (Tf) is essentially Aerobic 0.5 -0.03990.9 -0.0380
equal to that of water, i.e., 00 C. 1.4 -0.0480
SummaryAs a result of these evaluations, it seems
reasonable to conclude that the physical and Table 8. Physical andthermal properties of water and wastewater thermal properties ofsludges are approximately equal to those of sludge.water. The differences that exist are negligi- Property Valueble and not significant for design purposes.The main reason for the similarity between Of 917 kg/m'sludge and water properties is the high water L 93.0 W.hr/kgcontent in most sludges, which controls ther- Kf, 2.21 W/m. °C
modynamic behavior. The value of each Ks 0.87 W/m.°C
sludge property determined by this study is Tr 00Csummarized in Table 8. 0.9
33

EVALUATION OF CLIMATIC INPUT PARAMETERS
The climatic parameters needed for the freezing and thawing models include the averageambient air temperatures during freezing and thawing (Taf, Tat), the average insolation (I)and the average convection coefficient (he). This section will discuss methods to determinethese parameters for a proposed site.
Ambient air temperatures, tqf, T'tAir temperature data should be obtained from the meteorological station nearest to the
proposed site. In the U.S. there are approximately 350 first-order weather stations that pub-lish monthly average air temperatures. By use of these data, T can be calculated by averag-ing the monthly average air temperatures that are below freezing. For a conservative design,a warmer-than-normal year should be selected. Likewise, Taf can be calculated by averagingthe monthly air temperatures that are above freezing. In this case, a cooler-than-normal yearshould be selected for a conservative design. An example of how Taf and Tat can be deter-mined from monthly temperature data is shown in the Use of Models for Design section.
Insolation, 1Insolation is the rate of direct solar radiation on a horizontal surface. Since a freezing bed
will also present a horizontal surface to the sun, the use of this parameter is appropriate. His-torical solar radiation data can be found in the Climatic Atlas of the United States (USGPO1968) and in Kreith and Kreider (1978). These data are given in Langleys per day, which canbe converted into units of W/m 2 as follows:
W/m =Langley 1 day 11.6 Wohr/m
day 4h r Langley
The amount of radiation reaching the surface of the bed will depend on the transparencyof the roof. A relative measure of transparency is the transmittance (r), which is the ratio ofthe radiant energy transmitted to the radiant energy incident on the surface. Transmittancevalues for various materials can be found in Kreith and Krieder (1978). For example, a roofmade of Plexiglas has a transmittance of 0.9.
Convection coefficient, h,The convection coefficient will vary from day to day depending on the wind conditions. It
will also vary areally within a large system such as a sludge freezing bed. These variations arecaused by differences in air velocity due to surface geometry. As a result, some sections ofthe bed will freeze faster than others. To ensure complete freezing before the next layer is ap-plied, the convection coefficient used for design should be based on the slowest freezing por-tion of the bed.
The magnitude of the convection coefficient will depend on the velocity of air flow overthe surface. An approximate value of h, can be obtained from the relationship (Kreith andKreider 1978)
h= 5.7 + 3.8v (35)
where hc is in W/m 2 • °C and v is the wind velocity in m/s. If there is no wind, the air will stillmove because of air density differences between the warm air near the surface and the colderair above. This sets up a circular flow pattern called free or natural convection. Free convec-tion values of he range from 6.0 to 30.0 W/m 2 • °C (Kreith 1973). On an open surface in near-
34

ly still air, Adams et al. (1960) obtained an h. value of 11.6 W/m 2 . °C in layer freezing exper-iments with seawater.
To obtain a representative value of hc, a series of freezing experiments were conducted in aprototype freezing bed. During the freezing of each layer, the average ambient air tempera-ture (Taf) and the freezing time (tf) were recorded. These variables along with the known var-iables E, Of, L, Kfs and Tf were substituted into eq 27 and solved for hc.
Description and operation of prototype freezing bedAn in-ground concrete test cell, previously used for land treatment studies, was converted
to a prototype freezing bed. Located at CRREL, the test cell is 9 m square by 1.5 m deep. Toconvert it to a freezing bed, a transparent Figerglas roof was built over the test cell. The peakof the roof was cantilevered to provide an opening for ventilation while keeping out precipi-tation. Both gabled ends were left open except for a latticework of wood strips placed 3 cmapart. The purpose of the latticework was to allow free ambient air movement within the bedwhile keeping out most of the drifting snow. A door and catwalk provided access to the bed.The inside concrete walls were covered with a petroleum-based foundation coating to pre-vent leakage. Photos of the prototype freezing bed are shown in Figure 21.
Since previous studies indicated that their physical and thermal characteristics were simi-lar, layers of water rather than sludge were used in these experiments. The point of applica-tion was near the center of the bed at an average rate of 66.2 L/min. A splash plate suspend-ed beneath the application point prevented erosion of ice by the water. The average tempera-ture of the water was 50 C, and a typical application took less than 1 hour.
Temperatures within the freezing bed were monitored by 33 copper-constantan thermo-couples. Thermocouples 1 through 30 were mounted at 5-cm intervals on a wooden staff.This staff was located on the north side of the bed, approximately 30 cm from the concretewall. Thermocouples 31, 32 and 33 were suspended above the staff and were used to recordambient air temperature. All thermocouples were attached to a data logger that recordedhourly temperature readings. The system was calibrated with an ice bath to an accuracy of_0.5°C.
The original purpose of the thermocouple string was to automatically apply the next layerof water as soon as the previous layer had frozen and the ambient air temperature was belowfreezing. However, it soon became apparent that this technique would not work. The ther-mocouple spacing was too great to detect complete freezing within each layer and the stringwas located too close to the sidewall. Since freezing began at the sides and progressivelymoved inward, the thermocouples indicated a frozen state prematurely. Instead of applyingeach layer automatically, each layer was applied manually after the completeness of freezingwas checked by chipping holes in the layer at several locations.
Although the thermocouple string did not operate as an automatic control device, it pro-vided an excellent opportunity to observe the vertical temperature profile within the bed.Figure 22 shows the average vertical temperature profile and standard deviation bands dur-ing freezing of the last layer, layer 10. The temperatures shown are hourly averages over the192-hour freezing period from 3 March 1986 to II March 1986.
The shape of this profile closely resembles that of the assumed temperature profile of thephase II model (Fig. 16). Values for Tat, Tia and T were -4°C, -I 'C and 00C, respectively.Note that the average surface temperature (Tia) of layer 10 is approximately 3 °C higher thanthe ambient air temperature. This difference indicates that convection controlled the rate ofheat loss. Otherwise, if conduction alone were controlling, the average surface temperaturewould equal the average ambient air temperature.
35

a. Snow-covered roof of bed with lattice work at gabled end.
b. Inside of bed after freezing a water layer.
Figure 21. Prototype freezing bed used to determine the average convection co-efficient, he.
ResultsVisual observations revealed that freezing of each layer began from the top surface and
around the edges of the bed. As freezing progressed, water was forced towards the middle.Eventually, the surface would rupture near the center of the bed because of the pressurebuildup and water would be released. This would happen repeatedly until all the water wasfrozen. As a result, a mound of ice protruded above the surface after freezing was complete.
From 23 December 1985 to 12 March 1986, 11 layers were applied ranging in thicknessfrom 0.025 m to 0.102 m. A leak developed in the bed during a "January thaw," whichcaused loss of water during freezing of layers 6, 7 and 8. The suspected location of the leakwas along a seam between the poured concrete walls and the footing. Eventually the leak
36

sealed (probably by freezing) and the lost 6 Top of Test Cell
water was slowly replaced and frozen. Tospeed up the replacement process, several thinlayers were applied until the cavities were filled 12L
and a smooth surface was restored. Results ofthe freezing bed experiments are summarizedin Table 9.
Excluding layer I because of incomplete o 08
freezing, the hc values ranged from 6.0 to 8.3 Z Layer10 N
W/m'. C. The average h, for the entire freez- - l-ing period was 7.5 W/m'. °C. According todata supplied by the local meteorological de- 04
tachment, the average wind speed during this SFrozen Layers _
period was 1.0 m/s. From eq 35 the calculatedh. value is 9.5 W/m'. 'C, which is higher thanthe experimental value by 2.0 W/m 2 . 'C. One -15 -10 -5 0
reason for this difference could be the below- Temperature C)
ground-level location of the freezing surface. Figure 22. Average temperature profileThis location could reduce wind velocities es- during freezing of layer 10.pecially in the prototype bed where the depthis large in relation to the surface area. This sheltering effect would not be as pronounced in afull-scale bed where the depth-to-surface-area ratio would be smaller.
USE OF MODELS FOR DESIGN
Freezing design depthBased on the previous analysis of input parameters it is reasonable to assume values of 917
kg/m, 93 W-hr/kg, 2.21 W/m. C, 0.08 m and 0°C for of, L, Kfs, E and Tf, respectively.Substituting these values in eq 27 reduces the predicted freezing time, tf, to
6822(1l 8t" = 6a2( + 0.018. (36)
Equation 36 des not predict the freezing design depth directly but only the time needed tofreeze one 8-cm layer. The freezing design depth will depend on the number of layers thatcan be frozen during the freezing period. This can be calculated by dividing the length of thefreezing period by the freezing time for each layer. In mathematical terms,
o.o814Df = (37)f
whereDf = freezing design depth (m)
Pf = freezing period (hr)0.08 = assumed depth of each layer (m).
By substituting eq 36 into eq 37,
37

, .0 cdv a ,M
tj 06 -1r x C
eq oD cV -
u 1~C 0 10 10o
Z ~ coo 0
0 C
ao m ka
04 %
... 'C0 00a o oc
0 .0
a-4
~ a.I38

- 1.17 X I0-'(!"afPf)(Dr = -1(38)
- + 0.018he
Thawing design depthBy use of the same values for Of, L, Tf and hc as in the freezing model, and by assuming
values of 0.9, 0.9 and 0.87 W/m. 'C for a, r and Kss, respectively, the thawing model (eq 32)can be reduced to
tth 85,281 Y (1 + OY) (39)t at + 0.11- 7-5 174
In this case the predicted thawing time (tth) applies to the total depth of frozen sludge and notjust an individual layer as in the freezing model. The thawing design depth is the total depthof frozen sludge (Y).
Ycan be determined from eq 39 using the quadratic formula. This will produce two valuesfor Y but only the positive value is useful for engineering applications. By use of this ap-proach, the thawing design depth can be predicted from
(12,927.7 + 19 .6 6tth 7at + 2.20tth I 2 - 113.7
9800 (40)
ValidationThe freezing and thawing models could not be comprehensively validated because there
are no freezing beds currently in operation. However, limited data on layer freezing in sludgelagoons and drying beds were used to conduct a preliminary evaluation of the freezingmodel.
The Lakewood Filtration Plant in Duluth, Minnesota, has used natural freezing for sludgedewatering for several years (Schleppenbach 1984). Water treatment sludge is pumped fromthe bottom of the lagoons and sprayed on the top of previously frozen sludge in 15- to 23-cmlayers. Based on the reported average freezing rate of 6.8°C.day/cm, the actual number ofdegree-days required to freeze these layers would range from 102 to 156 0C.day. Accordingto eq 27, the predicted number of degree-days [i.e. tf(T - Taf)/241 range from 89 to151 'C.day, which is within 3 to 12076 of the actual.
Other freezing tests were conducted at the Salem, New Hampshire, Wastewater TreatmentPlant during the winter of 1985-86 (see Appendix A). According to results from these tests,layers 4 and 12 cm thick required 14.4 and 69 0C.day, respectively, to freeze. The predicteddegree-day requirement from eq 27 was 20 and 68°C.day, respectively. Again there wasgood agreement between the actual and predicted degree-day values. Based on these data,the freezing model appears to be valid.
ExampleThe use of eq 38 and 40 for design of a sludge freezing bed is demonstrated in the follow-
ing example. Two sites were selected for evaluation: Hanover, New Hampshire, and Fair-banks, Alaska. These sites were selected because they have different natural freezing andthawing energies. Hanover, New Hampshire, is typical of the temperate zone while Fair-banks, Alaska, is typical of the subarctic zone. Monthly average air temperatures and insola-tion data for both sites are shown in Table 10.
39

Table 10. Monthly average air temperatures and insolationat Hanover, New Hampshire, and Fairbanks, Alaska.
Hanover, New Hampshire* Fairbanks, Alaskat
Temperature Insolation Temperature InsolationMonth (C) (W/m') (°C) (W/m')
January -9.2 70 -23.9 8February -7.6 107 -19.7 34March -0.2 140 -12 4 103April 6.0 202 - 1.1 182May 13.4 210 8.7 223June 17.3 232 14.9 244July 20.6 249 16.1 210August 19.2 199 13.1 153September 13.9 151 7.0 87October 7.8 98 -3.4 40November 2.1 66 -15.9 13December -4.8 59 -22.8 3
* From Bates (1984).t From NOAA (1984).
From these data Pf, tth, Taf, Tat and 1 were calculated for each site as follows.
For Hanover,
Pf = Dec, Jan, Feb, Mar = 121 days : 2904 hours
t th = Apr, May, Jun, Jul, Aug, Sep, Oct, Nov = 244 days = 5856 hours
- -4.8-9.2-7.6-0.2Taf =4 = -5.4 0C
T 6.0+13.4+17.3+20.6+19.2+13.9+7.8+2.1T =8 = 12.5 0 C
= 202+210+232+249+ 199+ 151 + 98+66= 176 W/m.8
For Fairbanks,
Pf = Oct, Nov, Dec, Jan, Feb, Mar, Apr = 212 days = 5088 hours
tth = May, Jun, Jul, Aug, Sep = 153 days = 3672 hours
-af = -3.4-15.9-22.8-23.9-19.7-12.4-1.1 = -14.2oCTa~ 7
S=8.7+14.9+16.1 + 13.1 +7.05 = 12 "0 C
1 223+244+210+153+187 = 183 W/m 2 .5
40
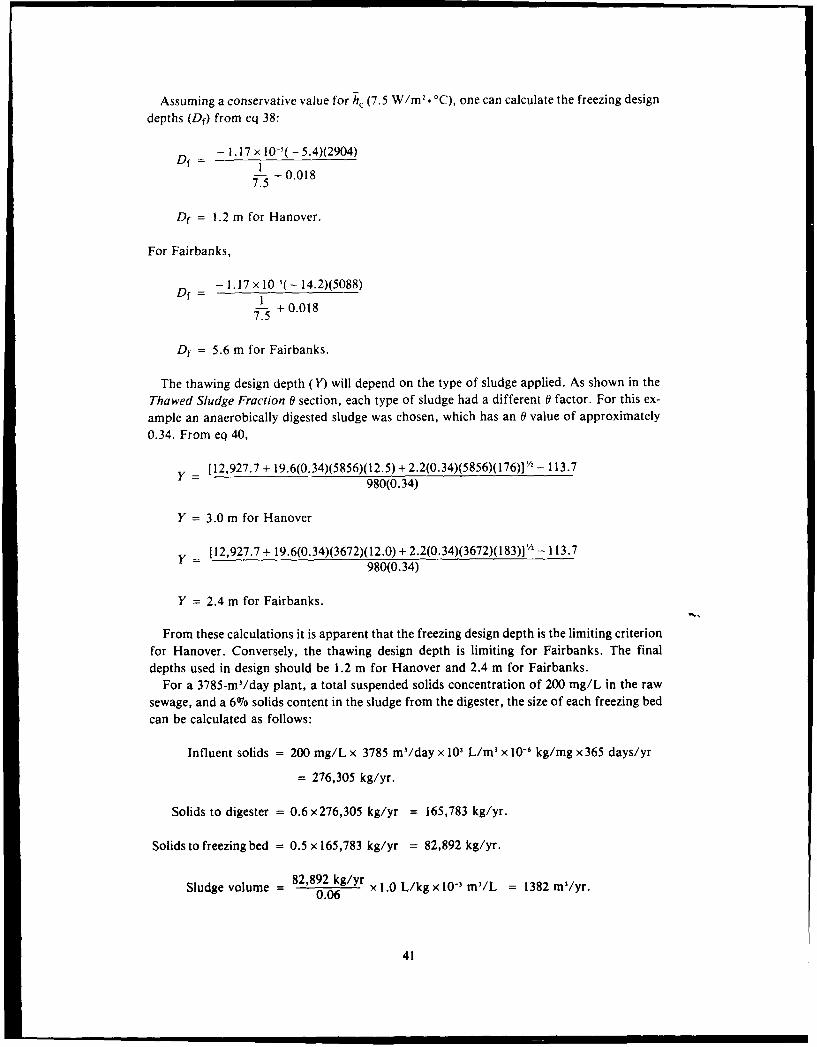
Assuming a conservative value for h, (7.5 W/m 2 . 0C), one can calculate the freezing design
depths (Df) from eq 38:
- 1.17 x 10⁻¹( - 5.4)(2904)Df-- +0.0187.5
Df = 1.2 m for Hanover.
For Fairbanks,
- 1.17 x 10-'( - 14.2)(5088)Df-
. + 0.018
Df = 5.6 m for Fairbanks.
The thawing design depth (Y) will depend on the type of sludge applied. As shown in the
Thawed Sludge Fraction 0 section, each type of sludge had a different 0 factor. For this ex-
ample an anaerobically digested sludge was chosen, which has an 0 value of approximately
0.34. From eq 40,
y [12,927.7 + 19.6(0.34)(5856)(12.5) + 2.2(0.34)(5856)(176)]/2 - 113.7
980(0.34)
Y 3.0 m for Hanover
y [12,927.7 + 19.6(0.34)(3672)(12.0) + 2.2(0.34)(3672)(183)'/ _ 113.7980(0.34)
Y = 2.4 m for Fairbanks.
From these calculations it is apparent that the freezing design depth is the limiting criterion
for Hanover. Conversely, the thawing design depth is limiting for Fairbanks. The final
depths used in design should be 1.2 m for Hanover and 2.4 m for Fairbanks.For a 3785-m 3/day plant, a total suspended solids concentration of 200 mg/L in the raw
sewage, and a 6% solids content in the sludge from the digester, the size of each freezing bed
can be calculated as follows:
Influent solids = 200 mg/L x 3785 m/day x 101 L/m x 10-6 kg/mg x 365 days/yr
= 276,305 kg/yr.
Solids to digester = 0.6 x 276,305 kg/yr = 165,783 kg/yr.
Solids to freezing bed = 0.5 x 165,783 kg/yr = 82,892 kg/yr.
Sluge olue =82,892 kg/yrSludge volume = x1.0 L/kg x 10-3 m'/L = 1382 ml/yr.
41

Area 1382 m/yr 1152 m' for Hanover.1.2 m yr
Area = 1382 m3/yr _ 576 m2 for Fairbanks.2.4 m yr
Based on these calculations, the area needed for a freezing bed will be considerably lessthan that needed for an open drying bed. Assuming a typical solids loading rate of 50 kg/m 2
(WPCF 1983) the area needed to dry 82,892 kg/yr is 1658 m2 in both Hanover and Fair-
banks. This area is 4407o larger than the freezing bed area in the Hanover case and 187% larg-er in the Fairbanks case.
Instead of using the freezing bed as the only method for dewatering, a combination offreezing and drying beds could be used. By using a drying bed in the summer and a freezingbed in the winter, both natural dewatering processes would be optimized. Also, very littlestorage capacity would be required. Based on a five-month discharge to a drying bed and aseven-month discharge to a treezing bed, the size of the freezing and drying bed combinationfor Hanover would be 1363 m2 (691 m2 for drying bed and 672 m2 for freezing bed). Like-wise, for a three-month discharge to a drying bed and a nine-month discharge to a freezingbed, the combination for Fairbanks would require 846 m2 (414 m2 for drying bed and 432 m,for freezing bed).
The area requirements for each option and location are summarized in Table 11. 1 le :ow-est area requirement for both locations is the freezing bed only option. However, a storagefacility would be needed to store the sludge over the summer months. A more cost-effectivealternative may be to reduc the storage requirement by using the freezing and drying bedoption.
Table 11. Area requirements for sludge dewater-ing by natural freezing and drying beds (m2).
CombinationDrying Freezing freezing and
Location bed only bed only drying bed,
Hanover, 1658 1152 1363New Hampshire
Fairbanks, 1658 576 846Alaska
CONCLUSIONS AND RECOMMENDATIONS
The improved dewaterability of water and wastewater sludges after freeze-thaw has beenknown for some time. In most cases, application of this technology has been limited to dry-ing beds and lagoons. However, to optimize the natural freeze-thaw process, a specially de-signed unit operation is necessary. This study proposes a new dewatering unit operationcalled a freezing bed. Criteria needed to design this unit operation are developed. The mainconclusions of this study are:
1. The depth of sludge that can be applied to a freezing bed is not limited by drain-ability-at least to a depth of 2.0 m. Since all sludges drained easily at 2.0 m, even greaterdepths may be possible.
2. The solids content in freeze-thaw conditioned water treatment and anaerobically digest-ed sludges is high enough to allow mechanical remo, il immediately after drainage is com-
42

plete. There is no need for further drying. However, further dewatering by drying may benecessary for freeze-thaw conditioned aerobically disgested sludge.
3. Capillary suction time (CST) is a better indicator than specific resistance for measuringthe dewaterability of freeze-thaw conditioned sludges.
4. The physical and thermal characteristics of frozen sludge are, for engineering purposes,equivalent to those of ice.
5. The design of a freezing bed will depend on the duration and intensity of the freezingand thawing seasons at the proposed site. In a temperate zone, the design depth will be con-trolled by the freezing season, while in subarctic regions, the length and intensity of thethawing season will be controlling.
Furthcr research i ne"-ed to demonstrate the sludge freezing bed concept and to validatethe design models. The best way to accomplish this would be to conduct pilot-scale experi-ments. Also, research is needed to determine the actual thermal conductivity (Kss) of thawedsludge.
LITERATURE CITED
Adams, C.M., Jr., D.N. French and D.W. Kingerly (1960) Solidification of sea ice. Journalof Glaciology, 3(28): 745-760.Adrian, D.D., P.A. Lutin and J.H. Nebiker (1968) Source control of water treatment wastesolids. Civil Engineering Department, University of Massachusetts (Amherst), Report No.EVE 7-68-1.Adrian, D.D. and J.H. Nebiker (1969) Source control of water treatment waste solids. CivilEngineering Department, University of Massachusetts (Amherst), Report No. E VE 13-69-1.Amprican Public Health Association (1980) Standard Methods for the Examination ofWater and W,,stewater. Washington: APHA, 15th ed.Applied Science Laboratories, Inc. (1971) Purification of mine water by freezing. Environ-mental Protection Agency, NTIS PB 213-121.Babbitt, H.E. (1931) Sewage investigations at the University of Illinois. Sewage Works Jour-nal, 3(4).Baker, R.A. (1967) Trace organic contaminant concentration by freezing. I. Low ino: inicaqueous solutions. Water Research, 1: 61-77.Barduhn, A.J. (1963) Wastewater renovation. Part 1: A design study of freezing and gas hy-drate formation. Public Health Service, Cincinnati, Report No. 999-WP-4.Baskerville, R.C. (1971) Freezing and thawing as a technique for improving the dewaterabili-ty of aqueous suspensions. Filtration and Separation, March/April: 141-144.Baskerville, R.C. and R.S. Gale (1968) A simple automatic instrument for determining thefilterability of sewage sludges. Water Pollution Control, Paper No. 3, p. 233-241.Bates, R.E. (1984) Climate at CRREL, Hanover, N.H. USA Cold Regions Research and En-gineering Laboratory, Special Report 84-24. ADA 148 400.Benn, D. and P.W. Doe (1969) The disposal of sludge by the freezing and thawing process.Journal of Filtration and Separation, July/August: 383-389.Bishop, S.L. (1971) Methods of treating wastes from water treatment plants. Journal of NewEngland Water Works Association, 85(1j: 10-24.Bishop, S.L. and G.P. Fulton (1968) Lagooning and freezing for disposal of water plantsludge. Public Works, June, p. 94-96.Boiling, G.F. and J. Cisse (1971) A theory for the interaction of particles with a solidifyingfront. Journal of Crystal Growth, 10: 56-66.
43

Campbell, R.J. and D.K. Emmerman (1972) Freezing and recycling of plating rinsewater.
Industrial Water Engineering, June/July: 38-39.
Canfield, C. and R.L. Sutphen (1982) Mother nature as sludge thickener. Water/Engineer-
ing and Management, December: 22-24.
Chalmers. B. (1959) How water freezes. Scientific American, 200: 114-122.
Chamberlain, E.J. aad S.E. Blouin (1978) Densification by freezing and thawing of fine ma-
terial dredged from waterways. In Proceedings of the Third International Conference on
Permafrost, Edmonton, Alberta, Canada, 10-13 July. National Research Council of Can-
ada, vol. 1, p. 623-628,Cheng, C., D.M. Updegraff and L.W. Ross (1970) Sludge dewatering by high-rate freezing
.t smnai Lcmp ciaL.,i-,_ jiffetetices. Environmental Science and Technology, 4(12): 1145-1 147.
Christensen, G.L. and R.I. Dick (1985) Specific resistance measurements: Methods and pro-
cedures. A SCE Journal of Environmental Engineering, 111(3): 258-271.
Cisse, J. and G.F. Boiling (1971) A study of the trapping and rejection of insoluble particlesduring the freezing of water. Journal of Crystal Growth, 10: 67-76.
Clark, E.E. (1970) Water treatment sludge drying and drainage on sand beds. Department of
Civil Engineering, University of Massachusetts (Amherst), Report EVE 24-70-4.
Clements, G.S., R.J. Stephenson and C.J. Regen (1950) Sludge dewatering by freezing with
added chemicals. Journal of the Institute of Sewage Purification, Part 4: 318-337.
Corte, A.E. (1962) Vertical migration of particles in front of a moving freezing plane. Jour-nal of Geophysical Research, 67(3): 1085-1090.
Cox, G.F.N. and W.F. Weeks (1975) Brine drainage and initial salt entrapment in sodiumchloride ice. USA Cold Regions Research and Engineering Laboratory, Research Report
345. ADA 021 765.
Doe, P.W., D. Benn and L.R. Bays (1965) The disposal of wastewater sludge by freezing.
Journal of the Institute of Water Engineering, 19(4): 251-287.
Environment Canada (1979) Cold climate utilities delivery design manual. Report EPS
3-WP-79-2i.Ezekwo, G., H. Tong and C.G. Gryte (1980) On the mechanism of dewatering colloidal
aqueous solutions by freeze-thaw processes. Water Research, 14: 1079-1088.
Fair, G.W., J.C. Geyer and A.D. Okun (1968) Water and Wastewater Engineering. New
York: John Wiley and sons, Vol. 2.
Farrell, J.B. (1971) A status report on the utilization of freezing in dewatering of sludges.Reprinted from Proceedingv of the XIII International Congress of Refrigeration, Washing-
ton, D.C. Vol. 1, p. 739-742.
Farrell, J.B., J.E. Smith, R.B. Dean, E. Grossman III and O.L. Grant (1970) Natural freez-ing for dewatering of aluminum hydroxide sludges. Journal of the American Waterworks
Association, 62(12): 787-791.
I ultnn, G.P. (1970) New York community improves water supply system. Water and SewageWorks, May: 144-147.
Glen, J.W. (1974) The physics of ice. USA Cold Regions Research and Engineering Labora-
tory, Cold Regions Science and Engineerinag Monograph IIC2A. ADA 778 009.Gow, A.J. and J.W. Govoni (1983) Ice growth on Post Pond, 1973-1982. USA Cold Re-
gions Research and Engineering Laboratory, CRREL Report 83-4. ADA 126 334.
Halde, R. (1979) Concentration of impurities by progressive freezing. Water Research, 14:
575-580.
Heist, J.A. (1979) Freeze crystallization. Chemical Engineering, May 7: 72-82.
Heldman, D.R. (1974) Predicting the relationship between unfrozen water fraction and tem-perature during food freezing using freezing point depression. Transactions of the ASAE,
Paper no. 72 890.
44

Hernebring, C. and E. Lagesson (1986) Conditioning of sludge by natural freezing (translat-ed from Swedish). Institute for Urban Construction Technology, Department of Water andSewage Technology, University of Lulea, Report No. 27.Honda, T., S. Hiro and K. Yamanishi (1981) Automatic operation of a freeze-thawing anddewatering plant for sewage sludges. Water Science and Technology, 13: 599-604.Hsieh, R.C., L.E. Lerew and D.R. Heldman (1977) Prediction of freezing times for foods asinfluenced by product properties. Journal of Food Process Engineering, p. 183-197.lammartino, N.R. (1975) Freeze crystallization: New water-processing tool. Chemical Engi-neering, 23 June: 92-93.Ingersoll, L.R., O.J. Zobel and A.C. Ingersoll (1954) Heat Conduction. Madison: Universi-ty of Wisconsin Press.Iskandar, I.K. (1986) Effect of freezing on the level of contaminants in uncontrolled hazard-ous waste sites. Part 1: Literature review. USA Cold Regions Research and Engineering Lab-oratory, Special Report 86-19. ADA 172 979.Johnson, M.L. and P.W. Doe (1983) Designing and constructing the Trap Falls water treat-ment plant. Journal of the American Waterworks Association, 75(3): 124-131.Katz, W.J. and D.G. Mason (1970) Freezing methods used to condition activated sludge.Water and Sewage Works, April: 110-114.Kreith, F. (1973) Principles of Heat Transfer. New York: Harper Row Publishers, 3rd ed.Kreith, F. and J.F. Kreider (1978) Principles of Solar Engineering. New York: McGraw Hill.Kuo, V.H.S. and W.R. Wilcox (1973) Removal of particles by solidification. Industrial andEngineering Chemistry Process Design and Development, 12(3): 3 ?t-379.Logsdon, G.S. (1971) The mechanism of water plant sludge dewatering by freezing. Ph.D.thesis, Sever Institute of Science, Washington University.Logsdon, G.S. and E. Edgerly, Jr. (1971) Sludge dewatering by freezing. Journal of theAmerican Waterworks Association, 63(11): 734-740.Lunardini, V.J. (1981) Heat Transfer in Cold Climates. New York: Van Nostrand Reinhold.Lunardini, V.J., J.R. Zisson and Y.C. Yen (1986) Experimental determination of heat trans-fer coefficients in water flowing over a horizontal ice sheet. USA Cold Regions Research andEngineering Laboratory, CRREL Report 86-3. ADA 170 427.Mahoney, P.F. and W.J. Duensing (1972) Precoat vacuum filtration and natural-freeze de-watering of alum sludge. Journal of the American Waterworks Association, 64(10): 665-669.Medding, W.S. (1969) Lagoon disposal of water treatment plant wastes. M.S. thesis, Vir-ginia Polytechnic Institute, Blacksburg.Mellor, J.D. (1978) Fundamentals of Freeze-Drying. London: Academic Press.Metcalf and Eddy, Inc. (1979) Wastewater Treatment/Disposal/Reuse. New York: McGrawHill, 2nd ed.Morin, W., R. Lewandowski and R. Zaloum (1986) Le traitement des boues a l'aide du gel-degel naturel et epandage des boues en foret. Draft report for Environment Canada, Mon-treal.National Oceanic and Atmospheric Administration (1984) Local climatological data; An-nual summaries for 1984. Part V: Alaska and Pacific regions. National Climatic Data Cen-ter, Asheville, North Carolina.Nebiker, J.H. (1967) Drying of wastewater sludge in the open air. Journal of the Water Pol-(ution Control Federation, 39(4): 608-626.Nebiker, J.H., T.G. Sanders and D.D. Adrian (1968) An investigation of sludge dewateringrates. In Proceedings of the 23rd Annual Purdue Industrial Waste Conference, Purdue Uni-versity, Lafayette, Indiana, p. 832-848.Penman, A. and D.W. Van Es (1973) Winnipeg freezes sludge, slashes disposal costs ten-fold. ASCE Civil Engineering, November: 65-67.
45

Poulanne, J. (1980) An application of natural sludge dewatering at small sewage treatmentplants in Finland. In Characterization, Treatment and Use of Sewage Sludge. Proceedings ofthe Second European Symposium, 21-23 October, Vienna (L'Hermite and Ott, Ed.). p.107-117.Ramsay, J.F. (1971) A model to describe the natural freezing of water and wastewater treat-ment plant sludges. M.S. thesis, University of Massachusetts (Amherst).Randall, C.W. (1978) Butane is nearly "ideal" for direct slurry freezing. Water and WastesEngineering, 15(3): 43-49.Randall, C.W., M.Z. Ali Khan and N.T. Stephens (1975) Waste activated sludge condition-ing by direct slurry freezing. Water Research, 9: 917-925Reed, S., J. Bouzoun and W. Medding (1985) A rational method for sludge dewatering viafreezing. Journal of the Water Pollution Control Federation, 58: 911-917.Rose, A. and R.F. Sweeney (1963) Wastewater renovation. Part 2: Feasibility tests of freez-ing. Public Health Service, Cincinnati, Report No. 999-WP-4.Rush, R.J. and A.R. Stickney (1979) Natural freeze-thaw sewage sludge conditioning anddewatering. Environment Canada, Report no. EPS 4-WP-79-1.Sanders, T.G. (1968) A mathematical model describing the gravity acwatering of wastewatersludge on sand drying beds. M.S. thesis, University of Massachusetts (Amherst).Schleppenbach, F.X. (1984) Watcr filtration at Duluth. U.S. Environmental ProtectionAgency, Cincinnati, Report EPA-600/2-84-083.Sedgwick, W.T. (1903) Principles of Sanitary Science and the Public Health. Ncw York:MacMillan, p. 2J-262.Sewerage Commission of the City of Milwaukee (1971) Evaluation of conditioning and de-watering sewage sludge by freezing. U.S. Department of Commerce, Springfield, Virginia,NTIS PB-213-122.Tilsworth, T. (1972) Sludge production and disposal for small cold climate bio-treatmentplants. U.S. Department of Commerce, Springfield, Virginia, NTIS PB-219-980.Uhlman, D.R., B. Chalmers and K.A. Jackson (1964) Interaction between particles and asolid/liquid interface. Journal of Applied Physics, 35(10): 2986-2992.U.S. Government Printing Office (1968) Climatic Atlas of the United States. Washington,D.C.Vol'khin, V.V. and E.I. Ponomarev (1965) Effect of freezing on the properties of coagulat-ed metal hydroxides. 5. Mechanism of process. Colloid Journal of the U.S.S.R. (KolloidnyiZhurnal), 27(1): 10-13.Water Pollution Control Federation (1983) Sludge dewatering. Manual of Practice 20,Washington, D.C.Water Pollution Control Federation (1982) Highlights, 19(7): 3.
46

APPENDIX A: SLUDGE FREEZING AT THE SALEM, NEW HAMPSHIRE,WASTEWATER TREATMENT PLANT
BackgroundThe Salem, New Hampshire, Wastewater Treatment Plant was a secondary wastewater
treatment plant with an average daily design flow of 9235 m3/day. Sludge produced by theplant was anaerobically stabilized in two digesters and then applied to sand drying beds forfinal dewatering. There were four beds, each 31 m long by 12.7 m wide. After drying, sludgewas raked by hand and removed for ultimate disposal. The plant was shut down in August1986 because of a consistently overloaded trickling filter that caused odors and complaintsfrom nearby residents.
J. Scafidi, Plant Superintendent, became interested in sludge freezing during the winter of1985-86 when his digesters became full. He had no place to put the sludge and was consider-ing the expense of hiring a septage pumper to transport it to a disposal site. He came acrossthe report by Reed et al. (1985) that discussed the merits of freezing. He contacted Reed, whorelayed the message to me that Scafidi was willing to conduct full-scale sludge freezing exper-iments on the existing sand drying beds. We agreed to assist him since it would provide datafor validation of the sludge freezing model.
Preliminary investigationsBefore applying sludge to the beds I wanted to inspect the site and take core samples. On
22 January 1986 1 traveled to the site and met Scafidi and J. Olofsson, Project Manager of Gand Underwood Engineers, Inc. This engineeing firm operated the plant under contract fromthe City of Salem.
All four beds contained sludge that had already frozen. Two core samples were taken frombed 2, which had received a "double load" of sludge on 7 November 1985. Each core was17.8 cm long, 15.2 cm of which was frozen sludge. The remaining 2.6 cm was clear ice locat-ed at the top of the core. One core sample was taken from bed 3, which had received sludgeon 10 December 1985. The depth of sludge in this bed was 11.4 cm, 6.4 cm of which wassludge with the remainder being clear ice, again at the top. The re.naining beds (I and 4) werenot sampled because they had received sludge applications earlier in the year and were al-ready dewatered.
The core samples were taken into the plant laboratory where drainage tests were conduct-ed in a modified Imhoff settling cone. This test is described in the "Sacramento Course" andprovides a relative measure of drainability. According to this test, a well-drained sludgeshould produce 100 mL of filtrate within 30 hours. A sample of freeze-thaw conditionedsludge produced 100 mL in less than 10 minutes. This was further proof of the value offreeze-thaw conditioning. A photo of the drainage cone is shown in Figure Al.
Layer freezing testsThree layers were frozen during the winter of 1985-86. The initial temperature of the
sludge was 20'C and the average solids content was 5.707o for all three layers. A maximum-minimum thermometer was used to measure air temperatures during the freezing experi-ments.
47

Figure A 1. Settling cone used to measuredrainability of freeze-thaw conditionedsludge at Salem, New Hampshire.
Layer IApplication of layer I began at 1040 and ended at 1100 on 22 January 1986. The thickness
of the layer ranged from 4.4 cm at the far end of the bed to 14 cm at the inlet end. Figure A2shows photos taken of bed 4 during application of this layer.
Freezing progresse normally until the 26th when 3.3 cm of rain fell on the bed. The rainmelted the previously frozen sludge and flooded the drying bed. On the 27th the water drainedaway through a sinkhole in a corner of the bed, leaving a compacted sludge layer only 4 cmthick. Freezing of this layer was completed by the 30th. According to temperature records,14.4°Coday were required to freeze this layer.
Layer 2Layer 2 was applied to bed 3 instead of bed 4 because the sludge in bed 4 was almost at the
same level as the invert of the sludge inlet pipe. Applied at 1030 on 31 January, layer 2 wasapproximately 12 cm thick. On 2, 5, 11 and 17 February, 7.6, 7.6, 2.5 and 5 cm, respectively,of snow and snow mixed with freezing rain fell on the bed. This mixture formed a granularsnow layer 5 cm thick on top of the sludge layer.
When I visited the plant on 20 February, layer 2 was frozen at the far end of the bed. Atthe inlet end, the layer was completely frozen except for approximately 1.0 cm near the bot-tom of the layer. Based on plant temperature records, 69°C.day were needed to freeze thislayer.
Layer 3To observe the flow characteristics of anaerobically digested sludge, layer 3 was applied to
bed 4 on 20 February. It took 33 minutes for the sludge to traverse the length of the bed. Theheavier sludge accumulated near the inlet while the lighter sludge and supernatant moved
48
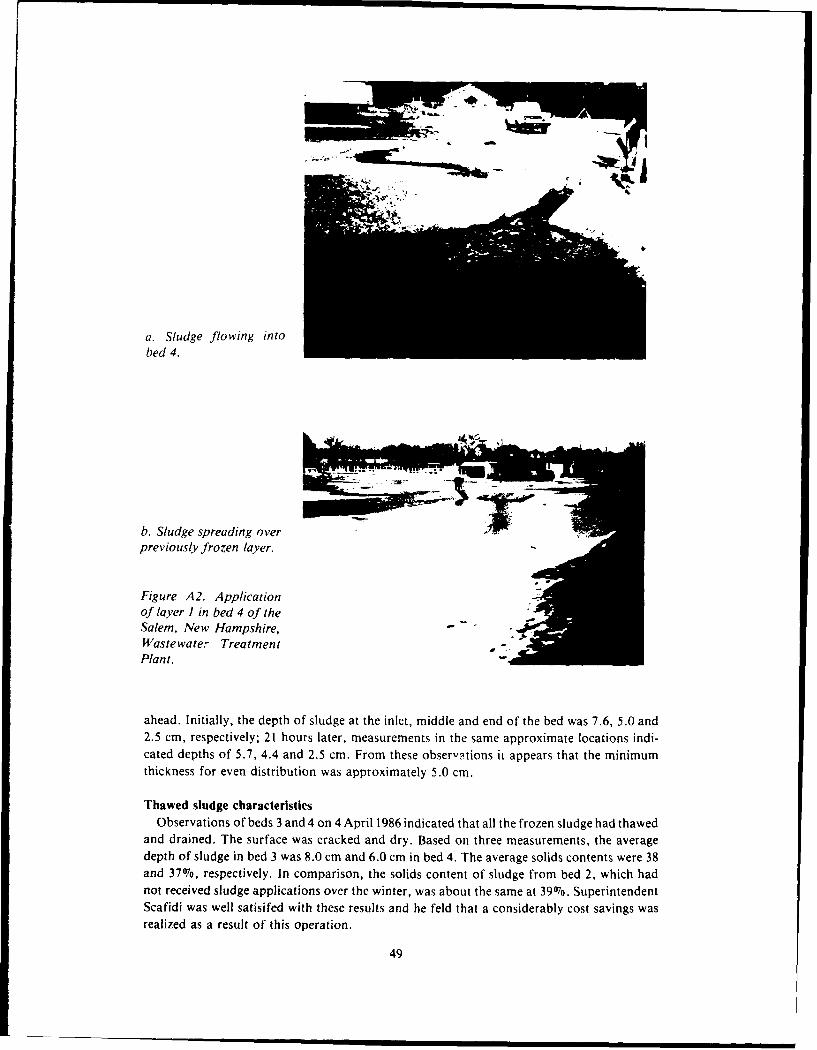
a. Sludge flowing intobed 4.
b. Sludge spreading overpreviously frozen layer.
Figure A2. Applicationof layer 1 in bed 4 of theSalem, New Hampshire,Wastewater TreatmentPlant.
ahead. Initially, the depth of sludge at the inlet, middle and end of the bed was 7.6, 5.0 and2.5 cm, respectively; 21 hours later, measurements in the same approximate locations indi-cated depths of 5.7, 4.4 and 2.5 cm. From these obser",!tions it appears that the minimumthickness for even distribution was approximately 5.0 cm.
Thawed sludge characteristicsObservations of beds 3 and 4 on 4 April 1986 indicated that all the frozen sludge had thawed
and drained. The surface was cracked and dry. Based on three measurements, the averagedepth of sludge in bed 3 was 8.0 cm and 6.0 cm in bed 4. The average solids contents were 38and 37%, respectively. In comparison, the solids content of sludge from bed 2, which hadnot received sludge applications over the winter, was about the same at 3907o. SuperintendentScafidi was well satisifed with these results and he feld that a considerably cost savings wasrealized as a result of this operation.
49

A facsimile catalog card in Library of Congress MARC format is reproducedbelow.
Martel, C. James.Developent and design of sludge freezing beds / by C. James Martel. Han-
over, N.H.: U.S. Army Cold Regions Research and Engineering Laboratory;Springfield, Va.: available from National Technical Information Service, 1988.
v, 58 p., illus., 28 cm. (CRREL Report 88-20.)Bibliography: p. 43.1. Freeze-thaw conditioning. 2. Sewage treatment. 3. Sludge dewatering.
4. Sludge freezing. I. United States Army. II. Corps of Engineers. IlI. Cold Re-gions Research and Engineering Laboratory. IV. Series: CRREL Report 88-20.
U. 5. 4OVERNMENT PRINTINr OFFICE: 1989--600-057--82076