Embed Size (px)
Citation preview

1
Research support to the Fagerberg Committee
International comparison of goal-oriented public governance in research policy
Erik Arnold25 October 2010

2
An international comparative analysis
• The team has been busying itself with desk research to answer the study questions, for each of our seven countries• Canada, Denmark, Finland and The Netherlands• New Zealand, Sweden and the UK
• The work has been organised around the seven topics listed in the study specification1. Description of research systems and allocation of funding2. Efficiency of the research performing sectors3. Research education4. Research funding mechanisms and criteria5. Monitoring performance of research grants6. Cataloguing research production7. Examples of successful goal-oriented research policy

3
Progress to date• The team has produced draft reports for the seven countries
• Each paper is organised using a common structure, written around the seven topic areas
• The seven papers have been compiled in a compendium, which will form an annex to our final report
• The team has begun to carry out horizontal analyses of each topic, in order to develop our synthesis and final report
• The team is drawing on the facts and figures in the individual country papers and cross-referencing this empirical material with more conceptual and evaluative material where practicable
• We have so far produced 4 of our seven cross-sectional papers• Research efficiency, research education, funding mechanisms, monitoring of grants• The three other papers are in progress• We have also been compiling selected international statistics, principally from the
OECD MSTI to help structure the synthesis
• We have taken three of these cross-sectional papers and turned these into a series of slides, to show preliminary results and illustrate our treatment of the questions

4
Progress (Vertical analysis)
• Draft Reports and research focusing on the countries
Country
New Zealan
d
Netherlands
Finland Sweden UK Denmark
Canada
Question
Q1 √ √ √ √ √ √ √
Q2 √ √ √ √ √ √
Q3 √ √ √ √ √ √ √
Q4 √ √ √ √ √ √ √
Q5 √ √ √ √ √ √ √
Q6 √ √ √ √ √ √ √
Q7 √ √ √ √ √ √

5
Progress (Horizontal Analysis)
• Draft reports and research focusing on the questions
Country New Zealan
d
Netherlands
Finland
Sweden
UK Denmark
CanadaQuestion
Q1
Q2 √ √ √ √ √ √ √
Q3 √ √ √ √ √ √ √
Q4 √ √ √ √ √ √ √
Q5 √ √ √ √ √ √ √
Q6 √ √ √ √ √ √ √
Q7

6
Context – Research Policy Goals
• High-level goals determined at government level• Research typically comes under responsibility of departments
for education or industry/economics, or a focused ministry for science/ research/technology/ innovation
• Key goal for all countries is research quality
• Further goal is research impact i.e. level of innovation and resultant economic/social benefits –however this latter goal is stated more less explicitly in different countries
• Indicators assigned to government/ ministerial goals and, in some cases, targets set e.g. in UK (for quality, BERD, innovation activity), Denmark (GERD – increase to 3% of GDP). Indicators monitored at regular intervals (e.g. annual in UK)
• Hierarchy of goals filters down to funding agencies, with appropriate indicators set at each level that link back to key goal of research quality (and innovation where required)
7
Context – Research Quality and Impact
• Research Quality:• Assessed via peer review and/or objectives metrics such as
bibliometrics, external research
• Research Impact:• At national level this is determined indirectly via, for
example, innovation indicators• UK currently attempting to assess/measure research impact
at HEI/ research group level via a system based on representative case studies
• Assessment of quality and/or impact can be used to:
• Determine effectiveness of policy
• And/or to assign( future) research funds

8
Topic 2 – The efficiency of research administration
• Information on the research performing sectors with regard to spending of funds for research versus spending of funds for research administration, and on the development of this over time.
9
2.1 – Research efficiency• We began with an hypothesis that an increasingly goal-oriented approach to the governance
of research policy might require proportionately more administrative effort• To determine where to invest, whether due to anticipated future challenges or measured, past
performance• To confirm that those investments have been expended as planned and that they have produced the
outputs and outcomes sought
• Following a wide-ranging review, we concluded that we could not answer this question in any definitive sense
• The only international statistics of any relevance were the OECD data on total R&D personnel by occupation and by research performing sector
• These statistics are still somewhat limited however• They do not include staff within central administrations (e.g. the 5-person team working in a university
research office helping bid EU RTD FP calls or addressing research performance exercises) • Nor can headcount statistics differentiate between research and research administration within an broad
occupational grouping (e.g. a professor standing as a member of a peer-review panel)
• We found no studies, in any of the 7 countries, which investigated this phenomenon, however we did find several studies that looked at narrow aspects of research costs
• Academic and other community-wide consultations express concern about the additional burden of performance-based funding as compared with the more traditional, self-regulated system where peer review of grant applications and books / articles governs all
• The UK government did commission a study of the costs (cash and in-kind) of the research assessment exercise and peer review, which found the former amounted to around 1% of the science budget annually while the latter amounted to 10%
10
2.2 – Trends in research employment
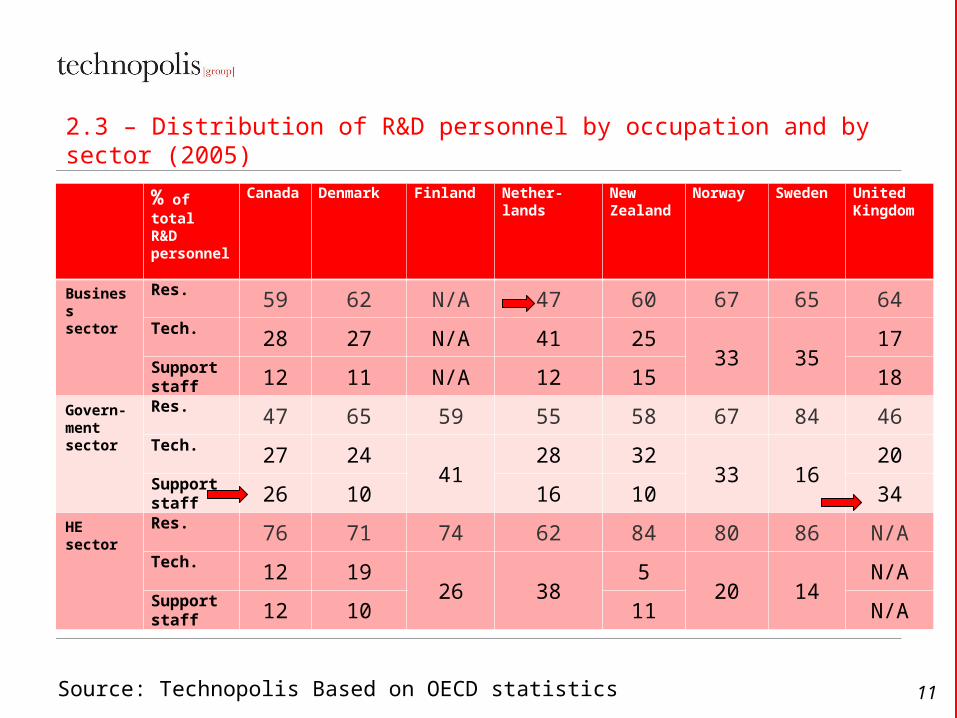
• The OECD statistics for 2005 suggest that research administrators account for• 10-20% of headcount in business• 10-35% of the headcount in the government / institute sector• 10-12% in the HE sector (data are patchier here)
• The previous years’ data (previous 5 years) show that• Almost every sector in every country has decreased the % of support staff over
time• Almost every sector in every country has increased the % of researchers over time• The %of technicians has been broadly stable
• The data suggest that all organisations, particularly business, have been striving to improve efficiency of their research spend by reducing in-house support staff
• We can draw no strong conclusions here however, due to • The data limitations (occupational headcounts, technical change or outsourcing of
administrative functions) and• The vintage of these data, which pre-date the gathering global commitment to
switch to a more goal-oriented approach to the governance of research policy
11
2.3 – Distribution of R&D personnel by occupation and by sector (2005)
% of total R&D personnel
Canada
Denmark Finland Nether-lands
New Zealand
Norway Sweden United Kingdom
Business sector
Res. 59 62 N/A 47 60 67 65 64Tech. 28 27 N/A 41 25
33 3517
Support staff 12 11 N/A 12 15 18
Govern-ment sector
Res. 47 65 59 55 58 67 84 46Tech. 27 24
4128 32
33 1620
Support staff 26 10 16 10 34
HE sector
Res. 76 71 74 62 84 80 86 N/ATech. 12 19
26 385
20 14N/A
Support staff 12 10 11 N/A
Source: Technopolis Based on OECD statistics

12
2.4 – Research efficiency (methodology, definitions)• Using OECD data on types of personnel in R&D, we can determine
the percentage of support staff, researchers, and technicians in a given sector and over time (1981 onwards).
• Definitions• Researchers- Staff engaged in the conception and/or creation of new
knowledge /products. Personnel involved in the planning or management of scientific and technical aspects of R&D projects, and software developers.
• Technicians- Staff engaged in technical tasks in support of R&D, normally under the direction and supervision of a researcher.
• Support Staff- Includes administrative and managerial staff working on, or directly associated with, R&D activity. Does not include staff outside the R&D performing unit providing indirect support. For example central finance or personnel services and central support services e.g. information services and cleaning.
• Combined with qualitative analysis, from desk research• National and institutional Annual Report data is of very limited use
because administration staff / expenses are not solely for research
12

13
Topic 3 – Research education
• Information on how recruitment to research (research education) is organized/financed, and by which criteria PhD scholarships are funded (if applicable).

14
3.1 – Funding mechanisms for doctoral training
• 5 of 7 countries (all but UK & Canada) allocate block grants to universities to allocate to departments and doctoral researchers – with varying degrees of direction from funding bodies
• 2 countries (UK & Finland) also have a competitive element for doctoral programmes – open competition in Finland, in UK the allocation dependent on research council (competitive) grant income
• In 5 of 7 cases, Government funding covers university costs in full through employment contracts or grants
• In Canada and the UK, a substantial proportion of the costs is covered by fees (20-30%)
• In the UK, 20-30% of total costs are covered by the universities through fee waivers, with some cross-subsidy from international students and from student contributions to the execution of research council-funded projects
• In a proportion of cases, stipends to doctoral researchers• Some additional funding from industry for individual doctoral researchers

15
3.2 – Criteria for doctoral training
• Criteria:• Block grant to institutions – various combinations of capacity
& quality measures (typically based on the same method used to allocate block research grants – e.g. NZ bases doctoral allocation on same quality measure (PBRF) as block research grants)
• Competitive doctoral programmes• UK: based on competitive grant income from each research
council• Finland: open competition – review and selection by funding
agency
• Doctoral applicant quality – undergraduate relevance and performance, academic/ employer references, interview – fairly standard approach across all countries

16
Topic 4 – The basis for the allocation of public funding
• Information on which criteria and mechanisms form the basis for allocation of public funding for research in the different performing sectors and or institutions.

17
4.1 – Research funding overview
Quality and Impact of (publicly funded) Research
Funding source:
Over-arching allocation method:
Criteria:
Assessment method:
Objective:
Impact e.g. potential
impact of proposed research projects
Qualitative indicators –Peer review
Capacity/ volume
Quality e.g. quality of past
research
Objective indicators
e.g. no. of outputs bibliometrics
Qualitative indicators
e.g. Peer review
Government R&D
expenditure
Institutional core funding Project funding
Objective
indicators e.g. no. of research
staff
Quality e.g. quality of
individual proposed research
projects
Qualitative indicators –Peer review
and/or

18
4.2 – Funding mechanisms
• For universities• A majority of countries under review has implemented a performance-based funding
mechanism, to improve the international standing of academic research nationally• In 5 of 7 cases, governments allocate a meaningful proportion of total national HE
research income, based on adjudged past performance• Denmark, Finland, NZ, Sweden and the UK operate bimodal systems, providing
institutional funds through a performance-based mechanism and project awards through competitions
• Canada allocates the great majority of its funds for centres or projects, through competitions
• The Netherlands uses direct funding of institutions by ministry of education and science, combined with competitions / calls
• For research institutes• All countries provide core institutional funding through a negotiated procedure, which is
non-competitive but often linked (softly) to performance targets• Most countries allow institutes to compete for funding within selected national
competitions
• For firms, in all 7 countries, public research funds are awarded through competitive measures, whether that is programmatic calls for proposals or project-specific ITTs
19
4.3 – Performance-based reviews• In all cases, PBRs are national in scope
• They cover all disciplines• They are comprehensive exercises, run periodically, 5 – 7 years• Research quality is the dominant criterion
• In 3 of the 5 countries where PBRs operate, they are built around peer review• In Denmark, the exercise involves objective data only• In NZ, peer review of quality determines 60% of future income while more objective data on
achievements (e.g. external research income and completed degrees) determine the balance• Evaluation processes
• Quantification of achievements (e.g. esteem and prizes won, or appointments secured)• Bibliometric analyses, taking national and international publication and citation data from Thomson
Reuters or Elsevier SCOPUS• Peer review of monographs, journal articles, non-text artefacts etc (e.g. top four articles for each submitted
researcher)
• Evaluation criteria• Research quality (e.g. adjudged excellence, citation rate normalised against average for field
internationally)• Contribution to social and economic benefits (e.g. external research income)• Efficiency / productivity (e.g. degree completions)
• Funding formulae• Usually include volume measures as well as performance measures• Usually provide a non-linear distribution, wherein the best research groups / institutions might be awarded
a multiple of the funding awarded to those groups rated just one scale lower
20
4.4 - Public-sector research competitions
• We find a high-degree of commonality here• All countries provide project-based funding to universities through research competitions
addressing most if not all disciplines, with the aim of maintaining strong disciplines• Targeted or strategic competitions where relevance (to the target) is given equal weight alongside quality
and originality• Response mode often open calls, where quality / originality is the primary criterion• Countries are extending compliance tests around for example verification of approval by appropriate
research ethics / governance committees or the existence of policies relating to environment to diversity• Success rates vary from 20-50%, typically
• All countries operate targeted research programmes some of which are open to institutes or companies and which have strategic objectives (e.g. industrial competitiveness or grand challenges)
• In these cases, the competitions are almost always closely targeted on issues of strategic importance to the country in question
• The evaluation process will typically involve proposals being scored and judged by peer review panels, using a longer list of criteria than one might find in academic competitions
• Relevance, coherence and economy are scored alongside originality and methodological quality• Peer review panels often involve research users as well as researchers• The application process is more likely to operate with multiple stages, perhaps beginning with expressions
of interest, moving on to short proposals score by administrators and invited full proposals being scored and peer reviewed
• Success rates are highly variable, but typically range between 5-30%

21
4.5 – Effectiveness
• Performance-based research assessment systems• We found only one official evaluation of a national system, which is the UK Roberts review of
the RAE2001 (2003)• UK academic papers (e.g. Martin 2009) show improving share of all research output being
rated as internationally outstanding and a gradual concentration of • However, this is a largely national peer-review of national research and OECD citation
statistics don’t show a strong positive trend (Norway / Finland have registered much stronger improvement in previous 20 years, without an RAE)
• NZ and the UK have commissioned independent bibliometric analyses, which suggest performance is being sustained
• Other countries tend make do with a much more limited and aggregate set of citation data taken directly from the OECD MSTI
• Competitions tend to be evaluated indirectly, as part of broader reviews• International disciplinary reviews, wherein international peer review panels will be invited to
judge the quality of a country’s scientific endeavour against their view of the international state of the art (which can include consideration of the effectiveness of instruments). This is seen in Finland, Sweden and the UK
• Programme evaluations, wherein an external, independent review will typically be required to look at both effectiveness and efficiency. The latter is likely to include a test – with ‘users’ and against international benchmarks – of the transparency, fairness and efficacy of the operational arrangements
22
4.6 – Good practice
• Good practice in goal-oriented allocation of research funds remains somewhat subjective (without substantive evaluations of the effectiveness of the specific mechanisms)
• However, the scale, complexity and cultural shift of PBRs does mean that most have been introduced only after wide-ranging consultation
• The arrangements are specified in great detail in most cases, in publicly-available, English language guidance material (DK, NZ, SE, UK)
• The results of consultations are also available in some cases• New departures / refinements have also been extensively piloted and
documented (e.g. UK piloting of the use of bibliometrics, wherein all STEM subjects at 11 HEIs were run through a citation analysis and the results profiled on four points [i.e. below world average for the field, at world average, twice world average and 4 times world average, with the latter being the benchmark for internationally outstanding work])
23
• Increasingly common for a proportion of HERD to be driven by a PBR• 35% of HERD in the UK to 15% in NZ, big enough to cause institutions to conform
• Spectrum in PBR approach• ‘Objective’ (Denmark has implemented a metrics-based approach in past 12 months)• A hybrid approach as in NZ where peer review determines 60% of the marks and metrics the
rest• A moderated approach whereby metrics are provided to peer review panels to inform
judgements
• New criteria in evidence• UK is proposing to allocate up to 25% of future institutional funding against adjudged
performance on research impact (breadth and depth of non-academic inputs as demonstrated by case study)
• Simplification / efficiency projects• UK and NZ pushing hard at streamlining their process (e.g. on-line process for applications and
for peer-review material)• DK chose a metrics-based approach in part to minimise the costs of the new procedure
(although the approach is contingent on a national research cataloguing project to permit the national agency to award ‘bibliometric’ points to universities, e.g. 6 for a monograph, 5 for a thesis)
• Incentives to researchers to take part in peer review processes• UK Research Council (EPSRC) Reviewers Incentive Scheme for academics• Other countries limit for instance the number of reviews (e.g. two calls for participation in the
Academy of Finland)
4.7 – Developments

24
Next steps for the study
• Next steps• Conclude the cross-sectional analyses (last three topics)• Revisit draft country reports to fill key gaps where practicable
and to improve consistency across the seven papers• Complete the synthesis report• Prepare a summary with conclusions (and recommendations?)
• Submit draft report to the Committee by end November 2010
• Today …• Any questions …