Embed Size (px)
Citation preview
1
S. E. TzamariasS. E. TzamariasHellenic Open Hellenic Open
UniversityUniversity
NNeutrino eutrino EExtended xtended SSubmarine ubmarine TTelescope with elescope with OOceanographic ceanographic
RResearchesearch
Readout Electronics Readout Electronics DAQ & Calibration DAQ & Calibration
2
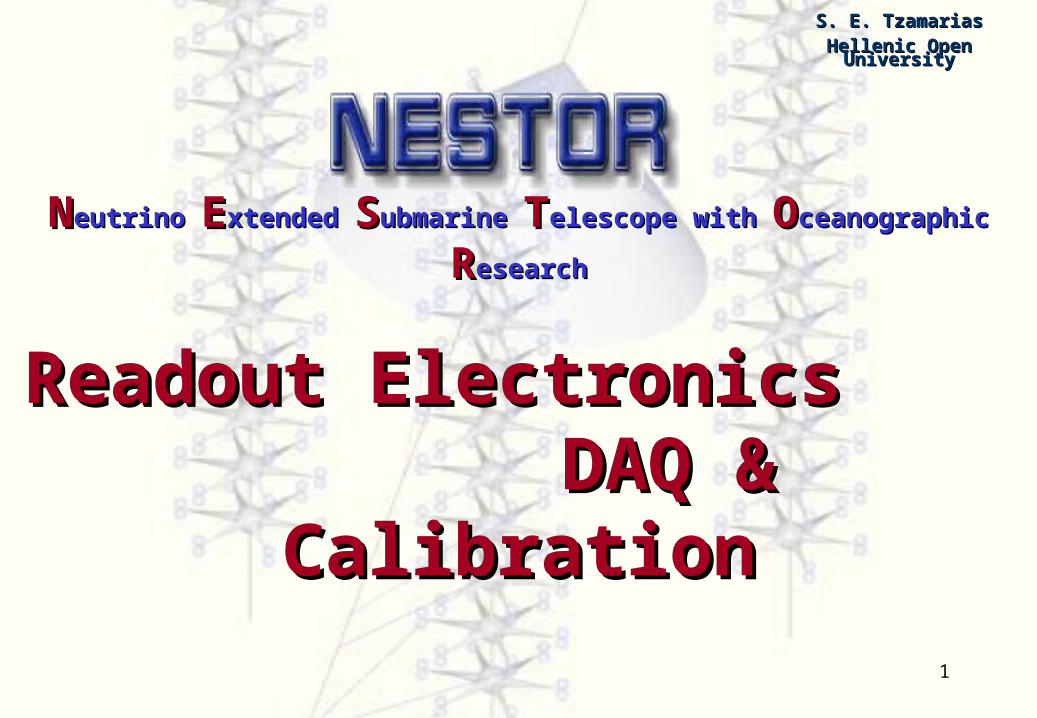
NESTOR TOWERNESTOR TOWER
3
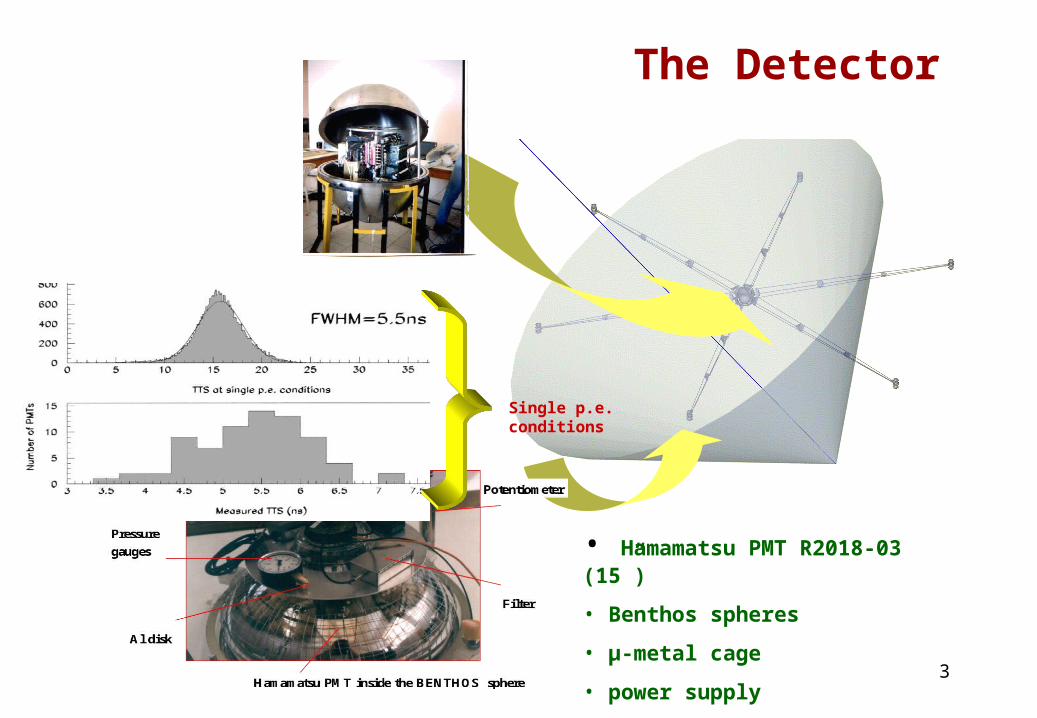
• Hamamatsu PMT R2018-03 (15”)
• Benthos spheres
• μ-metal cage
• power supply
Single p.e. conditions
The Detector
4
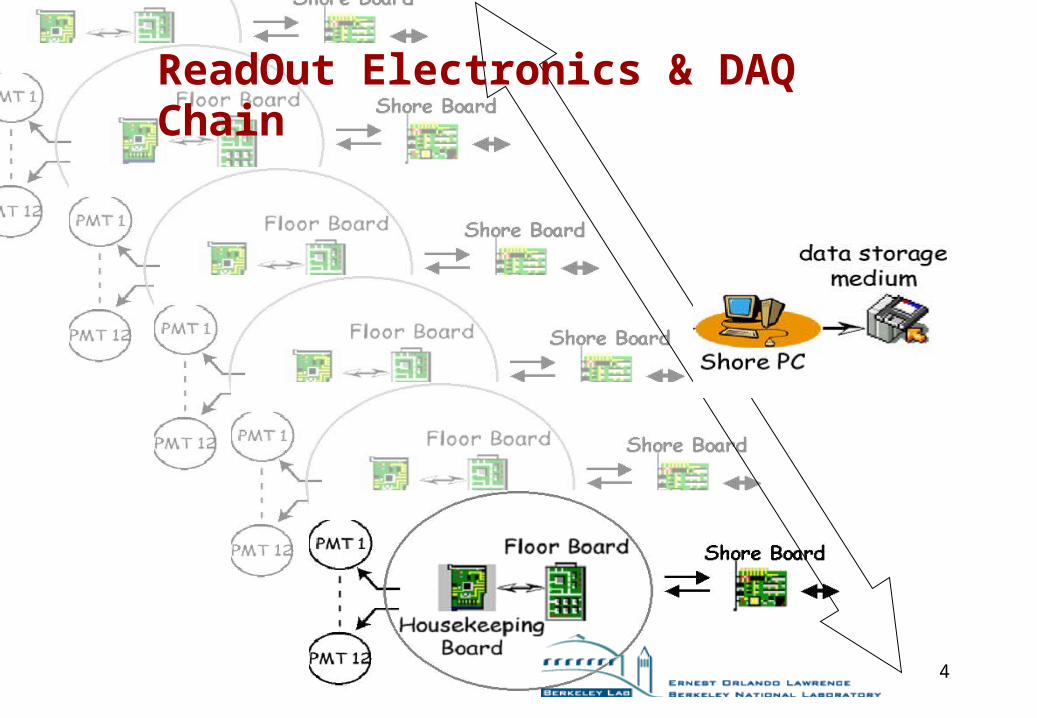
ReadOut Electronics & DAQ Chain
5
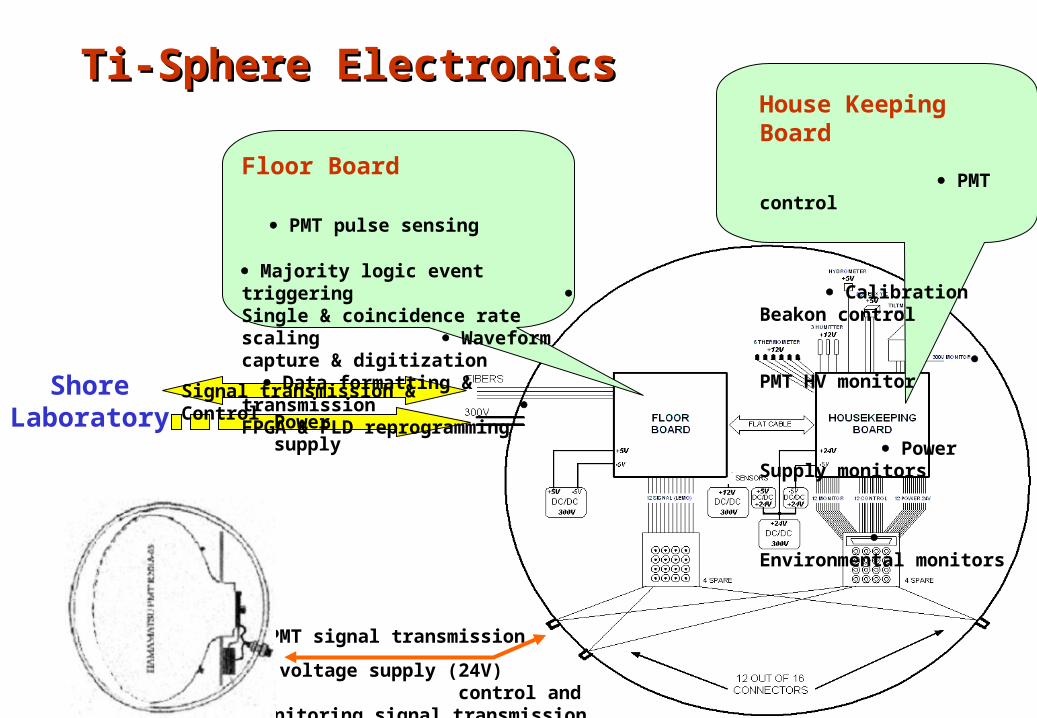
Signal transmission & ControlShore Laboratory Power supply
PMT signal transmission
low voltage supply (24V) control and monitoring signal transmission
House Keeping Board PMT control Calibration Beakon control PMT HV monitor Power Supply monitors Environmental monitors
Floor Board PMT pulse sensing Majority logic event triggering Single & coincidence rate scaling Waveform capture & digitization Data formatting & transmission FPGA & PLD reprogramming
Ti-Sphere ElectronicsTi-Sphere Electronics
6
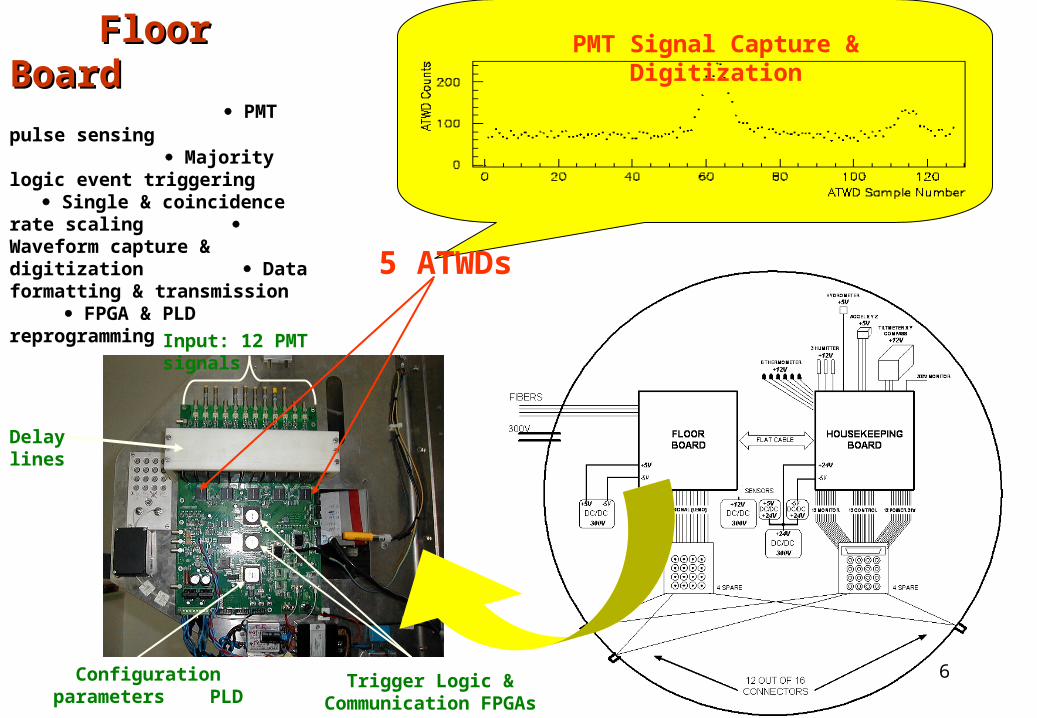
Input: 12 PMT signals
Delay lines
Configuration parameters PLD
Trigger Logic & Communication FPGAs
5 ATWDs
Floor BoardFloor Board PMT pulse sensing Majority logic event triggering Single & coincidence rate scaling Waveform capture & digitization Data formatting & transmission FPGA & PLD reprogramming
PMT Signal Capture & Digitization
7
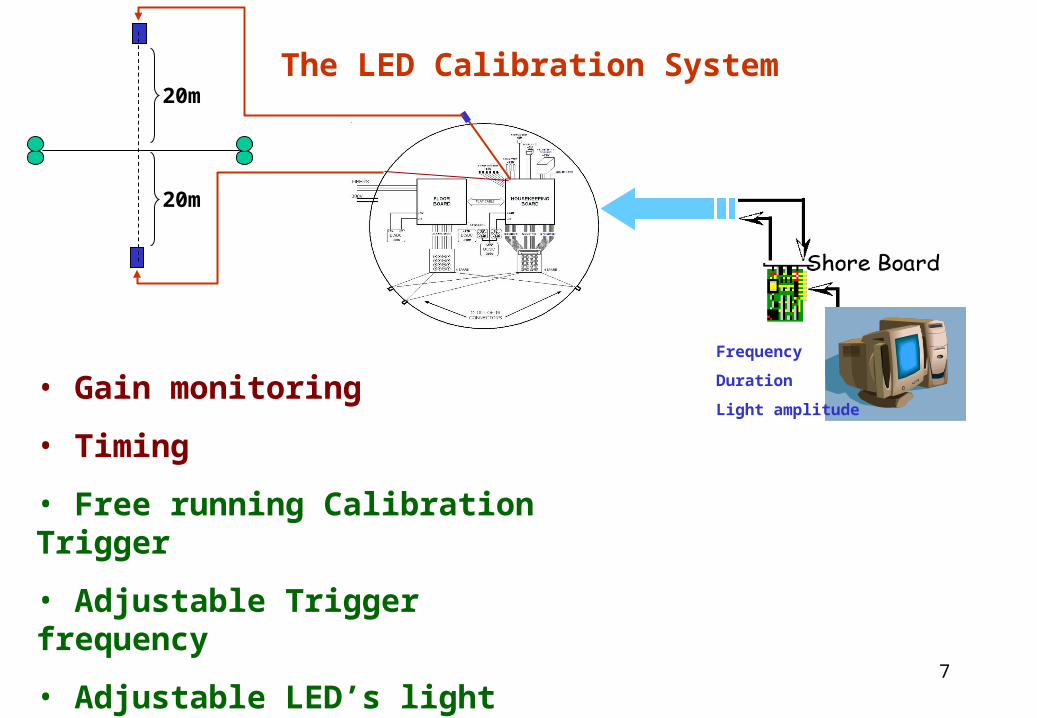
The LED Calibration System
Frequency
Duration
Light amplitude
20m
20m
• Gain monitoring
• Timing
• Free running Calibration Trigger
• Adjustable Trigger frequency
• Adjustable LED’s light output
8
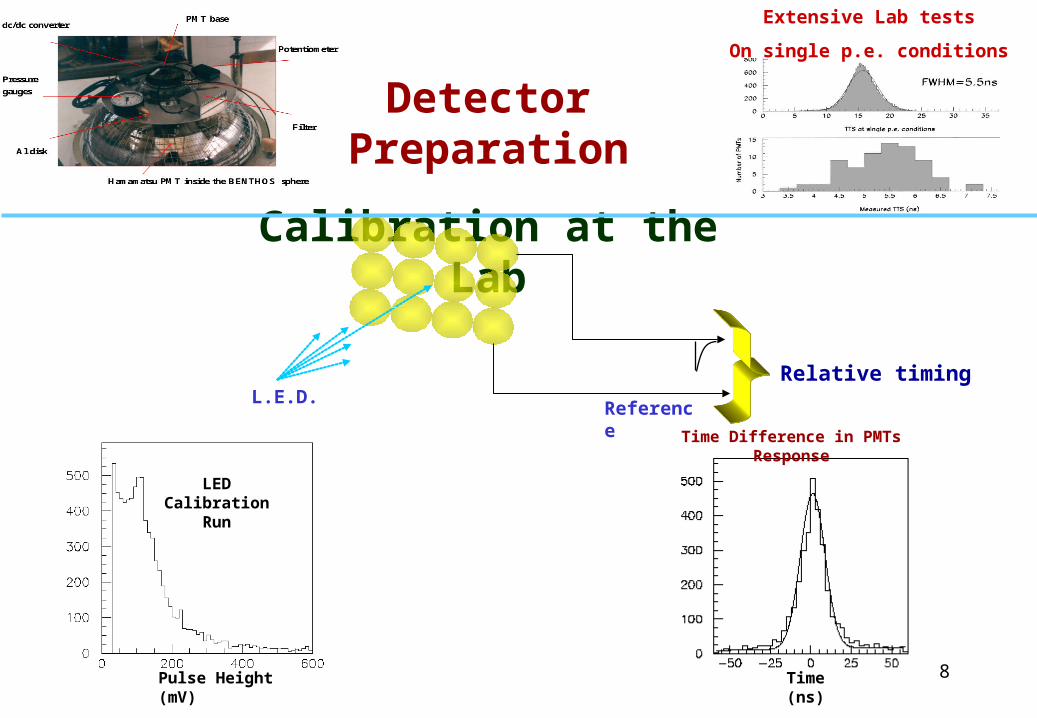
Extensive Lab tests
On single p.e. conditions
Detector Preparation
Calibration at the Lab
L.E.D.Reference
Relative timing
Pulse Height (mV)
LED Calibration Run
Time Difference in PMTs Response
Time (ns)
9
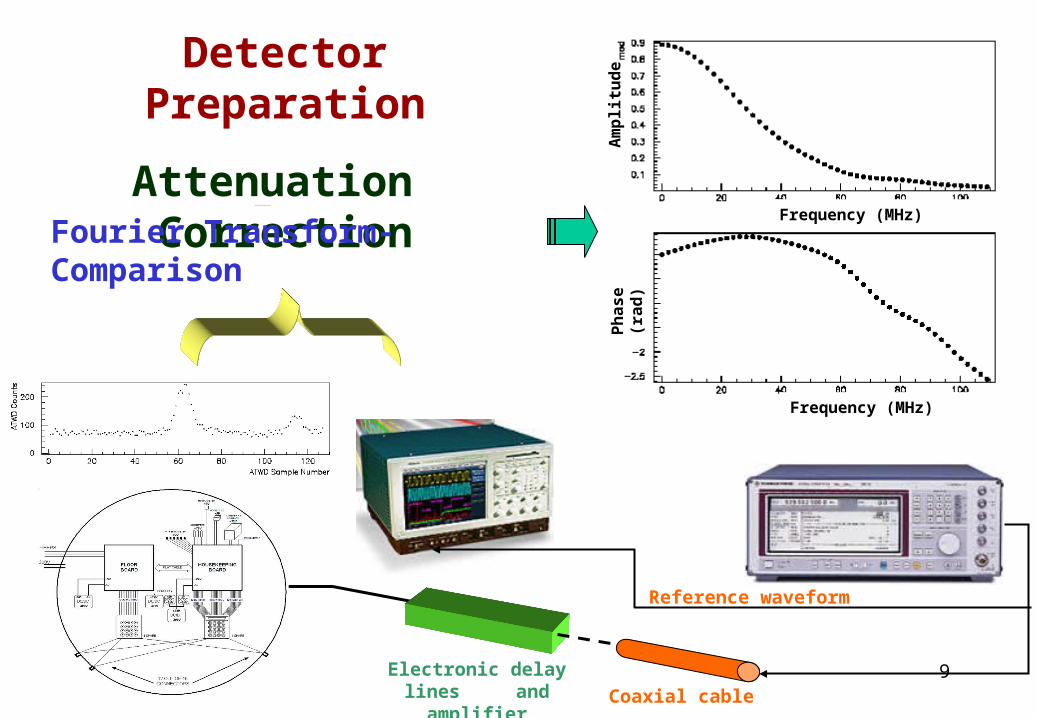
Detector Preparation
Attenuation Correction
Reference waveform
Coaxial cable
Electronic delay lines and amplifier
Fourier Transform-ComparisonFrequency (MHz)
Frequency (MHz)
Ph
ase
(rad
)A
mp
litu
de
10
Num
ber
of P
.E.s
/ s
r /L
ight
Pul
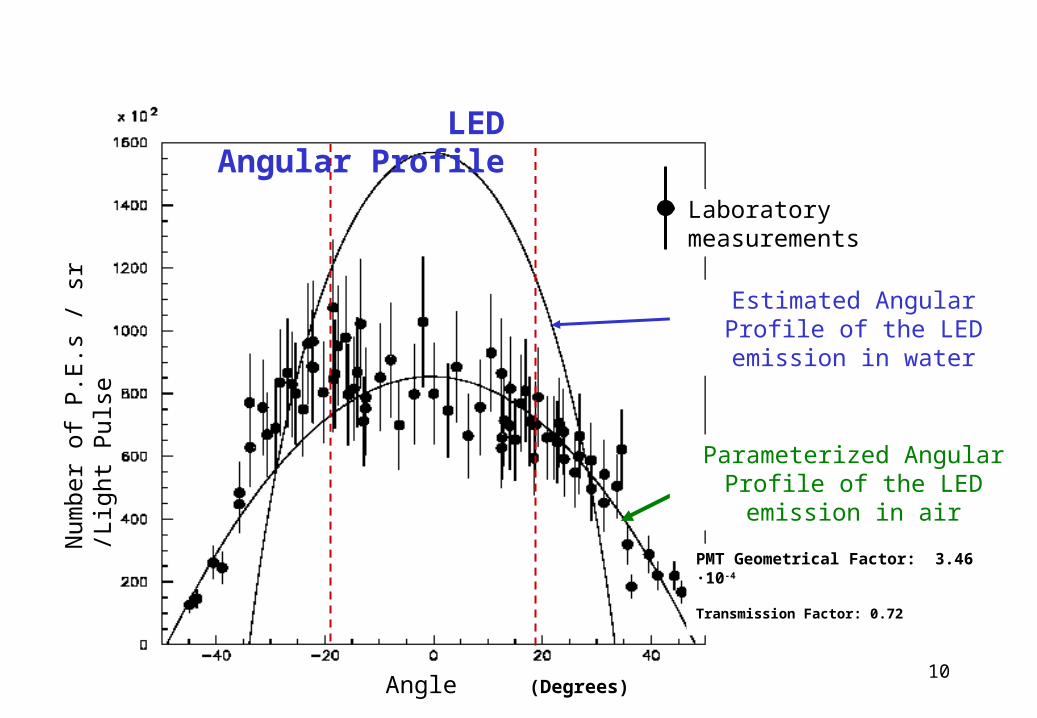
se Laboratory measurements
PMT Geometrical Factor: 3.46 ·10-4
Transmission Factor: 0.72
Parameterized Angular Profile of the LED emission in air
Estimated Angular Profile of the LED emission in water
LED Angular Profile
Angle (Degrees)
11
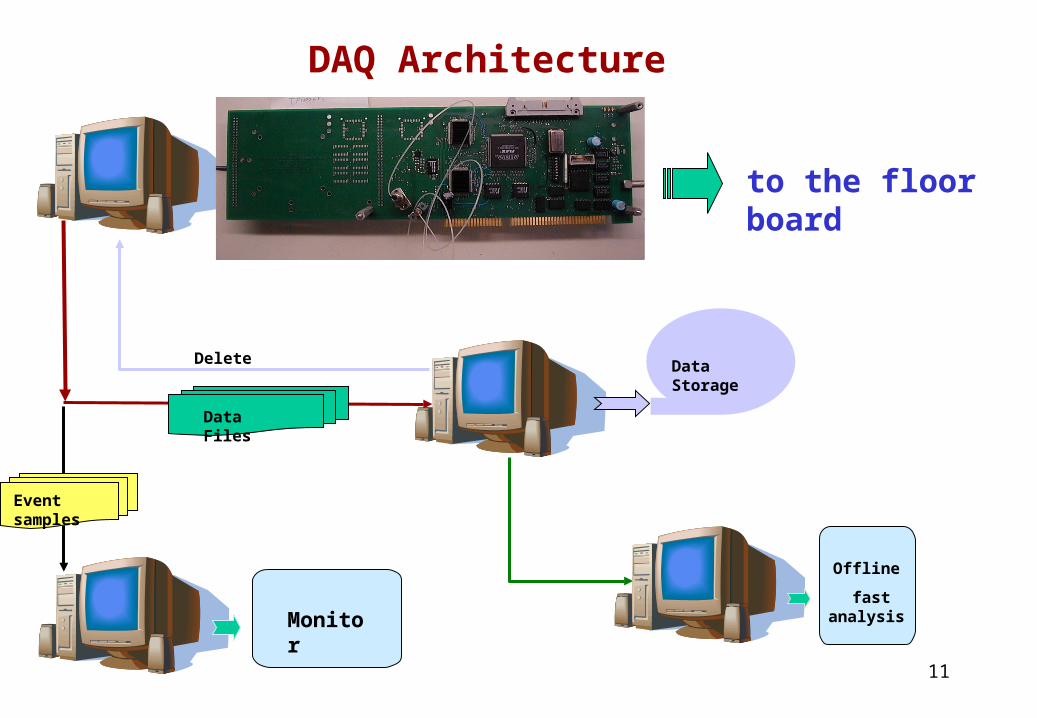
to the floor board
Data Files
Delete Data Storage
Event samples
Monitor
Offline
fast analysis
DAQ Architecture
12
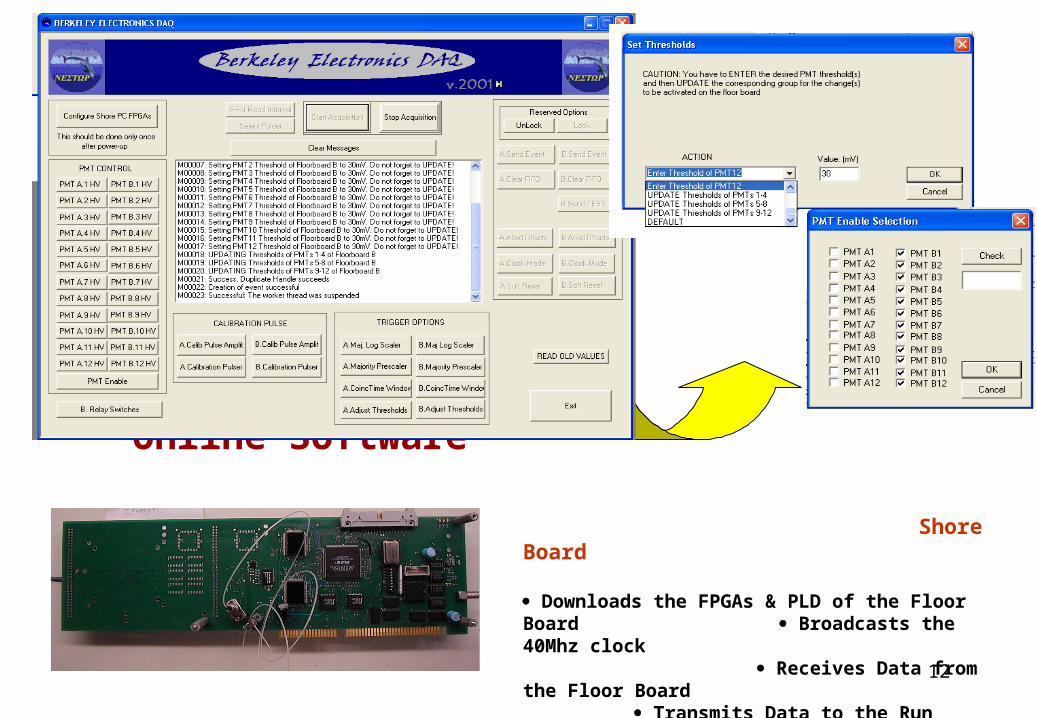
Online Software
Shore Board Downloads the FPGAs & PLD of the Floor Board Broadcasts the 40Mhz clock Receives Data from the Floor Board Transmits Data to the Run Control System
13
Event samples
Monitor
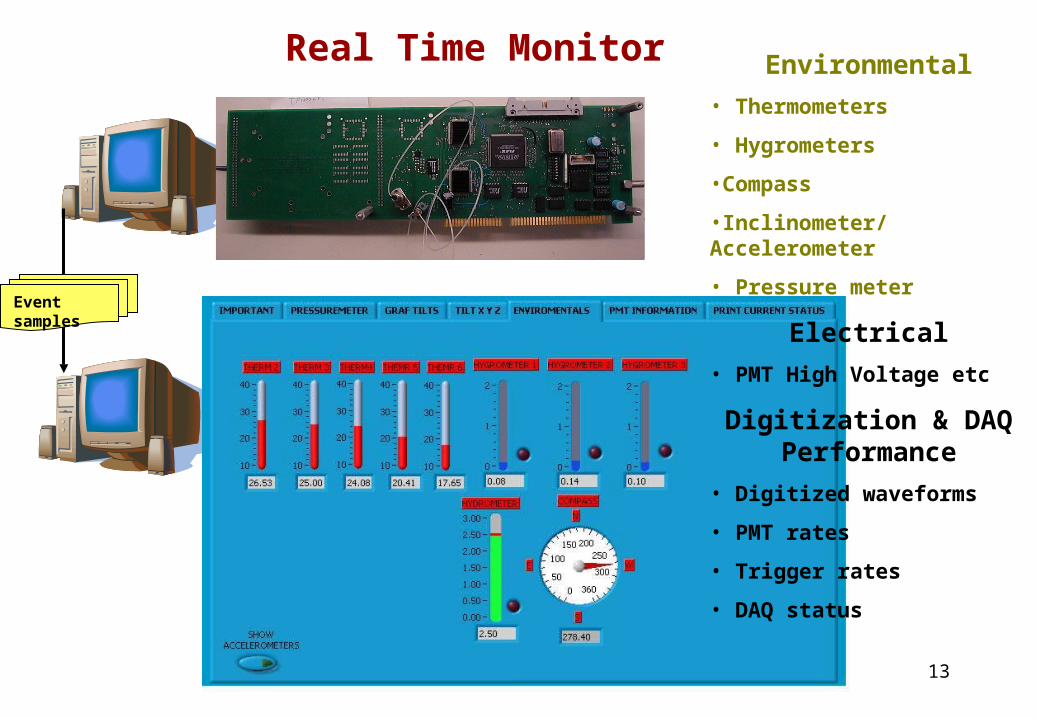
Real Time Monitor Environmental
• Thermometers
• Hygrometers
•Compass
•Inclinometer/Accelerometer
• Pressure meter
Electrical
• PMT High Voltage etc
Digitization & DAQ Performance
• Digitized waveforms
• PMT rates
• Trigger rates
• DAQ status
14
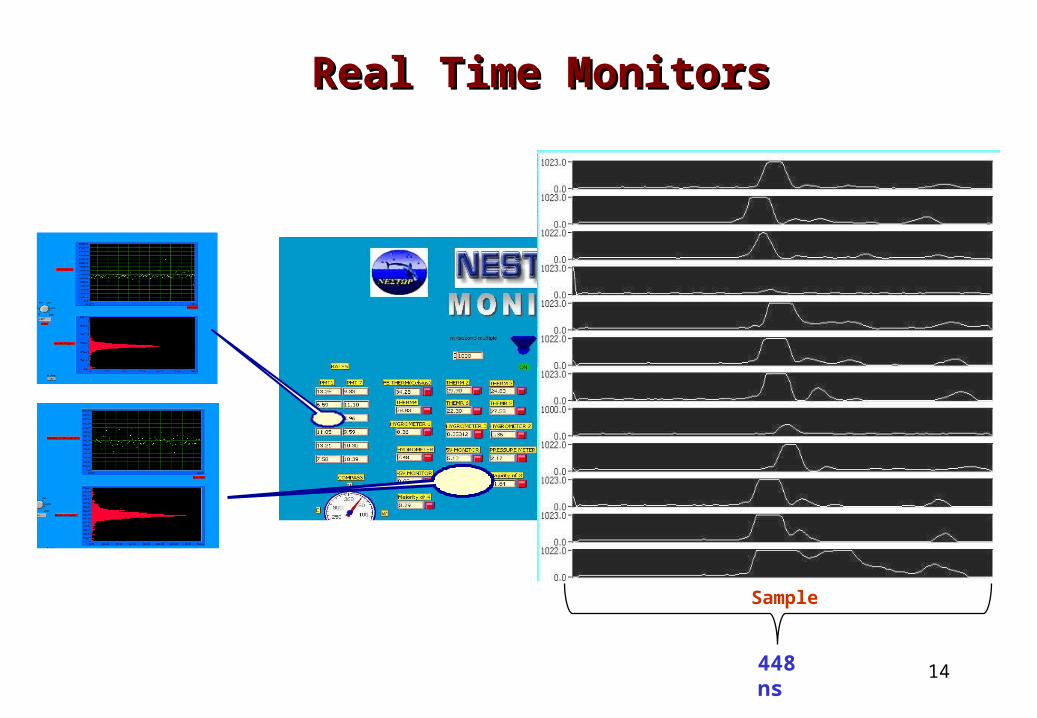
Real Time MonitorsReal Time Monitors
Sample
448 ns
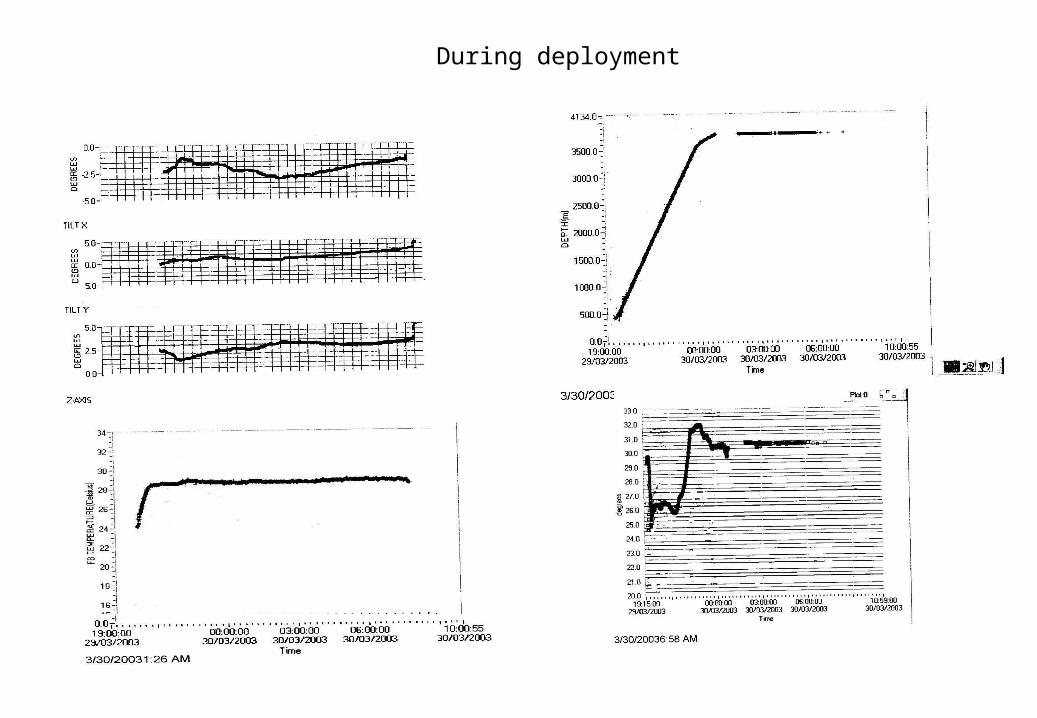
During deployment
16
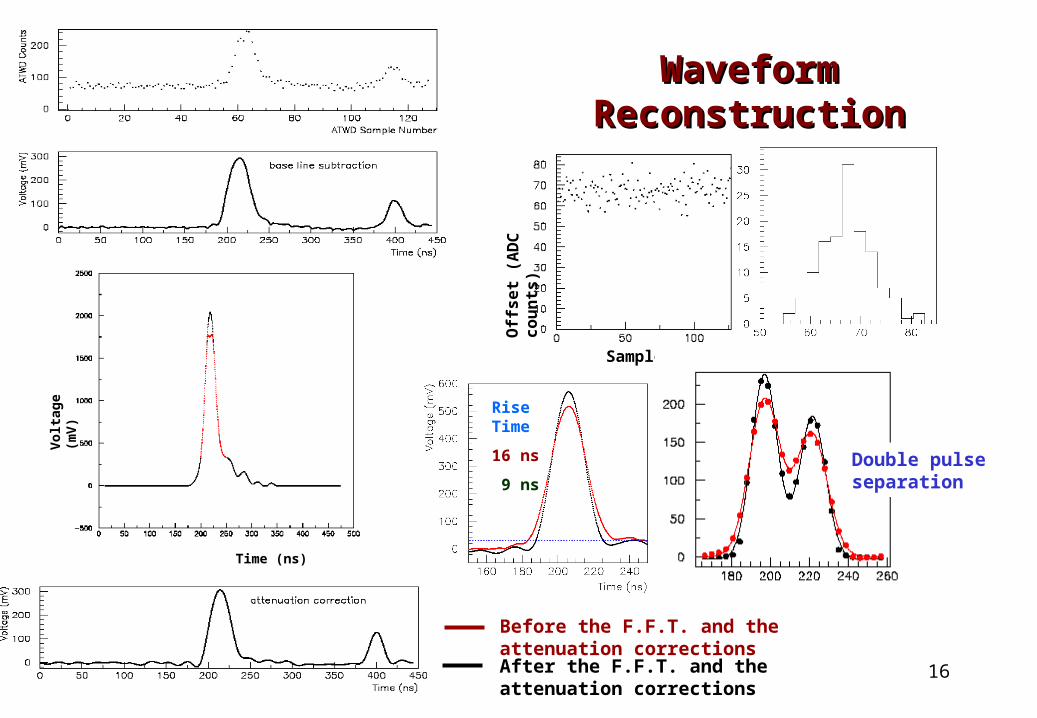
Waveform ReconstructionWaveform Reconstruction
Sample Offset (ADC counts)Sample
Off
set
(AD
C c
oun
ts)
Before the F.F.T. and the attenuation corrections
After the F.F.T. and the attenuation corrections
Rise Time
16 ns
9 ns Double pulse separation
Time (ns)
Vol
tage
(m
V)
17
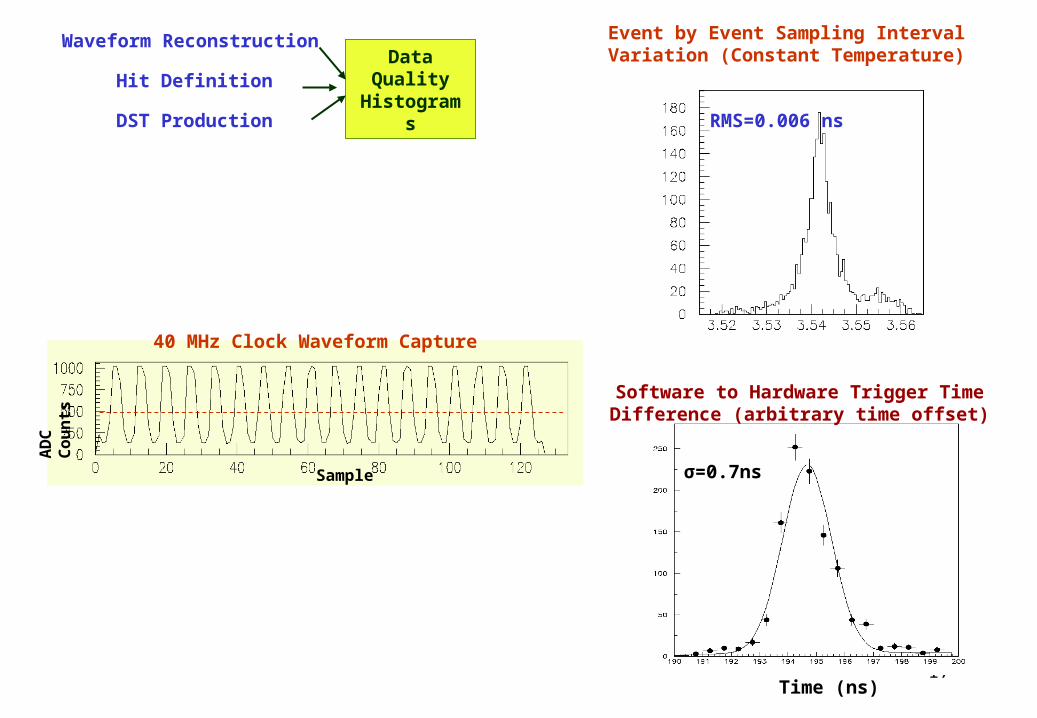
Waveform Reconstruction
DST Production
Hit DefinitionData Quality Histograms
Sample
AD
C C
oun
ts
40 MHz Clock Waveform Capture
Event by Event Sampling Interval Variation (Constant Temperature)
Time (ns)
RMS=0.006 ns
Software to Hardware Trigger Time Difference (arbitrary time offset)
σ=0.7ns
18
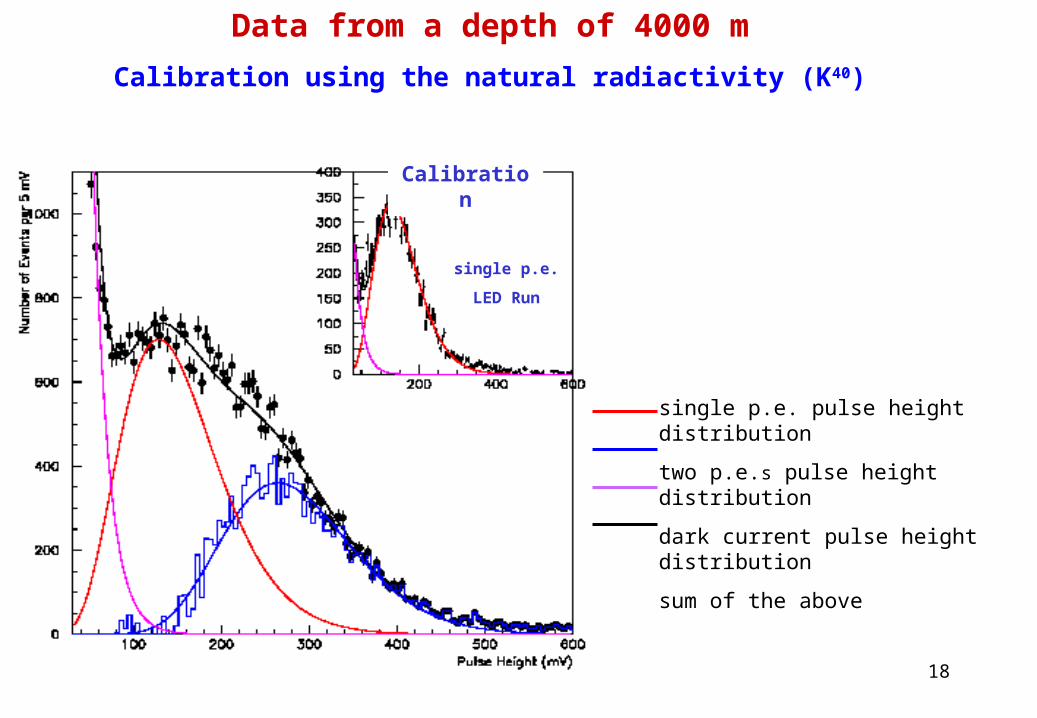
single p.e.
LED Run
single p.e. pulse height distribution
two p.e.s pulse height distribution
dark current pulse height distribution
sum of the above
Data from a depth of 4000 m
Calibration using the natural radiactivity (K40)
Calibration
19
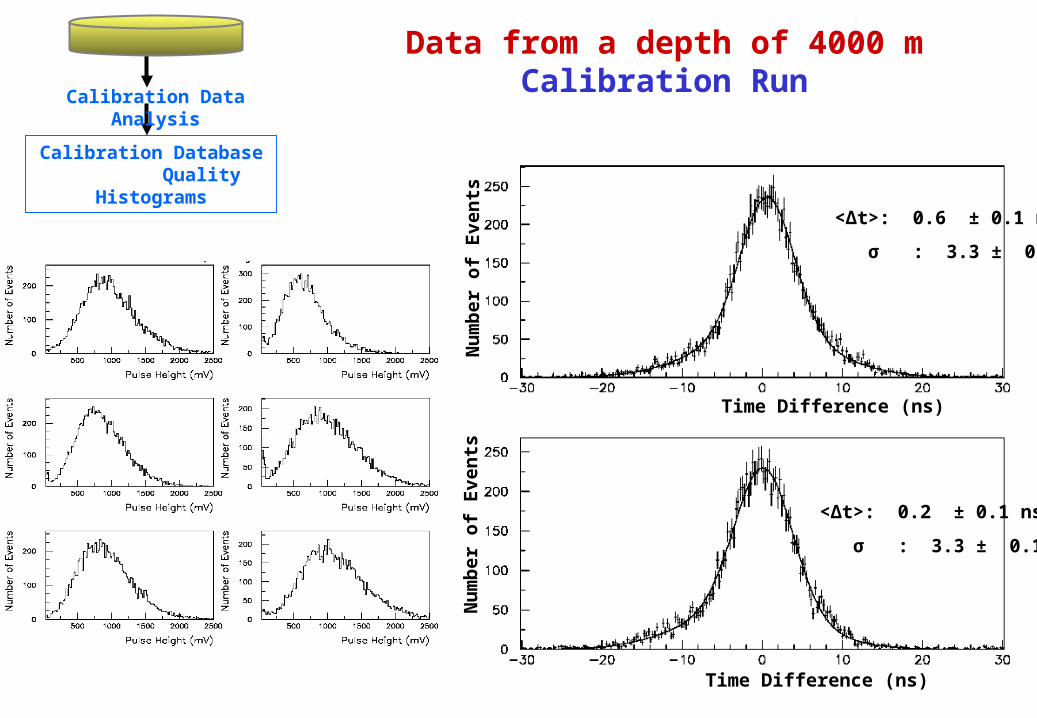
Calibration Data Analysis
Calibration Database Quality Histograms
LED Calibration Data
Gain Monitors
Data from a depth of 4000 mCalibration Run
Time Difference (ns)
Nu
mb
er o
f E
ven
tsN
um
ber
of
Eve
nts
Time Difference (ns)
<Δt>: 0.6 ± 0.1 ns
σ : 3.3 ± 0.1 ns
<Δt>: 0.2 ± 0.1 ns
σ : 3.3 ± 0.1 ns
20
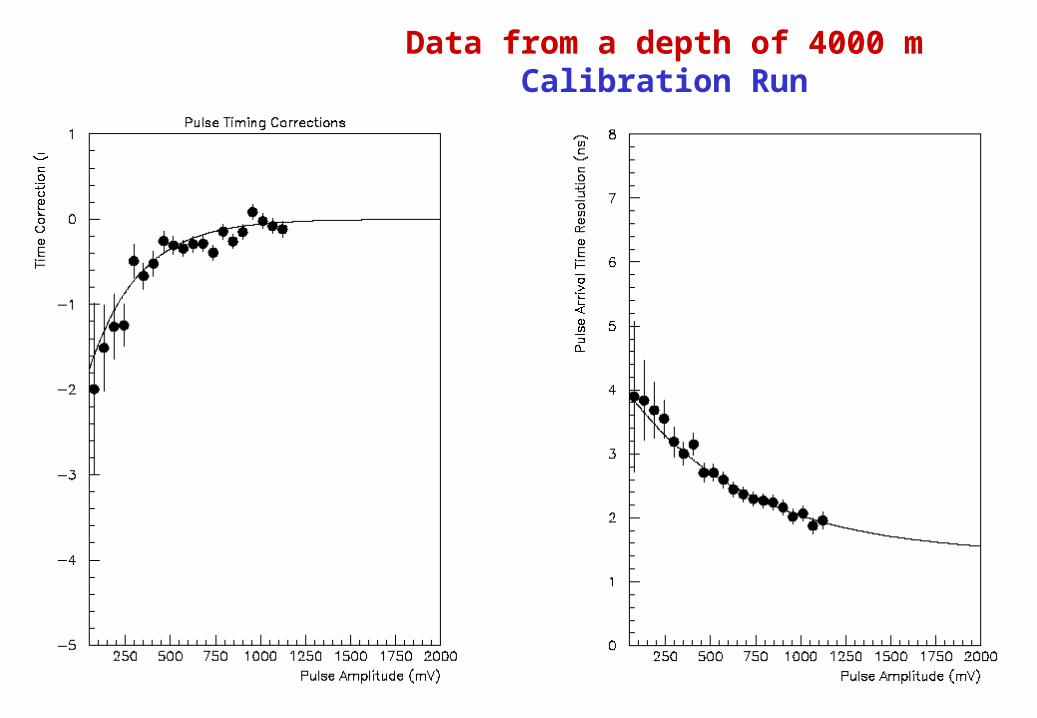
Data from a depth of 4000 mCalibration Run
21
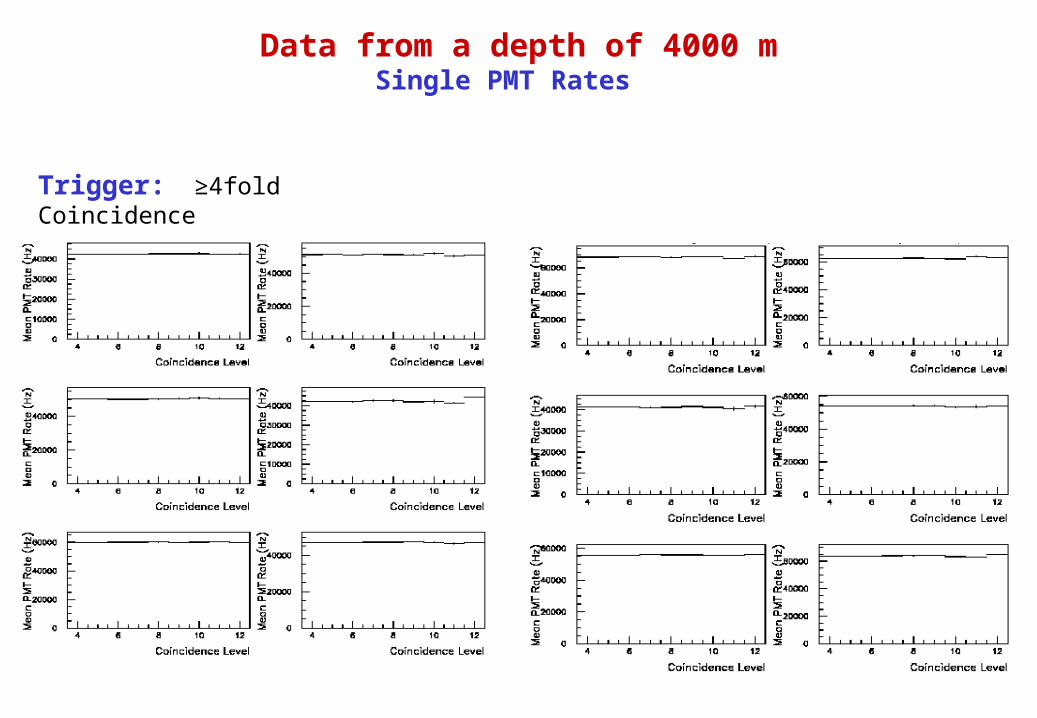
Data from a depth of 4000 mSingle PMT Rates
Trigger: ≥4fold Coincidence
22
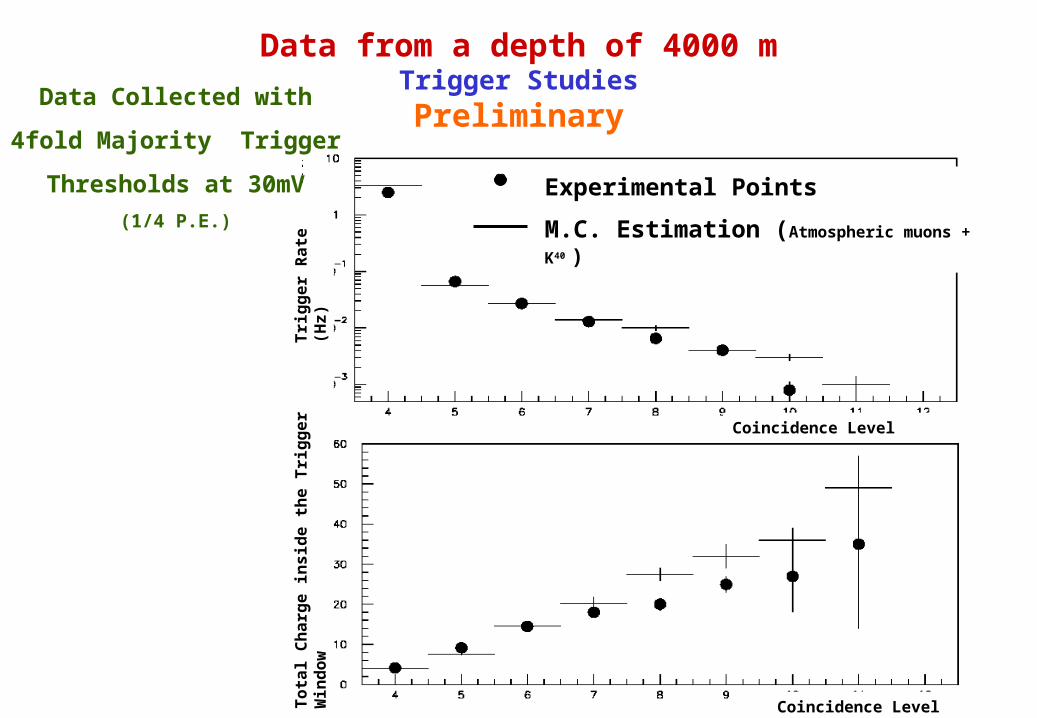
Data from a depth of 4000 mTrigger Studies
Preliminary
Coincidence Level
Coincidence Level
Tri
gg
er
Ra
te (
Hz)
To
tal
Ch
arg
e i
ns
ide
th
e T
rig
ge
r W
ind
ow
Experimental Points
M.C. Estimation (Atmospheric muons + K40 )
Data Collected with
4fold Majority Trigger
Thresholds at 30mV
(1/4 P.E.)
23
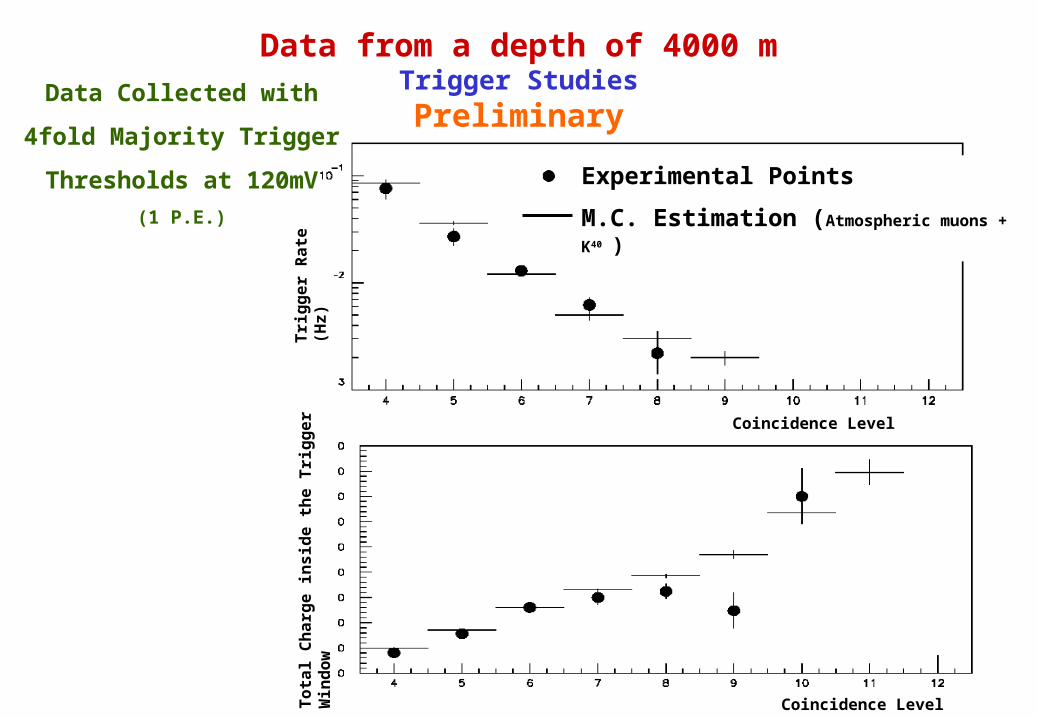
Data from a depth of 4000 mTrigger Studies
Preliminary
Coincidence Level
Coincidence Level
Tri
gg
er
Ra
te (
Hz)
To
tal
Ch
arg
e i
ns
ide
th
e T
rig
ge
r W
ind
ow
Experimental Points
M.C. Estimation (Atmospheric muons + K40 )
Data Collected with
4fold Majority Trigger
Thresholds at 120mV
(1 P.E.)