Embed Size (px)
DESCRIPTION
Jurnal manajemen
Citation preview

ELSEVIER
NEW TECHNOLOGIES AND
TECHNOLOGICAL
INFORMATION IN SMALL
BUSINESSES
PIERRE-ANDRI~ JULIEN Universit~ du Quebec ~ Trois-Rivi~res
The use of new management and production technologies is essential for EXECUTIVE most small businesses i f they are to improve their competitiveness and SUMMARY thus face up to increasing national and international competition, This
presupposes access to scientific, innovative, and technological information, making firms aware of developments in technology and the resources avail- able for obtaining and using the technology correctly.
Many authors have already shown that small businesses lag far behind large firms in their use of new technologies. Some reasons put forward to explain this include the more generally limited resources of small firms and a national structure for the production and transfer of new information that is poorly adapted to small business needs. However, assuming that some gap between small and large firms actually exists, how can we explain that most small firms nevertheless not only survive, often for a very long time, but also produce a return comparable to large firms?
One way of doing this is to study the situation of small businesses by using methods adapted to the small business sector and not developed for large firms. It is important to analyze not only the characteristics of the firms themselves, but also what they do to become competitive.
Our own research in the small business field has shown that the lag in terms of new computer technologies has decreased considerably in recent years, and also that it tends to be smaller in many industries if specific advanced technologies are added. The perspective also changes if we examine the innovation capacity of small business, and its ability to develop niches or to work on smaller and more specific markets.
The same applies to technological watch. An inquiry following a case study shows that small firms use different channels according to their objectives and turn to networks to overcome the limits of the information transfer system they use. They evaluate information by comparing different sources, and they use iterative techniques and intuition to complete their information and to decide on their investments. New technology acquisition by small and large firms cannot be compared;for small firms, it is an entrepreneurial act that in no way resembles the behavior o f larger firms.
However, to understand small businesses, further research is required into their behavior in different kinds of decision-making situations. To do this, we need tools developed specifically for the
Address correspondence to Pierre-Andr6 Julien, Bombardier Chair in Management of New Technology in Small Businesses, Universit6 du Quebec h Trois-Rivi~res, C.P. 500, Trois-Rivi~res, QUI~BEC G9A 5H7, Canada.
Journal of Business Venturing 10, 459-475 © 1995 Elsevier Science Inc. 655 Avenue of the Americas, New York, NY 10010
0883-9026/95/$9.50 SSDI 0883-9026 (95) 00084-L

460 P-A. JULIEN
small business sector, free of any presumption of the supposedly better performance of large-scale production.
I N T R O D U C T I O N
Following an in-depth survey of the literature, Gartner (1988) concluded that research into the characteristics of entrepreneurs had contributed very little to knowledge in the field of entrepreneurship, despite all the effort invested over the last 2 decades. Gartner's work led some researchers, including Stevenson and Jarillo (1990), to turn their attention instead to what entrepreneurs actually do regarding developments in their own interests and in the environment.
Robinson and Pearce (1980, 1984) had already shown that the type of research done in large firms, measuring strategic formalization, did not throw any light on the performance of small firms. Here, too, it is better to define success or failure on the basis of what entrepreneurs actually do, i.e., by looking at processes (behavior: what is done and how it is done) rather than procedures (structure) (Chicha et al. 1990; Julien and Marchesnay 1992; Bamberger and Wrona 1994). In a similar vein, research comparing the financial autonomy of small businesses in terms of equity and concluding that they were undercapitalized did not provide a satisfactory indication of the financial health of the firms (Ang 199i; Dunstan et al. 1992; Paranque 1994).
The same applies to understanding how small firms manage technological change as a way of increasing competitiveness. We must first look at what they actually do to obtain the best possible output from their organization and equipment and to seek out the information needed to increase that output. We mus; also avoid comparisons with large firms, particularly in the area of information, because the resources of small firms are so much more limited and the domestic and international transfer systems are directed mainly at the needs of large firms.
We already know that the most dynamic small businesses try to differentiate by innovating gradually in all or some sectors of the value chain, thus positioning themselves on smaller markets parallel to large firms. They also modernize their equipment in a more incremental, less planned way than large firms, and they use more iterative and intuitive methods of obtaining scientific and technological information. Their technological watch (or technologi- cal scanning and monitoring) is therefore less "organized," although it remains fairly effective, as shown by their increasing use of new computerized technologies.
In other words, if we apply methods developed for large firms, we might well conclude that small businesses do very little technological watch and lag dangerously behind large firms in modernizing their production. However, if we look instead at the actual behavior of small firms, our findings will be somewhat different.
The aim of this study is to show, using the results of a 3-year large-scale inquiry, that small firms faced with national or international competition are tending to turn increasingly to new technologies, but often in an original manner or differently from large enterprises. Second, it explains, with another inquiry, how small businesses carry out their technological watch according to their objectives and how they effect and manage technological change in a very different way to large firms. In short, the study aims to show that by using methods adapted to what small businesses actually do, we can explain why they continue to increase their share of total job creation and added value at the expense of large firms.

SMALL BUSINESS AND TECHNOLOGY 461
N E W T E C H N O L O G I E S I N S M A L L B U S I N E S S E S
Some research has shown that small businesses lag far behind large firms in their use of new computerized technologies. For example, a recent survey by Statistics Canada (1991) showed that, in 1989, less than 50% of small Canadian and American manufacturing firms with less than 100 employees were using at least one of 17 new computer:'-zed production technologies. This percentage rose to more than 80% among firms with more than 500 employees. However, the comparison was made on the basis of major computerized technolo- gies used mainly by large firms, particularly in five modern sectors. 1 It therefore assumed, in the spirit of the theory of economies of scale, that the technological situation of large firms is optimal and should serve as a point of reference for what should exist in small businesses.
First , it might well be that not all small businesses actually need new technologies. Many of them work on very specific market niches related to fashion, cultural or religious differences, or fairly isolated m a r k e t s - i n other words, niches where competit ion is less strong. There are, in fact, many more of these niches today, due to segmentation and a rapidly changing economy, and thus many more oppor tun i t i e s - t empora ry or l onge r - t e rm- for products requiring small production runs where new technologies are not as essential. In other cases, some small businesses buy used equipment and make improvements by adding functions, for example, thus making a technology do more than the manufacturer intended.
Or they may use a technology in a different way. Some change a product in response to a customer request, adding certain elements or offer a highly personal after-sales service. Others organize their production or distribution in a specific way, for example by using workers differently, 2 so as to improve performance in the entire production process and match the competit ion without necessarily introducing new technologies (Raymond et al. 1995).
Second, although some small firms, threatened by national or international competition, have fallen behind in their use of new technologies, the gap can be compensated for by new management techniques, including original ways of managing human resources and obtaining better performances (Garsombke and Garsombke 1989; Majchrzak and Davis 1990; Du- charme and Jacob 1995).
Even for new production technologies, the gap between large and small firms is closing quickly. A 1988 telephone survey in Qu6bec covering the population 3 of small businesses (fewer than 200 employees) in two very different sectors (plastics products and metal machin- ing) showed that some 19.4% of respondent firms had at least one numerically controlled machine, 7.7 % had computer-assisted manufacturing (CAM) systems, and 2.8 % used robots. A total of 38 % used at least one very modern technology 4 (Julien 1991), compared to the 1985 figure of only 17% (DICQ 1987).
1 Fabricated metal products, industrial machinery and equipment, electronic and other electrical equipment, transportation equipment and instrumentation and related products.
2 For example, small firms working in seasonal sectors such as door and window manufacturing hire additional staff for the high season, just long enough for their employees to qualify for Canadian unemployment benefits. In this way the people can afford to wait for the next high season, and the firm does not have to train new people every year, which reduces its costs. The employees, too, are glad to work for just 6 months a year and yet have an income for 12. This system is not possible in large firms, mainly because of union constraints. But it is possible that recent changes in unemployment benefits rules will make this practice rather more difficult to operate.
3In all, 82% of the population was contacted by telephone for a 16-minute, 23-question interview. a Including "advanced" but noncomputerized equipment such as injection molding, spiral wire winding, double-
screw extrusion, etc. for the plastics industry, and plasma machining, laser welding, etc. for the metal machining industry.

462 P-A. JULIEN
Survey 1989 S u ~ e y l ~ 2
Survey 1994
[ ] No Technology
[ ] Three Technologies and more
[ ] Two Technologies
[ ] One Technology
FIGURE 1 Survey results. Sources: CAD/CAM Association. 1989. Tendance et degr6 de p6netration. L'informatisation de la production, Montr6al, Qu6bec Industrial Research Center; Julien, P.A., and Carri~re, J.B. 1994. L'efticacit6 des PME et les nouvelles technologies, Revue d~conomie industrielle, 67:120-135; Carri~re, J.B. 1995. Profil technologique de la PME manufacturi~re qu6b6coise, Qu6bec Manufacturing Association.
In March 1992, another telephone survey was made on behalf of the Qu6bec Manufactur-
ing Association (Julien et Carri~re 1994). It covered 10 manufacturing industries 5 where
small businesses (five to 250 employees) accounted for around 50% of total employment and 44.3 % of total added value. A structured interview questionnaire was used, covering
5 The industries were selected on the basis of the following factors: economic importance of the industry (overall size), percentage of small businesses, percentages of small businesses in terms of employment and value-added contribution. The industries selected were: dairy products, textiles, clothing, doors and windows and other turned wood products, household furniture, metal machining, aircraft parts and components, motor vehicle parts and accessories, electrical equipment, and pharmaceutical products. The average interview time was 22 minutes.

SMALL BUSINESS AND TECHNOLOGY 463
the following aspects: general information about the firm, its market environment, its techno- logical inventory (processes, generic 6 and specialized computer equipment, technical policies, procedure, and personnel) and its previous (past 3 years) and future (next 3 years) investments in new technologies. The average number of firms per industry was 245, with an average of 40 firms random-sampled per industry. In all, some 408 small businesses were interviewed. The results showed that general technological rates had risen to 28.8% for small businesses having just one new technology, 11.5 % for those having two, and 16.7 % for those having three or more. In August 1994, the same telephone survey was made with 10 other manufacturing industries. 7 The preliminary general results showed that rates had jumped to 18.2% for just one new technology, 16.7% for two, and 49.8% for three or more (Carri~re 1995).
Figure 1 shows these results compared with the results of another study, this time performed in 1989, using basically the same questionnaire on a sample that also included large firms in eight industries. It shows that in a period of just 5 years, including 3 years of economic recession, the number of small businesses using at least three new computerized technologies increased more than 10-fold. In other words, the percentage of small businesses in manufacturing sector not using any new generic computer technologies fell from 64.5 % in 1989 to 15.3% in 1994.
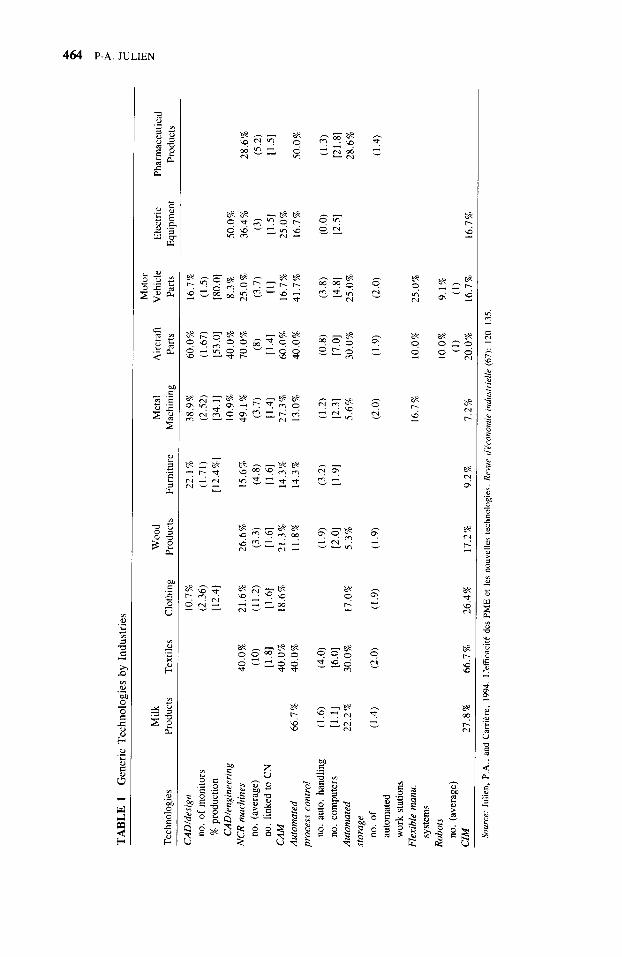
However, this overall comparison does not show whether small businesses continue to lag behind large firms in terms of new technology use. To do this, we need to look further into the industries themselves. Table 1 (based on 1992 survey only) 8 shows that the number of generic technologies differs considerably by industry. For example, 49.1% of small busi- nesses in the metal machining industry had an average of 3.7 numerically controlled (NC) or computer numerically controlled machines, including 1.4 linked to a central computer, and 38.9% had at least one computer-aided design (CAD) technology with 2.5 monitors, accounting for 34.1% of production. In the aircraft parts industry, the average number of CADs was 1.7, accounting for 53% of production in 60% of firms, with a similar figures for computer-aided manufacturing (CAM) systems. On the other hand, in the clothing industry just 21.6% of small businesses were using NC machines (with an average of 11.2 computer sewing machines in the firms using them), and 26.4% were using a computer integrated manufacturing (CIM) system. The average number of firms using at least one computerized technology was similar in the household furniture industry.
If, however, specialized computer technologies are added to these generic technologies, as shown in Table 2 (1992 survey results), the average number of small businesses using at least one computer technology increases to more than 55 % in all but two industries (wood products: 21% and pharmaceutical products: 50%). In the metal machining industry, more than 85 % of firms use at least one numerically controlled machine, and in the dairy products, textiles, aircraft parts, and motor vehicle parts industries the figure is more than 67 %.
In short, the presence in small businesses of new management and production technolo- gies, especially the more complex ones, is increasing steadily, and the penetration rate is
6Generic technologies include different CADs (drawing and design), computer-aided engineering, flexible manufacturing cells or system, NC/CNC machines, robot(s), automated storage and retrieval systems, automated guided vehicle system(s), programmable controllers and computer(s) used for control on the factory floor, manufac- turing information systems, computer integrated manufacturing. The processes technologies include just-in-time systems, quality control systems, and EDI.
7 Meats and poultries, other plastic products, leather products, sawmills and planing workshops, commercial printing and platemaking, metals products, other equipment and machine products, communication equipment, and scientific and professional equipment. The same 1992 survey factors were used to select these industries.
Because the 1994 questionnaire was less complex as regards new technology characteristics and specialized computer technologies.
464 P-A. JULIEN
_=
h
6
~d
t ~ _
o . ~
k~
~._=
rr
t ~
r ~-
t ~
¢ q
D~
~6
Oo
L,
-7
._o
o _
U
,c

SMALL BUSINESS AND TECHNOLOGY 465
,-i
eq
[ -
°4
U.,
-~1 °
@~ ~ o ~ -

4 6 6 P-A. JULIEN
increasing in speed over time, showing a strong learning effect. The lag in using new technolo- gies can be relativized in much the same way as researchers have questioned the advance of large firms in innovation or R&D.
As regards innovation, for example, studies such as those by CNR/ISTAT in Italy or INSEE in France shown that between 40 % and 70 % of small businesses according to different industries in the manufacturing sector regularly introduced innovations (Mediocreditocentrale 1994; Bernard and Torre 1995).9 In Canada, of the 3459 enterprises systematically performing R&D, 2381 (68.8%) had fewer than 50 employees, accounting for 13.2% of total spending in the manufacturing sector. In addition, average R&D spending in small firms amounted to 12.7% of sales, compared with less than 3% in larger firms (more than 200 employees) (Baldwin et al. 1993). ~° As we said, more often than not, innovation is incremental and concerned primarily with the output or improvement of new products (often as a result of special customer requests), but equally with the improvement of plant and equipment, often purchased secondhand, or with a particular method of reaching customers. In addition, the proportion of small businesses introducing more radical innovation is apparently about 5 % - which is higher than for large firms. And the small businesses that conduct more systematic research apparently spend a higher proportion of turnover than do large firms (Mansfield 1981; Belhumeur and Nguyen 1989).
S C I E N T I F I C , I N N O V A T I V E , AND T E C H N O L O G I C A L I N F O R M A T I O N AND S M A L L B U S I N E S S E S
Innovation and new technology penetration both require external information to facilitate the development of new ideas for market differentiation or increase knowledge on the state of available technology and the level of dissemination among major competitors.
Scientific, innovative, and technological information is the key element on which the systematic modernization of both large firms and small businesses is based. It is more difficult for smaller enterprises to obtain this information, given their generally more limited resources and a national information production and transfer structure that is neither adapted to or oriented toward their needs.
For example, a recent study in the Netherlands, using a representative sample of nearly 2000 manufacturing firms of varying sizes (10 employees and more) showed that the difficulty of finding technological information was one of three elements in which a significant difference existed between small and large firms in terms of innovation (Kleinknecht 1989).
Sources of Scientific, Innovative, and Technological Information for Small Businesses
Scientific, innovative, and technological information can be obtained from different sources: personal and impersonal, formal and informal, written and oral. To examine the sources
9For example, in France in the 1980s, investment in innovation and new technologies grew more in small and medium-sized enterprises than in large firms (OECD 1995). See also the French government's inquiry into technological innovation in the manufacturing sector (SESSI) in: L'innovation technologique dans l'industrie, Les 4 PAGES, No. 1, January 1992. For the United States, see Audretsch and Vivarelli (1994) or Acs and Audretsch (1988).
rain 1989, added value in enterprises with fewer than 50 employees was 14.7%, showing that the weight of R&D expenditure by small business is comparable to its importance in economic production (Statistics Canada 1991).

SMALL BUSINESS AND TECHNOLOGY 467
most used, a case study of 15 small enterprises H and a larger survey of 344 small businesses were carried out in seven industries 12 (Julien et al. 1995). As Table 3 shows, the results revealed that the most important sources o f information were customers, specialized maga- zines, production employees and staff, suppliers, sellers, and fairs. However, the frequency of using the sources may differ. The main personal sources used were customers, employees, suppliers, and salespeople, and the impersonal sources included specialized magazines, bro- chures, and catalogues. Informal sources are used more often than formal sources. An average of 8.6 informal personal sources and 3.7 formal personal sources was used, for a total of 12.3. For the impersonal sources, the number was about eight, and more use was made of written than oral sources. These data are fairly consistent with the data of Johannisson and Johnsson (1988) and Birley, Cromie, and Myers (1991).
But what about the quality of the sources and the capacity of small firms to extract all the information they need? We know that a large part of available information is too general or too badly adapted. The most interesting information, which allows firms to differentiate from their competitors, is the most recent, but it is often difficult to obtain because it is developed in private or semipublic laboratories. Cost is involved in finding, evaluating, and adapting this type of information to the specific needs of each firm.
To minimize costs and increase information quality, many small businesses, as a number of studies have shown, use networks (Meyer and Goes 1987; MFRT 1989). In particular, networks can help adapt information to small business needs, organization, and the type of market structure.
Networks may include suppliers, research centers or other public or private agencies transferring information, dynamic industrial associations, competitors, subcontractors pro- viding specialty services or know-how, and contractors, as can be seen in the technological watch survey. Networks are usually strategic rather than operational a n d - a t least for newly established firms or young entrepreneurs as yet unattached to solid n e t w o r k s - circumstantial. As Rothwell (1990) has shown, the more strategic and longstanding the network, the more efficient it becomes.
Networks can take many forms, with more or less flexible boundaries. They are often concen t r i c - tha t is, where the primary or close network cannot answer a complex question, another more specialized network can be reached through an affiliate member to obtain some of the information sought, and so on, until the question has been fully answered. Generally speaking, the primary network is consulted first, even though in most cases it supplies only the most traditional, run-of-the-mill information. Second- and third-level networks are con- suited less often, but provide more specialized and often more valuable information. Thus, the most important sources of information are not necessarily the most frequently used, and the quality of information can be higher from some less frequently used sources. Information
it The case study included a 150-minute interview with the owner-manager, using open questions on technologi- cal watch and information sources, in particular with regard to the last major technological investment. At least one firm per industry was questioned. The average size of the 15 enterprises studied was 44.6 employees (with a minimum of 21 and a maximum of 186). Some 46% were involved in exporting, and more than two-thirds used at least one numerically controlled or computer numerically controlled machine.
~2 The industries were rubber and plastic, wood, furniture, fabricated metal, machinery equipments, transporta- tion equipment, and electrical and electronic products. The survey was made by mail and, using the Industrial Subcontractors Center databank, covered 3100 enterprises. The questionnaire was divided into four parts: the level of equipment, technological watch practice, the perception of environment, and other characteristics of firms organization. The number of employees of the sample was: 19% fewer than 10 employees, 49% between 10 and 49, 34% between 50 and 100, and 8% between 100 and 250 employees. In the analysis of the results, we used different techniques including factorial analysis and hierarchical and quick cluster analysis, and different tests including Cronbach's alpha and the ANOVA tests (Norusis 1991; Devellis 1991).

468 P - A . J U L I E N
.2
..,-,
e - ,
.~m~ ~.~ ~.~ ~.~
©
g~
.c~
~ . ~ ~.
~ , o ~ ~ ._ o
~ ~ ~ - - .~ ~ . ~ . =
:m
,b0
o ~ o
E
8..
oG-;

SMALL BUSINESS AND TECHNOLOGY 469
T A B L E 4 U t i l i z a t i o n and P e r c e i v e d U t i l i t y o f D i f f e r en t S o u r c e s o f I n f o r m a t i o n in the Di f f e ren t P h a s e s o f the I n f o r m a t i o n P r o c e s s in the C l o t h i n g I n d u s t r y
Information Evaluation Selection Phase Phase Phase
Real Perceived Perceived Utilization Utilization Perceived Utilization Perceived
Sources of Information (%)~ (%)b Utility Index c (%)b Utility Index c
Industrial fairs and 67 17.7 3.48 13.6 3.44 exhibitions
Technical journals 16 11.9 2.40 5.6 3.00
Business journals 4 2.1 1.56 1.2 1.17 Consultancy firms 1.8 2.67 0.8 2.50 Technology suppliers 48 22.3 3.43 32.3 4.52
and manufacturers
Other suppliers 12 8.9 2.11 1.2 1.17 Personal and business 20 15.9 3.41 30.3 4.00
contacts
Employees 4 14.7 4.23 13.2 4.63
Customers 1.8 1.33 0.4 Public or private 4 2.8 2.00 1.6 4.00
training institutions Average consultation of 1.68 4.04 2.02
sources of information
" For example, real percentage utilization indicates that 67 % of business people said they used fairs, 16% had recourse to technical journals, etc.
h Perceived percentage utilization indicates the relative share of utilization of the different sources, weighted by the importance attached to each by businesspeople.
' Perceived utility index is expressed on the basis of a scale from 0 to 5. From 0 to 1.5 is very low, from 4.5 to 5 is very high. Source: S. Lapointe, "L'adoption des nouvelles technologies dans le secteur du v~tement. Etude du processus informationnal",
paper presented at the ICSB-Canada Conference, Trois-Rivi~res, Quebec, November 14-16, 1991.
is a cumulative phenomenon, in terms of both learning and sources (from closest to furthest, simplest to most complex).
However, for a specific decision like buying a major new technology, most firms do not limit themselves to a single source or single network-f irs t because the technology demands financing, personnel training, new market development, etc., and second because no single source can provide all the useful and appropriate information needed and be up-to-date at the same time. A study of the Qu6bec clothing sector showed that sources varied according to the phases of the information process (Lapointe 1992). As Table 4 shows, for example, industrial fairs and exhibitions are most used in the information phase, whereas suppliers are most used during the evaluation and selection phases. Although less use is made of employees, they are regarded as most useful in the evaluation and selection phases. According to the results of our survey and case study on technological watch, the number of sources used increased with the importance and complexity of investments too.
Small businesses are wary of using single sources; they prefer to check their information. For example, they are suspicious of consultancy firms and equipment suppliers, believing they are seeki0g to impose unsuitable technologies, especially equipment or software from the suppliers they represent. Research has shown that consultants are used sporadically by 35% of small manufacturing businesses in the United States (Griffith and Dorsman 1987). They are also suspicious of public and semipublic research centers or government agencies whose specialities do not correspond exactly to their needs or whose knowledge may be warped by contact with firms that are too large or too different. Another problem with government institutions seems to be the instability of public servants and programs.

470 P-A. JULIEN
In seeking effective sources of scientific, innovative, and technical information, the development of bonds of trust, which can be established only gradually, is important if not essential. It must not be forgotten that in information exchanges firms are always afraid of passing on recent internal information that could be of benefit or potential benefit to a competi- tor. The need for trust explains why it is often important for the source of information (or transfer) to be fairly close to the small business, sociologically, geographically, and sectorally. This "proximity" is obtained mainly within or through the network (Planque and Py 1986; Lambooy 1986), unless the information is too specialized and found only on a much wider information market. However, even here, it is still preferable for the transfer organization to be close by. Moreover, the fact of referring to a known firm that has had recourse to a good source from which it has obtained an interesting application is an excellent way of facilitating use. Most small businesses function through example, using reactive strategies, partly imitating others.
Accumulating a set of information leading to major R&D or investment decisions is a long process that demands organization of what is known as technological watch and monitoring.
Specific Technological Watch The survey and case study on technological watch revealed that this process is generally highly personalized in small businesses. It is performed using personal contacts and is directly linked to the owner-manager. The owner-manager is the center of the information web, although he or she may have to share it with the key personnel members (on average, four employees) and use their competence and learning capacity. By definition, obtaining scientific, innovative, and technological information calls for personal contacts. Information is akin to a service that is above all intangible; in other words, it is of no use unless the message conveyed can be converted into know-how. Furthermore, the service is inseparable from its proposer; the information, especially when quite new, belongs to the person who passes it on and whose participation is therefore required. Another factor is the variability of informa- t ion- i t is seen differently by the person providing it and the person receiving it. The direct contact and dialogue established, based on the relationship of trust that is created, make it possible to obtain further information, qualified as required. Lastly, it should be remembered that information is often a "perishable" commodity; it cannot always be stored, and because it is subject to rapid change, it must be passed on quickly.
Technological watch by small firms is also a very iterative (nonlinear) process that is nevertheless oriented. It is developed on the basis of their specific requirements, strategic needs and particular objectives, and changing circumstances. However, it leaves room to seize opportunities, too. For these reasons, although information from the written media (specialized magazines, business journals, etc.) can be useful, it is rarely sufficient on its own and has to arrive at the right time. Information that seems interesting generates a search for more information. Effective complex information is obtained through the accumulation and manipulation of small pieces of information, combined with intuition and decision. As Gagnon and Toulouse (1993) showed, adopting new technologies is an entrepreneurial act rather than a planned or managerial decision, thus requiring more intuition than analysis.
Technological watch is a multifunctional activity too. It usually goes hand-in-hand with surveillance of competition and trade, and the search for technological information leads to a search for complementary information about potential suppliers, sources of financing, new openings on domestic and foreign markets, subcontracting, training, the emergence of new

SMALL BUSINESS AND TECHNOLOGY 471
T A B L E 5 Dominan t and Marg ina l D i mens i ons for the Three Types o f Technologica l Wa tch Pract ices
Dimensions Type 1 Type 2 Type 3
Objectives Dominant dimension
Marginal dimension Information
Dominant dimension
Marginal dimension
Main sources of information Dominant dimension
Marginal dimension
Organization of watch Dominant dimension
Marginal dimension
Increase productive capac- ity, productivity and flex- ibility (OPROD) OPREST
Financial and human re- sources information Marketing information
Sellers, agents and repre- sentatives, and customers
Staff, production employees, and others internal databanks
Simple methods for information search
Watch management ad hoc and not very organized
Increase quality of products OPREST and services, satisfaction of customers, etc. (OPREST) OPROD OPROD
Marketing information
Financial and human resources information
Financial and human resources information Marketing information
Order-givers, subcontrac- tors, suppliers, and competitors Sellers, agents and represen- tatives, and customers
Good organization for seek- ing technological information Simple methods for informa- tion search
Staff, production employ- ees, and others internal databanks Order-givers, subcontrac- tors, suppliers, and competitors
Complex methods for infor- mation search
Very good organization for seeking technological information
Source: Julien, P.A., Jacob, R., Raymond, L., et al. 1995. Les configurations des pratiques de veille technologiques dans les PME manufacturi~res. Communication to the Fourth Conference on French International Association on Management, Paris, May 2-4, 1995.
kinds of jobs, and so on. In small finns, technological watch is linked directly to strategy and objectives, and therefore a large part of the information must arrive at the right time and provide answers to specific questions.
In our survey and case study we found three types of technological watch, the first less developed, the third more organized, and the second between the two. This is illustrated in Table 5 (Julien et al. 1995). The table shows some relations between objectives proposed, kinds and sources of information used, and the type of organization of the technological watch (more or less complex and formal internally and externally). For the third group, objectives are more oriented toward market, with firms seeking mainly information on finance and human resources, sources are more internal, and the technological watch uses more diversified and more formalized methods, involves more employees, and bears more relation to the general strategy. J3 In contrast, the technological watch of the first type makes more use of customers, sellers, and other sales agents as sources, and its methods are more simple, intuitive, and ad hoc. Finally, the objectives of the second type are more market-oriented (quality and diversification of products and compliance with deadlines), its information is more concerned with marketing and is obtained more from the order-givers, subcontrators, suppliers and competitors, and its management of the technological watch is beginning to be relatively complex and well organized within the firm.
t3For example, the means of the analysis of variance (ANOVA test) for the diversity of the methods used for the technological watch were - 0 . 3 0 for the first type, - 0 . 4 8 for the second, and 0.43 for the third; the means for the complexity of management for the watch were respectively -0 .65 , -0 .07 , and 0.36.

472 P-A. JULIEN
But, beside the objectives and the quality of the organization, one other reason for these differences may be the quality of sources and information around small businesses. The existence of various sources of information is a prerequisite for effective technological watch. However, the search for and development of good sources depends also on the dynamism of the small business, in other words on its openness to new technologies and innovation. This requires an adequate technological culture (a receptive attitude with regard to scientific and technological change), followed by an interest in and active search for information through technological scanning, and then processing and conversion of the information into knowledge and applications (OECD 1993).
Training and experience or learning are therefore prerequisites to the search for and use of scientific, innovative, and technological information. The information, once obtained, is truly useful only if transformed into knowledge to bring out its full value. Management training (the first vector of knowledge development) or its quality is one of the most important elements distinguishing small businesses that use new production technologies from those that do not. Training must also be extended to the employees who will be required to work with new applications of the information in the form of new products, new machinery, or new types of organization.
The presence of technicians or engineers within the firm can be very helpful, mainly for evaluation purposes. For example, we showed in previous research that seven of the 10 most important factors distinguishing small firms using new production technologies within the same market (explaining 83.3 % of the variance) were concerned with the search for or processing of information, and an eighth with the level of training among the firm's manage- ment (Julien et al. 1988).
In other words, the small firms using mostly new production technologies are usually headed by a better-educated or university-qualified owner-manager (often in a technical field), have better-trained senior management, use more complex management techniques including market surveys and management committees, and have a complex technological watch. Thus, differences between "modern" and "more traditional" firms can be explained by the quality of internal resources (especially human resources) and by mastery of scientific and technological information. In this respect, training includes basic education and also ongoing or ad hoc training. Surveys show that the more highly developed the firm in technological terms, the more likely it is to be a member of dynamic and complex second or third-level networks, and the more use it will make of those networks to speed its own growth (Rallet 1988; Grabner 1989).
C O N C L U S I O N
Early small business research used concepts derived from large firm behavior and concluded that small enterprises could only succeed by becoming bigger. In the interim, they should do all they could to imitate large firms, in particular by trying to catch up technologically. Since then, however, other studies have shown that very many firms remain small, while maintaining profitability levels comparable to those of large f i r m s - a seeming paradox.
More recent research has used methods developed specifically for or adapted to the small business context. It has shown, among other things, that not only is the gap in new technology use between small and large firms much smaller than some authors thought, when the real needs of the two sectors are considered, but what small firms do to obtain technological information is actually quite effective despite a national and international scientific, innovative, and technological information transfer system still badly adapted to their needs, although

SMALL BUSINESS AND TECHNOLOGY 473
this situation is changing. Increasing numbers of small businesses are using generic and specific computer technologies when they need them. They are also able to adapt or modernize older technologies and develop new organizational forms to maintain efficiency. To do this, they have to seek out and use advanced information. This whole process allows them to operate effectively in their own markets.
It is therefore not surprising that the importance of small businesses in job creation and added value is increasing, if we leave aside the recent economic crisis. For example, in the United States, the net number of jobs created by small firms (fewer than 100 employees) in the period 1988-1990 was 2,311,200, whereas large firms registered a net loss of 399,600 jobs. In Japan, in the period 1990-1991, net job creation by small and medium-sized firms with between four and 300 employees was 92,000, compared with 83,000 for firms with more than 300 employees. In Sweden, of the 207,903 net new jobs created between 1985 and 1989, some 144,632 came from small firms with less than 200 employees (i.e., 69.6%, 62 % by growth of existing small firms and 38 % by the appearance of new firms). In Canada, in the period 1984-1989, small firms (fewer than 200 employees) were responsible for 64.3% of the 265,800 net new jobs created in the manufacturing sector, and 74% of the 1,386,300 net new jobs in the service sector (OECD 1995). In addition, contrary to what was shown by early research and is still believed by some researchers even now, recent research shows that between 50 % and 70 % of new small businesses survive for more than 5 years (Reynolds and Miller 1989; Phillips and Kirchoff 1989). A 1988 European Community comparison showed that labor costs per employee (productivity and salary) in manufacturing industries dominated by small businesses were very similar to those in manufacturing industries domi- nated by large firms (European Observatory for SMEs 1994).
Clearly, further research is needed to confirm that small businesses are indeed more competitive due, among other things, to their increasing use of new technologies, supported by fairly effective information. The research should concentrate on the situations and behaviors of small firms according to different size categories, different industries, and types of market. The behavior and capacity of small businesses to face up to national and international competi- tion will be understood only by careful observation of what they actually do, and not by comparison with large firms.
R E F E R E N C E S Acs, Z., and Audretsch, D.B. 1988. Innovation in large and small firms: an empirical analysis. American
Economic Review 78(4):678-690. Ang, J.S. 1991. Small business uniqueness and the theory of financial management. Journal of Small
Business Financing 1(1): 1-13. Audretsch, D.B., and Vivarelli, M. First Semester 1994. Smalls firms and R&D spillover: evidence
from Italy. Revue d~conomie industrielle 67:225-237. Baldwin, J., et al. August 1993. Strategies for success. A profile of growing small and medium-sized
enterprises (GSMEs) in Canada. Preliminary Document. Ottawa: Statistics Canada. Belhumeur, A., and Nguyen, T. June 1989. Le processus d'innovation technologique dans les petites
et moyennes entreprises manufacturi~res du QuEbec. Paper presented at the ICSB-Canada Confer- ence, QuEbec.
Bernard, J., and Torre, A. 1995. Les dynamiques d'innovation et de R-D des P.M.I. franqaises. Revue Internationale P.M.E. 7(3/4):18-29.
Birley, S., Cromie, S., and Myers, A. 1991. Entreprenerial networks: their emergence in Ireland and overseas. International Small Business Journal 9(4):56-74.
CAD/CAM Association. 1989. Tendances et degr~ de p~n~tration. L'informatisation et l'informatisation de la production. MontrEal: QuEbec Industrial Research Center.

474 P-A. JULIEN
Carribre, J.B. 1995. Profil technologique de la PME manufacturiEre quEbEcoise. MontrEal: QuEbec Manufacturing Association, and QuEbec: French Centre for the Informatization ofOrganisations.
DeVellis, R.F. 1991. Scale Development. Theory and Applications. Newbury Park, CA: Sage. Department of Industry and Commerce of QuEbec (DICQ). 1987. Le secteur de la machinerie et du
travail de metal au QuEbec: importance Economique et analyse comparative. QuEbec: Service of Research and Planning.
Ducharme, J., and Jacob, R., ed. 1995. Changement technologique et gestion des ressources humaines. MontrEal: GaEtan Morin.
Dunstan, D., Dwyer, D., and Holmes, S. June 1992. The small business funding debate: an empirical review. International Congress on Small Business Financing, Houston, TX: Baylor University.
European Observatory for SMEs. 1994. Second Annual Report, chap. 5. The Netherlands: Rootseleer. EUROSTAT 1993. National Account. 1992. Bruxelles. Quoted by OECD, 1995.
Gagnon, Y.C., and Toulouse, J.M. 1993. Adopting new technologies: an entrepreneurial act. Technova- tion 13(7):411-424.
Garsombke, T.W., and Garsombke, D.J. 1989. Strategic inplication facing small manufacturers: the linkage between robotization and computerization. Journal of Small Business Management 27(4): 34-45.
Grabner, G. 1989. Regional innovation by networking: the case of Lower Austria. Entrepreneurship and Regional Development 2(1): 141-152.
Griffith, J., and Dorsman, M. 1987. SMEs, new technology, and training. International Small Business Journal 5(3):30-42.
Johannisson, B., and Johnsson, T. 1988. New venture network strategies. Working paper no. 18, University of Vaxjo, quoted by Birley, Cromie, and Myers,
Julien, P.A. 1991. Le rythme de pEnEtration des nouvelles technologies: la situation au QuEbec. Journal of Small Business and Entrepreneurship 8(3):21-32.
Julien, P.A., and Carri~re, J.B. First Trimester 1994. L'efficacitE des PME et les nouvelles technologies. Revue d~conomie industrielle 67:120-135.
Julien, P.A., Carri~re, J.B., and HEbert, L. 1988. Les facteurs de diffusion et de pEnEtration des nouvelles technologies dans les PME manufacturibres quEbEcoises. Revue Internationale PME 1(2): 193-223.
Julien, P.A., Jacob, R., Raymond, L., et al. 1995. Les confgurations des pratiques de veille technolog- iques dans les PME manufacturi~res. Communication to the Fourth Conference on French Inter- national Association on Management, Paris, May 2-4, 1995.
Kleinknecht, A. 1989. Firm size and innovation. Small Business Economics 1(2):215-222. Lapointe, S. November 1991. L'adoption des nouvelles technologies dans le secteur du v~tement. Etude
du processus informationnel. Paper presented at the ICSB-Canada Conference, Trois-Rivi~res, QuEbec.
Lambooy, J.G. 1986. Information and internationalization. Dynamics of the relations of small- and medium-sized enterprises in a network environment. Special Issue on Les PME innovatrices et leur environnement local et dconomique. Revue d~conomie rdgionale et urbaine (5):719-731.
Majchrzak, A., and Davis, D.D. 1990. The human side of flexible factory automation: research and management practice. In S. Oskamp and S. Spatacan, eds., People's Reactions to Technology. Newbury Park, CA: Sage.
Mansfield, E. November 1981. Composition of R&D expenditures: relationship to size of firm, concen- tration, and innovative output. The Review of Economic and Statistics. 67(4):609-619.
Mediocredito Centrale, 1994. lndagine sulle imprese manifattriere, Quinto rapporto sull'industria ital- iana e sullo politica industriale. Milano: Department of Industry, 24 ORE.
Meyer, O., and Goes, J.B. 1987. How organizations adopt and implement new technologies. Academy of Management Proceedings 175-179.
MFRT (German Department of Research and Technology). June 1989. Promotion of Research and Development in Small and Medium-sized Enterprises, Bohn.
Norusis, M.J. 1991. SPSS User's Guide. Michigan: Michigan University Press.

SMALL BUSINESS AND TECHNOLOGY 475
OECD. 1993. Small and Medium-Sized Enterprises: Technology and Competitiveness. Paris. OECD. 1995. Globalization of Economic Activities and Small and Medium-Sized Entreprises (SMEs)
Development. Paris (submitted). Paranque, B. First Semester 1994. Fonds propres, rentabilit6 et efficacit6 chez les PMI. Revue d~cono-
mie industrielle 67:175-191. Phillips, B.D., and Kirchoff, B.A. 1989. Formation, growth, and survival: small firm dynamics in
the U.S. Small Business Economics 1(1):65-74. Planque, B., and Py, B. 1986. La dynamique de l'insertion des PME innovatrices dans leur environne-
ment: probl6matique et propositions m6thodologiques. Revue d~conomie r~gional et urbaine (5):587-607.
Rallet, A. 1988. Les entreprises et l'innovation en mati~re de rfseaux de communication. InL~nnovation dans les entreprises et les r~gions. Luxembourg: Interegional Workshop. Proceedings: 47-59.
Raymond, L., Julien, P.A., Carri~re, J.B., and Lachance, R. 1995. Management technological change in manufacturing SMEs. A multiple case analysis. International Journal of Technology Manage- ment (in press).
Reynolds, P. and Miller, B. 1989. New firm survival: analysis of a panel's fourth year. Frontiers of Entrepreneurship Research Wellesley, MA: Babson College.
Rothwell, R. 1990. External networking and innovation in small and medium-sized manufacturing firms in Europe. Working paper. United Kingdom: University of Sussex.
Statistics Canada. 1991. Indicators for Science and Technology 1989. Survey of Manufacturing Technol- ogy. Catalogue 88-002. 1(4).


