Embed Size (px)
DESCRIPTION
research 3
Citation preview
lable at ScienceDirect
Marine and Petroleum Geology 58 (2014) 331e338
Contents lists avai
Marine and Petroleum Geology
journal homepage: www.elsevier .com/locate/marpetgeo
Logging-while-drilling and wireline velocities: Site NGHP-01-10,KrishnaeGodavari Basin, India
P. Jaiswal a, *, S. Al-Bulushi a, P. Dewangan b
a Boone Pickens School of Geology, Oklahoma State University, Stillwater, OK 74078, USAb CSIR-National Institute of Oceanography, Dona Paula, Goa 403004, India
a r t i c l e i n f o
Article history:Received 1 December 2013Received in revised form5 May 2014Accepted 11 May 2014Available online 21 May 2014
Keywords:Gas hydrateFractureRock-physics
* Corresponding author. Tel.: þ1 405 744 6041; faxE-mail address: [email protected] (P. Ja
http://dx.doi.org/10.1016/j.marpetgeo.2014.05.0060264-8172/© 2014 Elsevier Ltd. All rights reserved.
a b s t r a c t
At Site NGHP-01-10, KrishnaeGodavari Basin, India, the downhole wireline logging tool measured higherporosity and sonic velocities in gas hydrate-bearing sediments compared to the logging-while-drilling(LWD) acquired data in two closely spaced wells (~10 m). Using a rock physics model that assumesrandom fractures in unconsolidated sediments using HashineShtrikman bounds, we show that differ-ence in physical properties could be due to intra-site difference in the distribution and pattern ofhydrate-filled fractures rather than differences in the volume of gas hydrate. Our fracture-inclusivemodel suggests that between the two holes the porosity and hydrate saturation of the backgroundsediments is similar while porosity and hydrate saturation of the fracture systems change considerably,resulting in the change of the sonic log responses. Relative changes in hydrate saturation betweensediments and fractures at 90 m below the sea floor (mbsf) depth (at a prominent seismic horizon),suggests that fracture-filling hydrate could have partly originated as pore-filling material in the sedi-ments and grew as fracture-filling material as a result of fluid flow. The volume fracture profile of hydrate(fracture porosity � fracture saturation) between the two holes further suggests that the higher con-centration of fractures in the wireline hole may not be a natural in-situ condition but rather a mani-festation of the drilling compounded with time lapse in data recording between the LWD and wirelinelog data. Frequently reported, worldwide, intra-site variability in hydrate saturation from LWD andwireline logs in close proximity could be more related to interpretative methods than actual geologicvariability.
© 2014 Elsevier Ltd. All rights reserved.
1. Introduction
Gas hydrate is an ice-like material made up of gas (mostlymethane) and water stable under a narrow range of pressure (P)and temperature (T) conditions. In marine environments, it existswithin top few hundred meters of the seafloor. In theory, hydratecan form wherever light hydrocarbon gases saturate pore watersbetween the seafloor and the base of the gas hydrate stability zone.Hydrate forms from the pore water when the concentration of thedissolved gas exceeds its solubility. Hydrate forms condensed gasreservoirs: 1 m3 of hydrate contains ~164 m3 gas at surface P and Tconditions (Sloan and Koh, 2007). Pressure e temperature condi-tions along continental margins favor presence of gas hydrate(Milkov, 2004). Due to its widespread occurrence, large volumetricpotential, and limited stability conditions, gas hydrate may play a
: þ1 405 334 7841.iswal).
significant role in climate change (Gu et al., 2011), seafloor stability(Brown et al., 2006), and energy security (Boswell and Collett,2011).
One of the most effective approaches to assess gas hydrate re-sources is through drilling and the analysis of downhole well logdata. Downhole logging is similar to surface geophysical tech-niques, but with very limited survey aperture due to close sourceand receiver spacing. There are two methods of logging: wirelinelogging (WL) and logging-while-drilling (LWD) TheWLmethod hasbeen in practice since the early 1900's. InWL logging an assembly oftools is lowered into a borehole, the tools acquire and store data,the time-lapse between drilling and WL data recording can beseveral tens of hours. The LWD method was introduced in part toovercome the delay in the time between drilling and data mea-surement. Also decisions onwell trajectory could bemade based onreal-time measurements. In general, in a LWD assembly, three ac-celerometers (for inclination) and three magnetometers (for azi-muth) are orthogonally mounted within the tool assembly. Thesedirectional sensors along with other sensors (density, neutron
P. Jaiswal et al. / Marine and Petroleum Geology 58 (2014) 331e338332
porosity, resistivity, acoustic, etc.) are connected to a “mud-pulse”unit which converts and sends data to surface using “mud pulsetelemetry” (i.e., by varying the drilling fluid (mud) pressure). Thepressure fluctuations are decoded on surface. After the LWD toolsare retrieved the onboard tool memory is down loaded. Althoughthe time-lapse in theWLmethods can lead to the hole degradation,the biggest advantage of WL logging is that the core hole can besurveyed with wireline tools.
Gas hydrate scientific drilling along the Indian continentalmargins was conducted in 2007 through a joint venture betweenUnited States Geological Survey and Directorate General of Hy-drocarbons, India. In the expedition, known as the National GasHydrate Program Expedition 1 (NGHP-01), coring, LWD and WLlogging operations were performed. One of the most comprehen-sive datasets in the entire NGHP-01 expedition were acquired atSite NGHP-01-10 (hereafter in this report named Site 10) in theKrishnaeGodavari (KG) Basinwhere four holes named 10A through10D, were established within 20 m of each other for the acquisitionof coring and/or logging data (Collett et al., 2008). At Hole 10B,which was a dedicated core hole, 128 m of hydrate-filled fracturedsediments were recovered. A total of three pressurized cores werealso recovered from Hole 10B, which were then depressurized atthe surface and yielded gas hydrate saturations ranging from 22 to24%. Hole 10A (10 m NW of 10B) was dedicated to LWD and ishereafter referred to as the LWD hole at Site 10. Hole 10D (10mNWof Hole 10A) was logged using WL tools and is hereafter referred toas the WL hole at Site 10. The distribution of gas hydrate appearedto be highly variable between the Site 10 continuous corehole (Hole10B) and the LWD hole (Hole A), and the WL log hole (Hole 10D).
Although depressurizing core samples provide most accuratehydrate estimates, time constraints often limit the number ofpressure core deployments, leading to the increase us of downholeacquired log data. The goal of this study is to understand the dif-ferences in the WL and LWD acquired logs and compare them tohydrate saturations inferred from pressure-core depressurizationtests. .
In this study, it is proposed that the higher sonic velocities andporosity values measured in the Site 10 WL hole, in comparison tothose values measured in the LWD hole, may be the result of theintrinsic variability in hydrate-bearing sediment conditions be-tween the two holes. Differences in LWD and WL derived data,however, may also be a product of the use of different drilling anddownhole logging technologies. Similar data variability have beenfound associated with other gas hydrate drilling projects on theCascadia Margin (Goldberg et al., 2008) and in the Ulleang Basin(Kim et al., 2011), suggesting that this phenomenon might be aconsequence of the drilling and/or logging procedures andtechnology.
The nature of gas hydrate distribution, saturation and habit(grain displacing, pore filling, etc.) at Site 10 is no known for certain.For example, using Archie equation (which assumes isotropicsandstone reservoir conditions) and WL resistivity log data, Collettet al. (2008) estimated ~85% saturation between 27 and 90m belowthe sea floor (mbsf) which was a marked increase over that derivedfrom X-ray CT measurements by Rees et al. (2011) within the sameinterval. Lee and Collett's (2009) velocity modeling with three-phase Biot-type equation reduced the estimated hydrate satura-tion to ~65%, which is still substantially higher than that obtained incore depressurization tests.
The core from Hole 10B clearly shows fractures (Collett et al.,2008), which have been implicitly incorporated in the variousreservoir rock models with only limited success. Lee and Collett(2009) attempted to match compressional- and shear-wave ve-locities (VP and VS) with a common fracture dip angles, modelsassuming a fracture dip of ~84� which yielded Vp estimates similar
to the pressure core estimates, but the Vs derived saturations variedgreatly. Cook et al. (2010) modified Archie's type equation to ac-count for fractures at sub-vertical angles and showed that dippingfractures can also create electrical anisotropy; saturations derivedfrom resistivity models were most similar to log derived satura-tions at an assumed 70e80� fracture dip angle, but had high un-certainties. Similarly, Ghosh et al. (2010) modified a grain-displacing model that assumes gas hydrate occur as oblique ellip-soids to imitate a fracture geometry. Their results were comparableto the pressure core derived gas hydrate saturations but un-certainties in the saturation estimates were as much as 50% atvarious depths, which suggest that the rock physics models used forhydrate quantification at Site 10 may need to be revisited.
Given the differences in the physics of WL and LWD measure-ments, it is desirable to understand which method is more reliablefor gas hydrate quantification. In this paper, we show that bothmethods yield similar estimates of gas hydrate saturations,providing the rock physics models are able to account for thechanges in sediment properties that result from drilling. It is ex-pected that drilling in unconsolidated sediments will disturb theformation and possibly create fractures. Because fractures havehigher permeability than the surrounding often clay-rich marinesediments, fluid flow along fractures tend to allow for the accu-mulation of hydrate over time (Bhatnagar et al., 2007). In this study,this becomes relevant if the time-lapse between drilling and WLlogging is long enough to re-distribute gas hydrate within thestability zone and has a measureable effect on measured sonicvelocities. We present evidence at Site 10 this could indeed be thecase. Although we are not refuting the possibility of previousmodels, a more thorough, both experimental and numericalinvestigation using additional data from other sites is needed forconfirmation.
Most of the models used to characterize Site 10, whetheranisotropic or isotropic models, are exclusive, in that gas hydrate isconsidered to be either present only in fractures or only in thesurrounding sediments. We propose that at Site 10, gas hydrate ispresent in both fractures and in the surrounding sediments. Theimpetus for our proposal comes from observation made by Collettet al. (2008) in the NGHP-10B-18Y pressure core, in which “thebulk of the gas hydrate in this core must be in a more distributedform that is below the resolution of the X-ray images, or indeed thenaked eye.” Collett et al. (2008) further speculated that dissemi-nated hydrate could have displaced pore water and sedimentgrains, which potentially contributed to the observed increase inelastic velocities. We also suggest that the fracture-driven anisot-ropy at Site 10 may not be as strong as previously imagined; equal-area lower-hemisphere projection of fractures in Hole 10A fromCook et al. (2010) and Hole 10B from Rees et al. (2011) suggest arelatively random fracture orientation.
This paper is organized as follows. We first present a modelwhere fractures can be incorporated in the rock-physics model byusing a mixing law relationship that follows the HashineShtrikman(HS) bounds (Wang, 2001). The biggest advantage of this model isits flexibilitye it allows accounting for the density and connectivityof fractures and simultaneous placement of hydrate in sediments(as either pore-filling or grain displacement substances) and frac-tures. Further, the model automatically assumes random fractureswith no bearing on system anisotropy. Next, using this model, weshow that the hydrate saturations estimated from pressure-coredepressurization test can be accounted for in the imaged frac-tures and surrounding sediments as estimated from the VP and VS
logs in the WL logged hole at Site 10. Following this, we show thatmaintaining the same gas hydrate saturations and sedimentporosity (i.e., not the fractures) portion of LWD logged hole, thelower WL acquired VP can be explained by changing the fracture

P. Jaiswal et al. / Marine and Petroleum Geology 58 (2014) 331e338 333
connectivity and fracture porosity. Finally, we discuss the globalapplicability of this model.
2. Method
Estimating elastic velocities in porous rocks involves recon-structing elastic moduli of dry matrix and pore fluid separatelyfollowed by their comparison through the use of Gassman's re-lationships (Chand et al., 2004). Nur et al. (1991) showed that athigh effective pressures, clean (i.e., low clay content) sandstoneshave a distinct relation between bulk porosity and effective moduli;the trend is linear at the arithmetic mean between pure quartz(zero porosity) and sand assemblage at critical porosity. As the rockbecomes compositionally complex, various mineral mixturesdeform differently in response to the same seismic stress and therelation between the bulk porosity and the effective moduli be-comes non-linear. For mixing various sediment grains in a Hashin-type assemblage (Hashin and Shtrikman, 1963), in which a poretopology undergoes uniform deformation, two end-member tra-jectories in the moduluseporosity plane connecting zero and crit-ical porosity have been proposed. Assemblage resembling a soft
KD=I ¼
264X3
i¼1
fi
Ki þ43Gðmin=maxÞ
375�1
� 43Gðmin=maxÞ; GD=I ¼
"X3i¼1
fiGi þ Zðmin=maxÞ
#�1
� Zðmin=maxÞ
Zðmin;maxÞ ¼16Gðmin=maxÞ
9Kðmin=maxÞ þ 8Gðmin=maxÞKðmin=maxÞ þ 2Gðmin=maxÞ
!;
(1)
core encased in a stiff shell follows the modified upper HS bounds(Gal et al., 1998) and that resembling stiff core encased by soft shellfollow the modified lower HS bounds (Dvorkin and Nur, 1996). Weextend this consideration to mix hydrate-filled fracture and sedi-ment system model. This model assumes that the rock is a com-bination of background sediments and hydrate-filled fractureswhere the “background sediments” can be described as anassemblage of random spheres with fully interconnected pores(Helgerud et al., 1999). It is assumed, the hydrate-filled fractures arestiffer than the background sediments, which holds even in thepresence of fluids in the fractures. Its physical realization can beunderstood through fractures that are created by hydrate, whenhydrate tends to be at the interface between fluid and sediments(Jain and Juanes, 2009). Two scenarios can be conceived: First, thefluid can be encased within a hydrate shell (Behseresht et al., 2008;
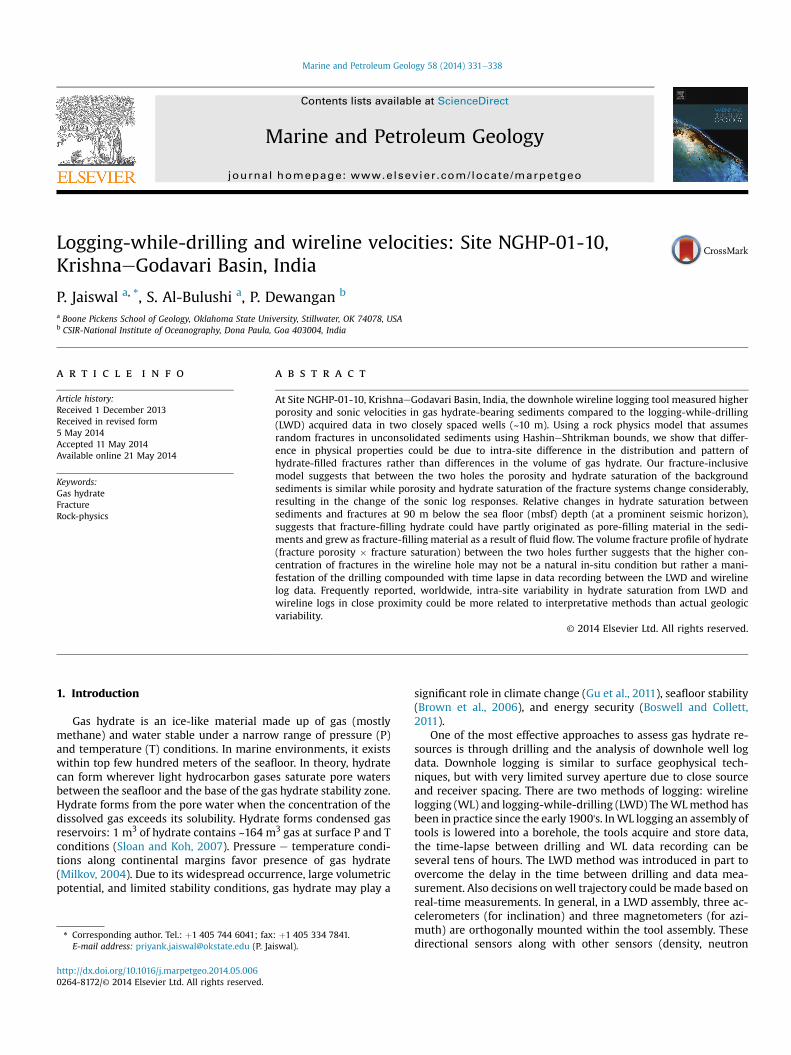
Figure 1. Mixed gas hydrate pore- and fracture-filling models. (a) Disconnected fractures mmodeled with modified upper HS bounds. In (a) and (b) hydrate is attached to mineral gra
Stern et al., 2004). Second, the fluids and hydrate could be separate.In either case, under seismic stress, the volume change of thehydrate-filled part of the fracture will be limited by the presence ofthe gas hydrate. Therefore the hydrate-filled part of the fracturescan be considered as a stiffer component. When the hydrate-filledfractures are disconnected (Fig. 1a), they act like a stiffer core andthe scenario can be described using the lower HS bound. Similarly,when hydrate-filled fractures are interconnected (Fig. 1b), theycould act like a stiffer shell and the scenario can be described usingthe modified upper HS bound. The term connected and discon-nected are not intended to be indicative of the physical appearanceof the fractures, but rather themanner inwhich hydrate are presentwithin the fractures.
Consider a mixture comprising of disconnected/interconnectedhydrate- and brine-filled fractures (annotated D/I) and sediment.The total porosity of the system (ft) will be the sum of porosity ofthe background sediments (fs) and porosity of the fractures (ff). Iff1 e f3 are the volume fractions of the background sediments,hydrate-filled fractures and brine-filled fractures, the bulk (KD/I)and Shear (GD/I) moduli of this mixture can be expressed thoughthe general form of HS bounds (Mavko et al., 2009) as:
In Equation (1), Subscripts min and max refer to the minimumand maximum modulus of the individual minerals or fluids thatmake up the mixture. For example, the mixture described above ismade up of quartz, clay, hydrate and brine. In Equation (1), Kmin andGmin will be 2.37 GPa and 0 GPa corresponding to brine and Kmaxand Gmax will be 36 GPa and 45 GPa corresponding to quartz(Table 1). VP and VS for the mixture can be expressed as:
VD=IP ¼
ffiffiffiffiffiffiffiffiffiffiffiffiffiffiffiffiffiffiffiffiffiffiffiffiffiffiKD=I þ 4
3GD=I
rb
s; VD=I
P ¼ffiffiffiffiffiffiffiffiffiGD=I
rb
s(2)
In Equation (2), rb is the bulk density of the system which isexpressed as:
odeled with lower HashineShtrikman (HS) bounds and (b) interconnected fracturesins and both hydrate and water is present in the fractures.
Core
LWD totalWireline total
a. Porosity (%)
60
70
80
90
100
110
120
130
140D
epth
(msb
l)
0 50 100
LWD FracWireline Frac
10 20 30b. Saturation (%)
LWD Shs = 15%LWD Shf = 50%
WL Shs = 15%WL Shf = 30%
LWD Shs = 23%LWD Shf = 35%
WL Shs = 23%WL Shf = 22%
Core (depressurization)
LWD Wireline
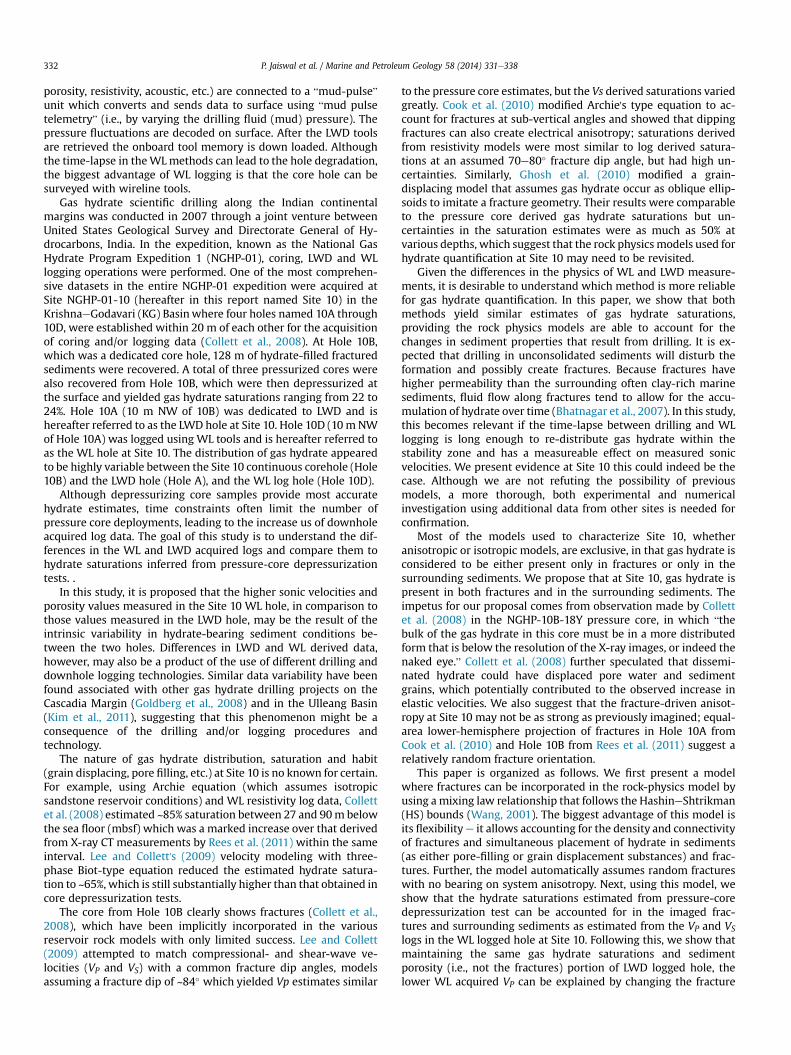
Figure 2. Model inputs. (a) Porosity (b) Gas Hydrate Saturation. In (a) LWD andWireline total porosity (ft) are from the respective neutron logs and shown in red andblue. Measured porosity from core samples from the wireline hole are shown in blackdots. LWD porosity, which is lower than wireline porosity, appears to be closer to thein-situ conditions. The fracture porosity (ff) estimated assuming 55% backgroundporosity (fs), for LWD and wireline is shown in green and black, respectively. In (b),saturation from core depressurization is shown with solid black dots. The blue and redlines are input gas hydrate saturations to the model in the wireline and LWD holescomputed as (Shf*ff þ Shs*fs)/ft, where Shf and Shs are hydrate saturation in fracturesand sediments respectively. The predicted velocities using the model inputs in thisfigure are shown in Figure 3. (For interpretation of the references to color in this figurelegend, the reader is referred to the web version of this article.)
Table 1Parameters used for rock physics modeling.
Systemcomponents
Density(g/cc)
Bulk modulus(Gpa)
Shear modulus(Gpa)
Clay 2.58 21 7Quartz 2.65 36 45Hydrates 0.91 7.7 3.2Water 1.033 2.37 0
P. Jaiswal et al. / Marine and Petroleum Geology 58 (2014) 331e338334
rb ¼�1� ff
�$rs þ ff $rf (3)
In Equation (3) rf is the density of hydrate-filled part of thefracture and rs is the bulk density of the background sedimentwhich in turn are calculated as follows:
rf ¼ Shf rh þ�1� Shf
�rw
rs ¼ ð1� fsÞrm þ fsrpf
(4)
In Equation (4), Shf is the hydrate saturation in fracture, rh, rw, rmand rpf are densities of hydrate, brine, dry matrix of the backgroundsediment and pore fluid of the background sediments respectively.The pore fluid in Equation (4) could be replaced with brine if gashydrate is not present in the background sediments. In this case, gashydrate are assumed to be present in the background sediments(say with saturation Shs), depending on whether they have pore-filling or grain-displacing form, both rm and rpf can be modifiedaccordingly (Dvorkin et al., 2003; Helgerud et al., 2000). When bothgas hydrate and brine are present in fracture, the volume fractionsof the mixture constituents in terms of ff can be expressedas,f1 ¼1� ff, f2 ¼ ff$Shf, and f3 ¼ ff$(1� Shf). When gas hydrate andbrine are separate in the fractures, for modeling stability it becomesnecessary to merge the brine-filled part of the fracture with back-ground sediment. We alter the porosity of the fracture and thebackground sediments as fnew
f ¼ ff � f3 andfnews ¼ fs þ f3. Due to
the unconsolidated nature of the background sediments, their Kand G are always computed using the modified lower HS bounds.
3. Application and results
Due to the physics of wave propagation, unknowns such as fs, ff,Shf, Shs, the form of hydrate in the background sediments (pore-filling or load-bearing), and the nature of fracture connectivity(interconnected vs. disconnected) cannot be directly calculatedfrom elastic velocities. However, they can be made to serve as inputto a rock physics model where the output is elastic velocities.Consequently, by changing the inputs and comparing the outputsthe individual input parameters can be iteratively inferred. A robustrock physics model should be able to incorporate information aboutthe rock fabric in a very detailed manner for computing the ve-locities. Such detail information is typically not available; for rea-sons of simplicity, certain assumptions are made. In our case, weassume that (a) fs is constant within depth interval from 65 to140 m below the seafloor (mbsf), and (b) the form of hydrate insediment does not change from one borehole to another. The firstassumption is based on the character of neutron porosity logs(Fig. 2a) in both the LWD and WL hole, which suggests that thesediments are fairly uniform with depth at Site 10. Due to areasonable agreement with core porosity (Fig. 2a) we use theneutron porosity as a proxy for ft in both holes.
We start our modeling at theWL hole with fs¼ 10% (90% of totalporosity is due to fractures) and Shs ¼ 0 (all of the gas hydrate is infractures). Then, we compute VP and VS using Equations (1)e(4) forthe entire depth of the WL hole for both interconnected and
disconnected cases; this constitutes a single forward modeling run.For every forward model run, we compute the error between pre-dicted and log velocities for both interconnected and disconnectedcases in a root-mean-square (RMS) sense as:
ERMS ¼1n
ffiffiffiffiffiffiffiffiffiffiffiffiffiffiffiffiffiffiffiffiffiffiffiffiffiffiffiffiffiffiffiffiffiffiffiffiffiffiffiffiffiffiffiffiffiffiffiffiffiffiffiffiffiffiffiffiffiffiffiffiffiffiffiffiffiffiffiffiffiffiffiffiffiffiffiffiffiXni¼1
�VPiP � VOi
P
�sP
2
þXni¼1
�VPis � VOi
s
�sS
2vuuut (5)
In Equation (5), n is the number of downhole log measured datapoints (460), superscripts Pi and Oi denote the ith predicted andobserved data point and sP and sS are standard deviations in the VP
and VS logs respectively. Standard deviation implies variations withrespect to the derived mean value. In the VP and VS logs, the meancould be thought of representing velocity of the background sedi-ment, which is considered to be homogenous in this study, whilethe standard deviation can be considered to be perturbations in thesections physical property due to fractures. Considering individuallogs as independent time series, the WL compressional-wave soniclog yields a mean velocity of 1.85 km/s and a sP of 74 m/s, the WLshear-wave sonic log has a mean value of 0.405 km/s and a sS of64 m/s and the LWD compressional-wave sonic log has a meanvalue of 1.715 km/s and a sP of 50 m/s.
Our model (Equations (1)e(4)) is populated in a heuristicmanner. The model inputs are porosities and fluid saturations andthe model output are the elastic velocities. The model has four

a. Vp (km/s) b. Vs (km/s) c. Vp (km/s)1.5 2 0.2 0.4 0.6 1.5 2
10D (Wireline)
Lower HS bound (disconnected)Upper HS bound (interconnected)
log
10A (LWD)
60
70
80
90
100
110
120
130
140
Dep
th (m
sbl)
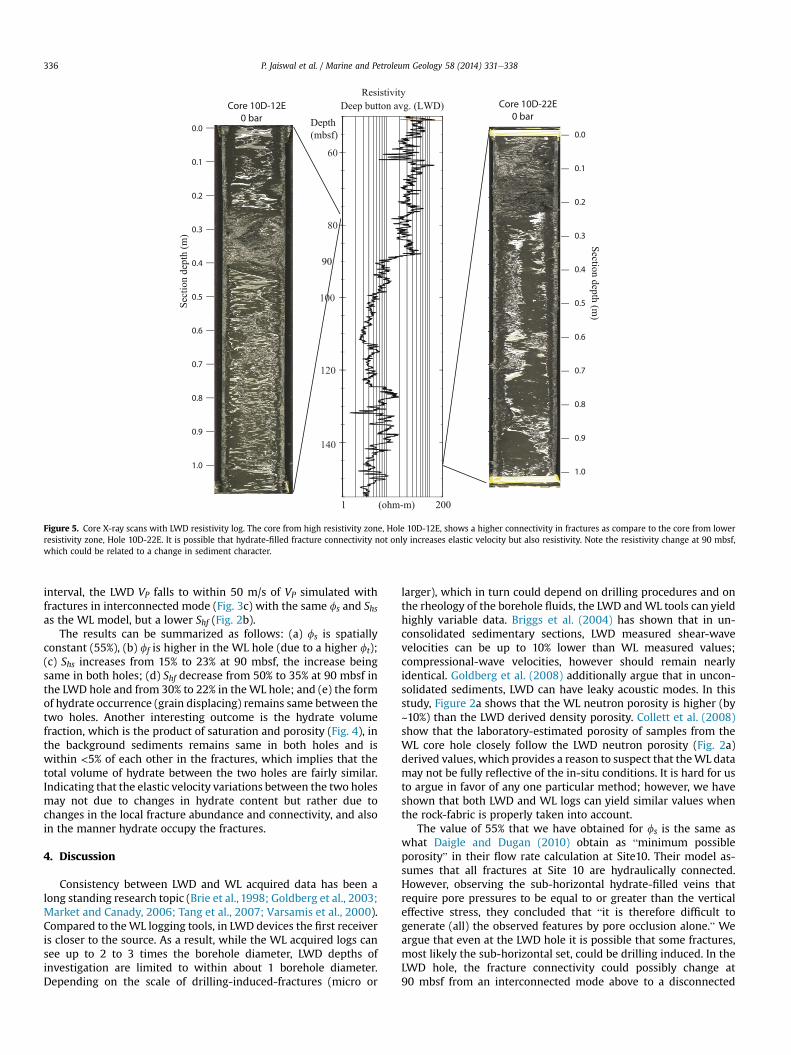
Figure 3. Model outputs. (a) Wireline VP, (b) Wireline VS and (c) LWD VP. In (a), (b) and(c) the log data are in black, predicted data with disconnected fractures (lowerHashineShtrikman (HS) bound) are in red and predicted with interconnected fracture(modified upper SH bound) is in green. For individual logs, the mean is shown with adashed black line and the standard deviation is shaded in transparent yellow.
0 10
10D 10A/D
Volume Fraction (%)
10A
Shs * φs
Shf * φf
Figure 4. Hydrate volume fraction (saturation � porosity) in the background (dashed),wireline fractures (blue) and LWD fractures (red). This figure and 2(b) suggest thatalthough there is minor intra-site variation in gas hydrate saturations between thewireline and LWD holes, there is a large change in fracture abundance (ff roughlydoubles from LWD to wireline hole) between the two holes. (For interpretation of thereferences to color in this figure legend, the reader is referred to the web version of thisarticle.)
P. Jaiswal et al. / Marine and Petroleum Geology 58 (2014) 331e338 335
input parameters e ff,fs, Shf, and Shs. The ff is computed as ft e fs,leaving only three independent parameters. In principle, it ispossible to vary the four input parameters such that VP and VS willindependently matched at every depth. We instead aim to adjustthe input parameters such that the LWD and WL elastic velocitiesare simultaneously matched (fitted at the level of their respectiveuncertainties). The only model constrain is the total saturation, Sht,as measured by pressure core depressurization experiments atthree depths at Site 10: 21% at 88 mbsf to 22% at 97 mbsf to 24% at118 mbsf (Fig. 2b). Thus, the ultimate goal of modeling exercise isnot only to fit the elastic velocities but also to make sure that theinput saturations are consistent with Sht.
It is notable that despite large variation in elastic velocities(Fig. 3), Sht remains fairly consistent (standard deviation of 3%),which suggests that observed velocity variations could be due tofactors other than variations in gas hydrate saturations. As previ-ously observed, ft also has very little variation within the boreholeencouraging us to keep the input parameters spatially invariant asmuch as possible. While building the model, we manually variedthe input parameters in a trial and error manner, such that(frShf þ fsShs)/(fr þ fs) remains within 3% of Sht at each respectivedepth. Any change in our inputs parameters, mainly fs, physicallyimplies a change in lithology; therefore, we change fs only whennecessary.
We found that by dividing the stratigraphic section into twounits, with the contact between the two units at 90 mbsf, we couldnot only fit the velocities to within their respective uncertaintiesbut also honor Sht; with the model parameters remaining constantat each depth. In the NGHP01 expedition report, however, theredoes not appear to be a change in the sediment characteristics at adepth of 90 mbsf. The LWD Resistivity-At-Bit (RAB) images are
reported to “lose strength” below 90 mbsf (Collett et al., 2008),which might be attributed to a change in sediment properties.Additionally, in the seismic profile from Jaiswal et al. (2012b) a highamplitude horizon, labeled H2, appears to be cross Site 10 at about90 mbsf, which likely represent some type of the change in thephysical properties of the sedimentary section. It is possible thatthe sediment character, and consequently the mechanical strength,changes at this depth which has implications on the fracture con-nectivity assumed in our model.
Within the 65 to 90 mbsf depth interval at Site 10, with fs ¼ 55%and ff ¼ ft � 55% (Fig. 2a), Shs ¼ 15% with hydrate in the load-bearing form and Shf ¼ 30%, the WL VP and VS falls to within74 m/s and 64 m/s, respectively, of the VP and VS simulated withinterconnected fractures (Fig. 3a and b). Within the same depthinterval, the LWD VP also falls to within 50 m/s of the simulated VP
with interconnected fractures (Fig. 3c) and same fs and Shs as theWL hole but a higher Shf (Fig. 2b). Within the 90 to 135 mbsf depthinterval, with fs ¼ 55% and ff ¼ ft � 55% (Fig. 2a), Shs ¼ 23% withhydrate in a load-bearing form, and Shf ¼ 22%, theWLVP and VS fallsto within 74 m/s and 64 m/s, respectively, of VP and VS simulatedwith interconnected fractures (Fig. 3a and b). Within the same
1 200
Resistivity
(ohm-m)
Deep button avg. (LWD)
Section depth (m)
0.0
1.0
0.1
0.2
0.3
0.4
0.5
0.6
0.7
0.8
0.9
Core 10D-12E 0 bar
60
80
100
120
140
Depth (mbsf)
90
Sect
ion
dept
h (m
)
0.0
1.0
0.1
0.2
0.3
0.4
0.5
0.6
0.7
0.8
0.9
Core 10D-22E 0 bar
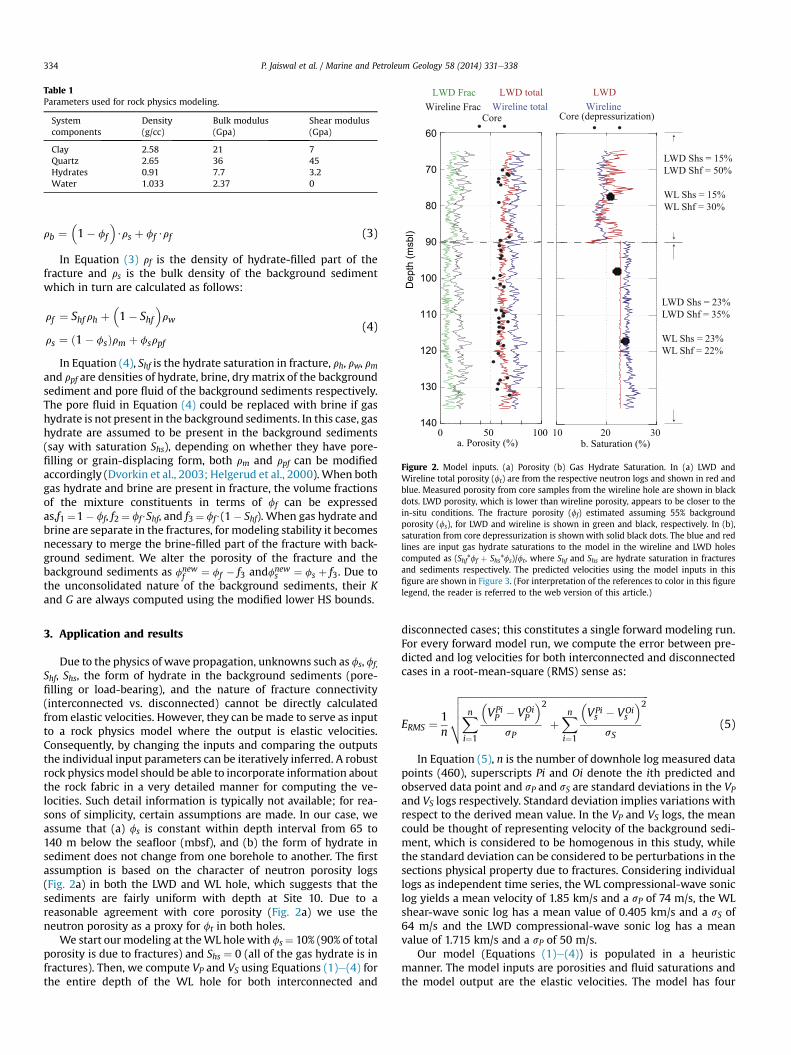
Figure 5. Core X-ray scans with LWD resistivity log. The core from high resistivity zone, Hole 10D-12E, shows a higher connectivity in fractures as compare to the core from lowerresistivity zone, Hole 10D-22E. It is possible that hydrate-filled fracture connectivity not only increases elastic velocity but also resistivity. Note the resistivity change at 90 mbsf,which could be related to a change in sediment character.
P. Jaiswal et al. / Marine and Petroleum Geology 58 (2014) 331e338336
interval, the LWD VP falls to within 50 m/s of VP simulated withfractures in interconnected mode (Fig. 3c) with the same fs and Shsas the WL model, but a lower Shf (Fig. 2b).
The results can be summarized as follows: (a) fs is spatiallyconstant (55%), (b) ff is higher in the WL hole (due to a higher ft);(c) Shs increases from 15% to 23% at 90 mbsf, the increase beingsame in both holes; (d) Shf decrease from 50% to 35% at 90 mbsf inthe LWD hole and from 30% to 22% in theWL hole; and (e) the formof hydrate occurrence (grain displacing) remains same between thetwo holes. Another interesting outcome is the hydrate volumefraction, which is the product of saturation and porosity (Fig. 4), inthe background sediments remains same in both holes and iswithin <5% of each other in the fractures, which implies that thetotal volume of hydrate between the two holes are fairly similar.Indicating that the elastic velocity variations between the two holesmay not due to changes in hydrate content but rather due tochanges in the local fracture abundance and connectivity, and alsoin the manner hydrate occupy the fractures.
4. Discussion
Consistency between LWD and WL acquired data has been along standing research topic (Brie et al., 1998; Goldberg et al., 2003;Market and Canady, 2006; Tang et al., 2007; Varsamis et al., 2000).Compared to theWL logging tools, in LWD devices the first receiveris closer to the source. As a result, while the WL acquired logs cansee up to 2 to 3 times the borehole diameter, LWD depths ofinvestigation are limited to within about 1 borehole diameter.Depending on the scale of drilling-induced-fractures (micro or
larger), which in turn could depend on drilling procedures and onthe rheology of the borehole fluids, the LWD andWL tools can yieldhighly variable data. Briggs et al. (2004) has shown that in un-consolidated sedimentary sections, LWD measured shear-wavevelocities can be up to 10% lower than WL measured values;compressional-wave velocities, however should remain nearlyidentical. Goldberg et al. (2008) additionally argue that in uncon-solidated sediments, LWD can have leaky acoustic modes. In thisstudy, Figure 2a shows that the WL neutron porosity is higher (by~10%) than the LWD derived density porosity. Collett et al. (2008)show that the laboratory-estimated porosity of samples from theWL core hole closely follow the LWD neutron porosity (Fig. 2a)derived values, which provides a reason to suspect that theWL datamay not be fully reflective of the in-situ conditions. It is hard for usto argue in favor of any one particular method; however, we haveshown that both LWD and WL logs can yield similar values whenthe rock-fabric is properly taken into account.
The value of 55% that we have obtained for fs is the same aswhat Daigle and Dugan (2010) obtain as “minimum possibleporosity” in their flow rate calculation at Site10. Their model as-sumes that all fractures at Site 10 are hydraulically connected.However, observing the sub-horizontal hydrate-filled veins thatrequire pore pressures to be equal to or greater than the verticaleffective stress, they concluded that “it is therefore difficult togenerate (all) the observed features by pore occlusion alone.” Weargue that even at the LWD hole it is possible that some fractures,most likely the sub-horizontal set, could be drilling induced. In theLWD hole, the fracture connectivity could possibly change at90 mbsf from an interconnected mode above to a disconnected
P. Jaiswal et al. / Marine and Petroleum Geology 58 (2014) 331e338 337
mode below. A change in connectivity could be responsible for thechange in the observed LWD RAB image character. Fractures in theWL hole appear to be interconnected throughout the length of thehole. If sediments in both holes were in the same state prior todrilling, then it is possible that the delay between drilling and WLlogging could have changed the fracture connectivity.
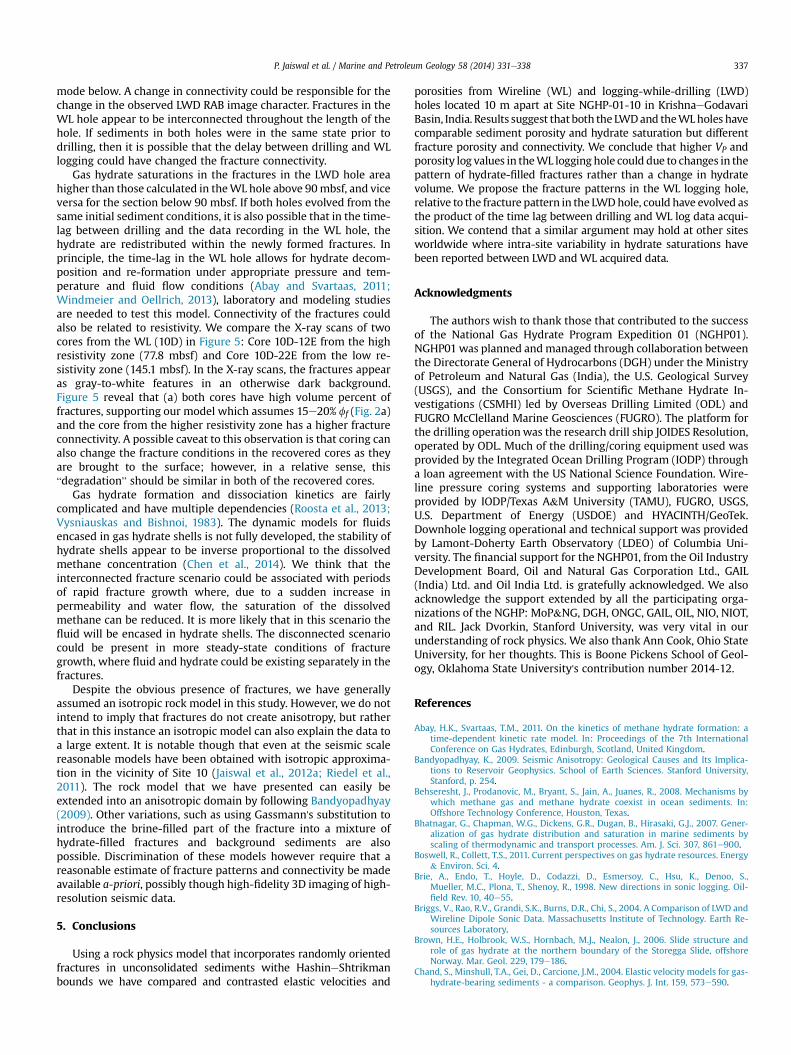
Gas hydrate saturations in the fractures in the LWD hole areahigher than those calculated in theWL hole above 90mbsf, and viceversa for the section below 90 mbsf. If both holes evolved from thesame initial sediment conditions, it is also possible that in the time-lag between drilling and the data recording in the WL hole, thehydrate are redistributed within the newly formed fractures. Inprinciple, the time-lag in the WL hole allows for hydrate decom-position and re-formation under appropriate pressure and tem-perature and fluid flow conditions (Abay and Svartaas, 2011;Windmeier and Oellrich, 2013), laboratory and modeling studiesare needed to test this model. Connectivity of the fractures couldalso be related to resistivity. We compare the X-ray scans of twocores from the WL (10D) in Figure 5: Core 10D-12E from the highresistivity zone (77.8 mbsf) and Core 10D-22E from the low re-sistivity zone (145.1 mbsf). In the X-ray scans, the fractures appearas gray-to-white features in an otherwise dark background.Figure 5 reveal that (a) both cores have high volume percent offractures, supporting our model which assumes 15e20% ff (Fig. 2a)and the core from the higher resistivity zone has a higher fractureconnectivity. A possible caveat to this observation is that coring canalso change the fracture conditions in the recovered cores as theyare brought to the surface; however, in a relative sense, this“degradation” should be similar in both of the recovered cores.
Gas hydrate formation and dissociation kinetics are fairlycomplicated and have multiple dependencies (Roosta et al., 2013;Vysniauskas and Bishnoi, 1983). The dynamic models for fluidsencased in gas hydrate shells is not fully developed, the stability ofhydrate shells appear to be inverse proportional to the dissolvedmethane concentration (Chen et al., 2014). We think that theinterconnected fracture scenario could be associated with periodsof rapid fracture growth where, due to a sudden increase inpermeability and water flow, the saturation of the dissolvedmethane can be reduced. It is more likely that in this scenario thefluid will be encased in hydrate shells. The disconnected scenariocould be present in more steady-state conditions of fracturegrowth, where fluid and hydrate could be existing separately in thefractures.
Despite the obvious presence of fractures, we have generallyassumed an isotropic rock model in this study. However, we do notintend to imply that fractures do not create anisotropy, but ratherthat in this instance an isotropic model can also explain the data toa large extent. It is notable though that even at the seismic scalereasonable models have been obtained with isotropic approxima-tion in the vicinity of Site 10 (Jaiswal et al., 2012a; Riedel et al.,2011). The rock model that we have presented can easily beextended into an anisotropic domain by following Bandyopadhyay(2009). Other variations, such as using Gassmann's substitution tointroduce the brine-filled part of the fracture into a mixture ofhydrate-filled fractures and background sediments are alsopossible. Discrimination of these models however require that areasonable estimate of fracture patterns and connectivity be madeavailable a-priori, possibly though high-fidelity 3D imaging of high-resolution seismic data.
5. Conclusions
Using a rock physics model that incorporates randomly orientedfractures in unconsolidated sediments withe HashineShtrikmanbounds we have compared and contrasted elastic velocities and
porosities from Wireline (WL) and logging-while-drilling (LWD)holes located 10 m apart at Site NGHP-01-10 in KrishnaeGodavariBasin, India. Results suggest that both the LWDand theWLholes havecomparable sediment porosity and hydrate saturation but differentfracture porosity and connectivity. We conclude that higher VP andporosity log values in theWL logging hole could due to changes in thepattern of hydrate-filled fractures rather than a change in hydratevolume. We propose the fracture patterns in the WL logging hole,relative to the fracture pattern in the LWDhole, could have evolved asthe product of the time lag between drilling and WL log data acqui-sition. We contend that a similar argument may hold at other sitesworldwide where intra-site variability in hydrate saturations havebeen reported between LWD andWL acquired data.
Acknowledgments
The authors wish to thank those that contributed to the successof the National Gas Hydrate Program Expedition 01 (NGHP01).NGHP01was planned andmanaged through collaboration betweenthe Directorate General of Hydrocarbons (DGH) under the Ministryof Petroleum and Natural Gas (India), the U.S. Geological Survey(USGS), and the Consortium for Scientific Methane Hydrate In-vestigations (CSMHI) led by Overseas Drilling Limited (ODL) andFUGRO McClelland Marine Geosciences (FUGRO). The platform forthe drilling operationwas the research drill ship JOIDES Resolution,operated by ODL. Much of the drilling/coring equipment used wasprovided by the Integrated Ocean Drilling Program (IODP) througha loan agreement with the US National Science Foundation. Wire-line pressure coring systems and supporting laboratories wereprovided by IODP/Texas A&M University (TAMU), FUGRO, USGS,U.S. Department of Energy (USDOE) and HYACINTH/GeoTek.Downhole logging operational and technical support was providedby Lamont-Doherty Earth Observatory (LDEO) of Columbia Uni-versity. The financial support for the NGHP01, from the Oil IndustryDevelopment Board, Oil and Natural Gas Corporation Ltd., GAIL(India) Ltd. and Oil India Ltd. is gratefully acknowledged. We alsoacknowledge the support extended by all the participating orga-nizations of the NGHP: MoP&NG, DGH, ONGC, GAIL, OIL, NIO, NIOT,and RIL. Jack Dvorkin, Stanford University, was very vital in ourunderstanding of rock physics. We also thank Ann Cook, Ohio StateUniversity, for her thoughts. This is Boone Pickens School of Geol-ogy, Oklahoma State University's contribution number 2014-12.
References
Abay, H.K., Svartaas, T.M., 2011. On the kinetics of methane hydrate formation: atime-dependent kinetic rate model. In: Proceedings of the 7th InternationalConference on Gas Hydrates, Edinburgh, Scotland, United Kingdom.
Bandyopadhyay, K., 2009. Seismic Anisotropy: Geological Causes and Its Implica-tions to Reservoir Geophysics. School of Earth Sciences. Stanford University,Stanford, p. 254.
Behseresht, J., Prodanovic, M., Bryant, S., Jain, A., Juanes, R., 2008. Mechanisms bywhich methane gas and methane hydrate coexist in ocean sediments. In:Offshore Technology Conference, Houston, Texas.
Bhatnagar, G., Chapman, W.G., Dickens, G.R., Dugan, B., Hirasaki, G.J., 2007. Gener-alization of gas hydrate distribution and saturation in marine sediments byscaling of thermodynamic and transport processes. Am. J. Sci. 307, 861e900.
Boswell, R., Collett, T.S., 2011. Current perspectives on gas hydrate resources. Energy& Environ. Sci. 4.
Brie, A., Endo, T., Hoyle, D., Codazzi, D., Esmersoy, C., Hsu, K., Denoo, S.,Mueller, M.C., Plona, T., Shenoy, R., 1998. New directions in sonic logging. Oil-field Rev. 10, 40e55.
Briggs, V., Rao, R.V., Grandi, S.K., Burns, D.R., Chi, S., 2004. A Comparison of LWD andWireline Dipole Sonic Data. Massachusetts Institute of Technology. Earth Re-sources Laboratory.
Brown, H.E., Holbrook, W.S., Hornbach, M.J., Nealon, J., 2006. Slide structure androle of gas hydrate at the northern boundary of the Storegga Slide, offshoreNorway. Mar. Geol. 229, 179e186.
Chand, S., Minshull, T.A., Gei, D., Carcione, J.M., 2004. Elastic velocity models for gas-hydrate-bearing sediments - a comparison. Geophys. J. Int. 159, 573e590.

P. Jaiswal et al. / Marine and Petroleum Geology 58 (2014) 331e338338
Chen, L., Sloan, E.D., Koh, C.A., Sum, A.K., 2014. Methane hydrate formation anddissociation on suspended gas bubbles in water. J. Chem. Eng. Data 59 (4),1045e1051. http://dx.doi.org/10.1021/je400765a.
Collett, T., Riedel, M., Cochran, J., Boswell, R., Presley, J., Kumar, P., Sathe, A., Sethi, A.,Lall, M.V., Sibal, V., 2008. Expedition 01 Initial Reports, New Delhi, India.
Cook, A.E., Anderson, B.I., Malinverno, A., Mrozewski, S., Goldberg, D.S., 2010. Elec-trical anisotropy due to gas hydrate-filled fractures. Geophysics 75, F173eF185.
Daigle, H., Dugan, B., 2010. Origin and evolution of fracture-hosted methane hydratedeposits. J. Geophys. Res. Solid Earth 115.
Dvorkin, J., Nur, A., 1996. Elasticity of high-porosity sandstones: theory for twoNorth Sea data sets. Geophysics 61, 1363e1370.
Dvorkin, J., Nur, A., Uden, R., Taner, T., 2003. Rock physics of a gas hydrate reservoir.Lead. Edge 22, 842e847.
Gal, D., Dvorkin, J., Nur, A., 1998. A physical model for porosity reduction in sand-stones. Geophysics 63, 454e459.
Ghosh, R., Sain, K., Ojha, M., 2010. Effective medium modeling of gas hydrate-filledfractures using the sonic log in the Krishna-Godavari basin, offshore easternIndia. J. Geophys. Res. Solid Earth 115.
Goldberg, D., Cheng, A., Blanch, J., Byun, J.M., Gullick, S., 2003. Analysis of LWD SonicData in Low-velocity Formations, 2003 SEG Annual Meeting. Society of Explo-ration Geophysicists.
Goldberg, D., Guerin, G., Malinverno, A., Cook, A., 2008. Velocity analysis of LWDand Wireline sonic data in hydrate-bearing sediments on the Cascadia Margin.In: Proceedings of the 6th International Conference on Gas Hydrates, Vancou-ver, Canada.
Gu, G., Dickens, G.R., Bhatnagar, G., Colwell, F.S., Hirasaki, G.J., Chapman, W.G., 2011.Abundant Early Palaeogene marine gas hydrates despite warm deep-oceantemperatures. Nat. Geosci. 4, 848e851.
Hashin, Z., Shtrikman, S., 1963. A variational approach to the theory of the elasticbehaviour of multiphase materials. J. Mech. Phys. Solids 11, 127e140.
Helgerud, M.B., Dvorkin, J., Nur, A., 2000. Rock physics characterization for gashydrate reservoirs e elastic properties. In: Holder, G.D., Bishnoi, P.R. (Eds.), GasHydrates: Challenges for the Future, pp. 116e125.
Helgerud, M.B., Dvorkin, J., Nur, A., Sakai, A., Collett, T., 1999. Elastic-wave velocity inmarine sediments with gas hydrates: effective medium modeling. Geophys.Res. Lett. 26, 2021e2024.
Jain, A.K., Juanes, R., 2009. Preferential mode of gas invasion in sediments: grain-scale mechanistic model of coupled multiphase fluid flow and sediment me-chanics. J. Geophys. Res. Solid Earth 114.
Jaiswal, P., Dewangan, P., Ramprasad, T., Zelt, C.A., 2012a. Seismic characterization ofhydrates in faulted, fine-grained sediments of Krishna-Godavari Basin: fullwaveform inversion. J. Geophys. Res. Solid Earth 117, B10305.
Jaiswal, P., Dewangan, P., Ramprasad, T., Zelt, C.A., 2012b. Seismic characterization ofhydrates in faulted, fine-grained sediments of Krishna-Godavari basin: unifiedimaging. J. Geophys. Res. 117, B04306.
Kim, G.Y., Yi, B.Y., Yoo, D.G., Ryu, B.J., Riedel, M., 2011. Evidence of gas hydrate fromdownhole logging data in the Ulleung Basin, East Sea. Mar. Pet. Geol. 28,1979e1985.
Lee, M.W., Collett, T.S., 2009. Gas hydrate saturations estimated from fracturedreservoir at Site NGHP-01-10, Krishna-Godavari Basin, India. J. Geophys. Res.114, B07102.
Market, J., Canady, W.J., 2006. Dispersion Corrections are not just for LWD DipoleSonic Tools. SPE annual Technical Conference and Exhibition. Society of Pe-troleum Engineers, San Antonio, TX, USA.
Mavko, G., Mukerji, T., Dvorkin, J., 2009. The Rock Physics Handbook, second ed.Cambridge University Press, Cambridge, England.
Milkov, A.V., 2004. Global estimates of hydrate-bound gas in marine sediments:how much is really out there? Earth-Sci. Rev. 66, 183e197.
Nur, A., Marion, D., Yin, H., 1991. Wave velocities in sediments. In: Hovem, J.M.,Richardson, M.D., Stoll, R.D. (Eds.), Shear Waves in Marine Sediments. KluwerAcademic Publishers.
Rees, E.V.L., Priest, J.A., Clayton, C.R.I., 2011. The structure of methane gas hydratebearing sediments from the KrishnaeGodavari Basin as seen from Micro-CTscanning. Mar. Pet. Geol. 28, 1283e1293.
Riedel, M., Collett, T.S., Shankar, U., 2011. Documenting channel features associatedwith gas hydrates in the Krishna-Godavari Basin, offshore India. Mar. Geol. 279,1e11.
Roosta, H., Khosharay, S., Varaminian, F., 2013. Experimental study of methanehydrate formation kinetics with or without additives and modeling based onchemical affinity. Energy Convers. Manag. 76, 499e505.
Sloan, E.D., Koh, C., 2007. Clathrate Hydrates of Natural Gases, third ed. CRC Press.Stern, L.A., Kirby, S.H., Circone, S., Durham, W.B., 2004. Scanning electron mi-
croscopy investigations of laboratory-grown gas clathrate hydrates formedfrom melting ice, and comparison to natural hydrates. Am. Mineral. 89,1162e1175.
Tang, X., Lilly, D., Petpisit, K., 2007. Analysis of LWD Acoustic Data Validates itsAccuracy, 48th Annual Logging Symposium. Society of Petrophysicists andWell-Log Analysts.
Varsamis, G.L., Arian, A., Blanch, J., Market, J., Wisniewski, L., Althoff, G., Barnett, C.,2000. LWD Shear Velocity Logging in Slow Formations Design Decisions andCase Histories. SPWLA 41st Annual Logging Symposium. Society of Petrophys-icists and Well-Log Analysts.
Vysniauskas, A., Bishnoi, P.R., 1983. A kinetic study of methane hydrate formation.Chem. Eng. Sci. 38, 1061e1072.
Wang, Z., 2001. Fundamentals of seismic rock physics. Geophysics 66, 398e412.Windmeier, C., Oellrich, L.R., 2013. Theoretical study of gas hydrate decomposition
kinetics: model predictions. J. Phys. Chem. A 117, 12184e12195.


