Embed Size (px)
Citation preview
Agricultural Systems 123 (2014) 43–53
Contents lists available at ScienceDirect
Agricultural Systems
journal homepage: www.elsevier .com/locate /agsy
Life cycle and economic assessment of Western Canadian pulsesystems: The inclusion of pulses in crop rotations
0308-521X/$ - see front matter � 2013 Elsevier Ltd. All rights reserved.http://dx.doi.org/10.1016/j.agsy.2013.08.009
⇑ Corresponding author. Tel.: +1 306 933 5207; fax: +1 306 933 7817.E-mail addresses: [email protected] (S. MacWilliam), [email protected]
(M. Wismer), [email protected] (S. Kulshreshtha).
S. MacWilliam a,⇑, M. Wismer a, S. Kulshreshtha b
a Saskatchewan Research Council, 125-15 Innovation Boulevard, Saskatoon, Saskatchewan S7N 2X8, Canadab Department of Bioresource Policy, Business and Economics, University of Saskatchewan, Saskatoon, Saskatchewan S7N 5A8, Canada
a r t i c l e i n f o a b s t r a c t
Article history:Received 12 July 2012Received in revised form 21 August 2013Accepted 30 August 2013Available online 18 October 2013
Keywords:Life cycle assessmentEconomic assessmentCrop productionDry peaLentilWestern Canada
The introduction of a pulse crop into a cereal production rotation has been widely recognized for the rota-tional benefits resulting from nitrogen fixation and crop diversification. Pulses are the dry, edible seeds ofpod-bearing plants in the legume family, such as dry pea and lentil. Both dry pea and lentil are widelygrown across Western Canada and provide an important source of food and feed worldwide. In addition,these pulse crops demonstrate positive returns over and above the production of traditional crops in mostsituations except when their prices are low. Although the economic and environmental benefits of pulsecrops have been examined in many different capacities, an examination of the rotational implications ofincluding pulse crops in a cereal-based rotation in Western Canada has not been conducted on a life cyclebasis. In this study, life cycle and economic assessments were used to examine the environmental andeconomic implications of including dry pea and lentil crops in an oilseed-cereal rotation in WesternCanada. An analysis was performed in which dry pea or lentil replaced a spring wheat crop in a canola– spring wheat – spring wheat – spring wheat rotation. Pulses were ultimately produced for their proteincontent. Results suggested that introducing dry pea or lentil in the rotation reduced environmentaleffects in all impact categories examined (Global Warming and Resource Use: �17% to �25%; EcosystemQuality: �1% to �24%; and Human Health: �3% to �28%). In addition, the economic benefits of this prac-tice suggested that the farm level returns over variable costs improved for both the dry pea and lentilrotations (from $�20.43 ha�1 for the traditional rotation to $110.45 and $138.78 ha�1, respectively, fordry pea and lentil rotation). These reductions were a result of reduced fertilizer requirements for thepulse-containing rotations (i.e. no application of nitrogen fertilizer to the pulse crop and reduced appli-cation to the succeeding cereal crop) as well as higher cereal yields. Based on these results, improvedreturns to producers and reduced amounts of material and energy inputs can be realized with optimizedcrop management that can include dry pea and/or lentil in rotation with other high yielding crops.Including pulse crops in an oilseed-cereal rotation is an effective method to enhance the economicsand environmental effects of crop production.
� 2013 Elsevier Ltd. All rights reserved.
1. Introduction
The Prairies play an important role in Canadian agriculture, pro-viding 32 million hectares of arable land and accounting forapproximately 85% of farmland. Historically, cereal-fallow rota-tions have been the predominant cropping system in the semiaridCanadian Prairies and northern Great Plains of the United States(US) (Grant et al., 2002; Spratt et al., 1975; Tanaka et al., 2010).The practice of monoculture cereal cropping, however, often re-sults in pest accumulation (Bailey et al., 2000) and other relatedadverse effects, such as increased pesticide requirements. As a
result, crop rotations have diversified to include crops that breakcereal disease and insect cycles, such as pulses.
Pulses are the edible seeds from legume plants, such as dry pea,lentil, dry bean and chickpea. There are several advantages toincluding pulses in crop rotations, for example, pulse crops in arotation break disease and insect cycles and have the ability tofix atmospheric nitrogen. Nitrogen fixation reduces the fertilizerrequirements of the pulse crop itself, as well as the following graincrop. In addition, the inclusion of pulses in a crop rotation im-proves the yield and protein content of the following cereal crop.
The agronomical benefits of including pulse crops in crop rota-tions may result in changes to the environmental effects and eco-nomic implications of crop production by reducing the syntheticnitrogen fertilizer requirements of the rotation and by improvingthe rotational yield and quality of the grain. Furthermore, the
44 S. MacWilliam et al. / Agricultural Systems 123 (2014) 43–53
pesticide and herbicide requirements of the rotation may decreaseand the quality of the soil may improve over time.
The goal of this study was to investigate the environmental ef-fects and economic implications of including dry pea and lentilpulse crops in an oilseed-cereal rotation. This study was performedas part of a larger study where the environmental effects and eco-nomic implications of pulse crop production and subsequent pulsegrain use as animal feed, for human consumption and for ethanolproduction were examined.
2. Materials and methods
2.1. Life cycle assessment
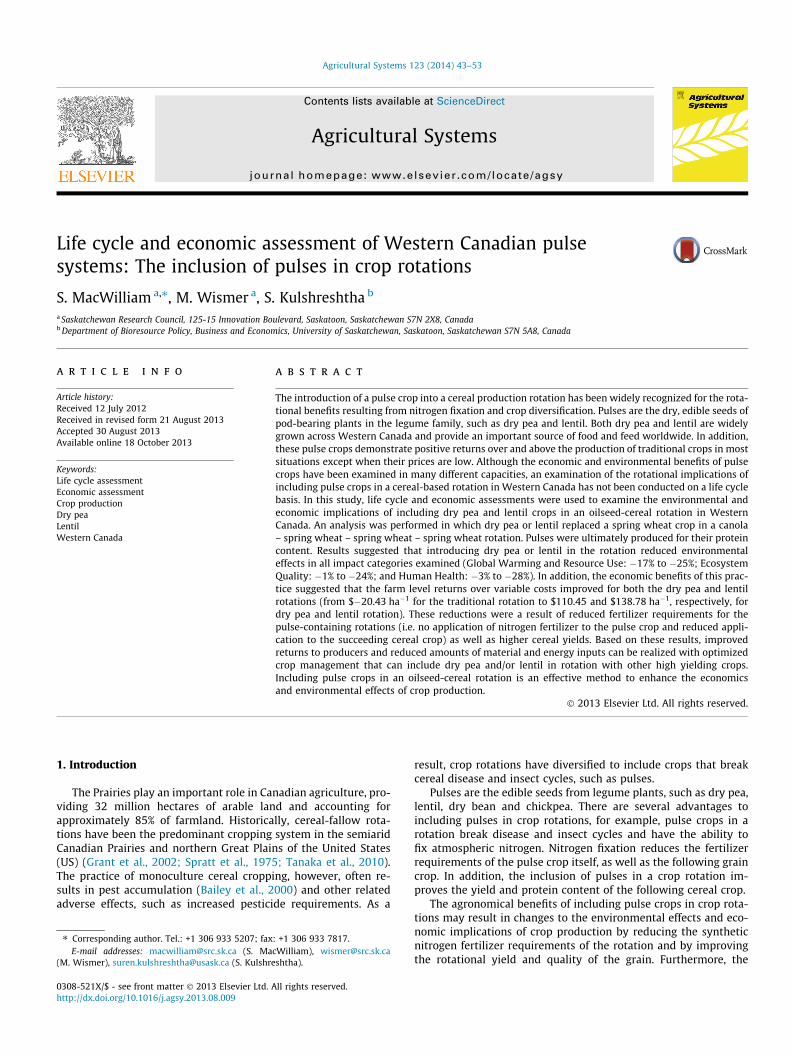
Life cycle assessment (LCA) is a method of examining the envi-ronmental effects of a product, process or system across its entirelife span. In this study, an International Standards Organization(ISO)–compliant (ISO 2006a, 2006b) LCA was conducted to assessthe environmental effects of the inclusion of dry pea and lentil inan oilseed-cereal crop rotation. Results were based on the use ofthe SimaPro (version 7.1.8; PRé, 2009) LCA computer modeling sys-tem, combined with the IMPACT 2002+ midpoint method (Jollietet al., 2003). The IMPACT 2002+ method was updated to analyzeglobal warming over 100 years with the most up to date globalwarming potential (GWP) factors available (IPCC, 2007). Impactassessment categories included impacts to human health (i.e. car-cinogens, non-carcinogens, respiratory inorganics, ionizing radia-tion, ozone layer depletion and respiratory organics), ecosystemsquality (aquatic ecotoxicity, terrestrial ecotoxicity, terrestrial acid-ification/nutrification, land occupation, aquatic acidification andaquatic eutrophication) and global warming and resource use(i.e. non-renewable energy and mineral extraction) (Fig. 1). Furtherdetails on the impact categories are available in Appendix A.
The results of this study were intended to provide objective andtransparent information to the public on the effects of growing andusing pulse crops as well as to guide future research. The LCA wasreviewed by an external, third-party reviewer.
3. Production systems
The potential environmental effects of including pulse crops intoan oilseed-cereal crop rotation were quantified by examining a ca-nola – spring wheat – spring wheat – spring wheat crop rotation(herein referred to as the oilseed-cereal rotation) in comparison
Fig. 1. Midpoint and endpoint categories of the IMPACT 2002+ impact assessmentmethod. Source: Jolliet et al. (2003).
to a canola – spring wheat – dry pea – spring wheat crop rotation(herein referred to as the dry pea rotation) and to a canola – springwheat – lentil – spring wheat crop rotation (herein referred to asthe lentil rotation). Canadian Western Red Spring wheat (Triticumaestivum L.) and canola (Brassica napus L.) were selected as the cer-eal and oilseed crops, while yellow pea (Pisum sativum L.) and largegreen lentil (Lens culinaris Medik) were selected as the pulse crops.The rotations examined are shown in Table 1.
Pulse crops have historically replaced summerfallow in rotation(Nagy, 2001); however, summerfallow has been on the decline inWestern Canada for several years (Carlyle, 1997). Therefore, whenincluded in current agricultural rotations, pulse crops are mostlikely to replace a cereal crop such as spring wheat (SPG, 2000).As such, it was assumed that lentil and dry pea replaced a cerealcrop in rotation.
The majority of existing published literature has examinedeither the ability of pulses to break disease and pest cycles, or toreduce the nitrogen requirement of a succeeding crop. In both sit-uations, pulse crops were most often examined succeeding andpreceding spring wheat crops, respectively. Therefore, the cereal-oilseed rotation selected was canola – spring wheat – spring wheat– spring wheat (herein referred to as the oilseed-cereal rotation).Although three spring wheat crops may not commonly be grownin succession in Western Canada, the selected rotation ensuredthat the LCA was based on the best available field data. To fullyunderstand the impacts of including pulse crops in crop rotations,further analyses where additional crop rotations under variousmanagement practices are considered should be conducted.
4. Functional unit
The function of the crop production system was to producegrain for human consumption. A comparable functional unit must,therefore, represent an equal amount of grain and pulse in terms ofboth yield and nutritive value. As both pulse and cereal grains aresources of protein (Whitney and Rolfes, 2005), protein was selectedas the unit of comparison in terms of nutritive value. A protein con-tent of 14% was selected as it was the average protein content inwheat (all varieties) when all methods of farming and crop rota-tions were included (Edwards et al., 2009). The functional unitwas one tonne of 14% protein-corrected grain (1 t 14% protein-corrected grain).
5. System boundaries
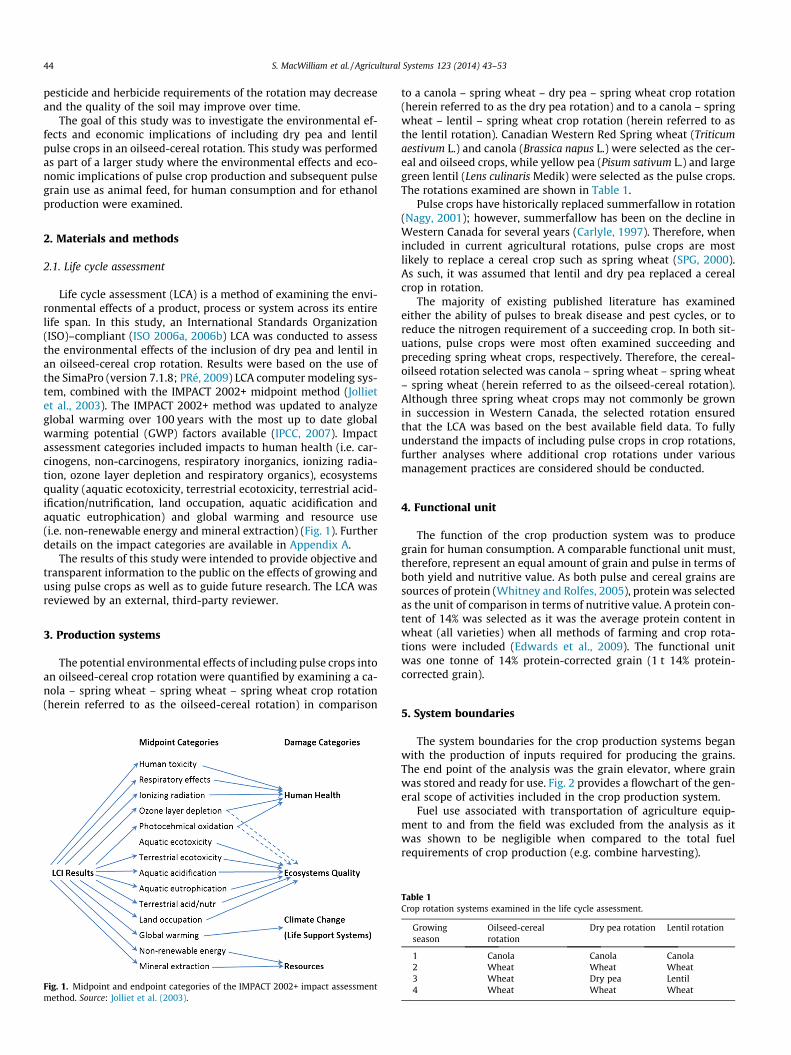
The system boundaries for the crop production systems beganwith the production of inputs required for producing the grains.The end point of the analysis was the grain elevator, where grainwas stored and ready for use. Fig. 2 provides a flowchart of the gen-eral scope of activities included in the crop production system.
Fuel use associated with transportation of agriculture equip-ment to and from the field was excluded from the analysis as itwas shown to be negligible when compared to the total fuelrequirements of crop production (e.g. combine harvesting).
Table 1Crop rotation systems examined in the life cycle assessment.
Growingseason
Oilseed-cerealrotation
Dry pea rotation Lentil rotation
1 Canola Canola Canola2 Wheat Wheat Wheat3 Wheat Dry pea Lentil4 Wheat Wheat Wheat

Fig. 2. General scope of activities included in the life cycle assessment of crop rotations.
S. MacWilliam et al. / Agricultural Systems 123 (2014) 43–53 45
The results of this study are intended to provide insight into theenvironmental effects of replacing a wheat crop with a pulse cropin an oilseed-cereal rotation. It is important to recognize that theseresults are directly related to the crops, farming practices and re-gions specified in this report. Changes in a system are representedboth upstream and downstream of the change and may affect theoverall results. It is important that the results of this study be keptwithin their original context.
6. Data quality and data sources
6.1. Life cycle inventory data quality
The majority of the data used to model crop production wereWestern Canadian-specific. In cases where Western Canadian datawere not available, data were from the United States Life CycleInventory (USLCI) database (NREL, 2003). In cases where data werenot available from Western Canada or the United States, data werefrom the European Ecoinvent v2.0 database (Frischknecht et al.,2007).
The cropping data used were no older than 20 years from theonset of the analysis (2008) and covered no less than one fullcropping season (i.e. four months). Agriculture data are highly
influenced by climatic effects; therefore, data from several growingyears was required for a representative average.
To ensure modeling data accurately represented agriculture inWestern Canada, field data used were from crop producing regionsin Western Canada and studies reflecting the rotations examined inthis LCA. Best practice management was assumed.
The following parameters were set to represent a best manage-ment crop production system: (a) straw is left on the field (i.e. notbaled); (b) all farms are rain fed (i.e. no irrigation); and (c) zero-till-age technology is employed.
Furthermore, as a method of minimizing the data uncertaintyassociated with a broad scale analysis, data were collected fromfarms producing only grain and applying only synthetic fertilizerfor nutrient management.
Sources of data adapted to represent Western Canada includeIPCC (2006), Environment Canada’s National Greenhouse GasInventory (Environment Canada, 2008) and Agriculture and Agri-Food Canada (AAFC) field data from Swift Current, Scott and IndianHead, Saskatchewan (Lemke, R., Personal Communications, 2009).As approximately 78% of dry pea, 99% of lentil, 48% of canola and52% of spring wheat produced in Western Canada are grown in Sas-katchewan (Statistics Canada, 2007), most studies, as well as themajority of data collected, were from Saskatchewan.
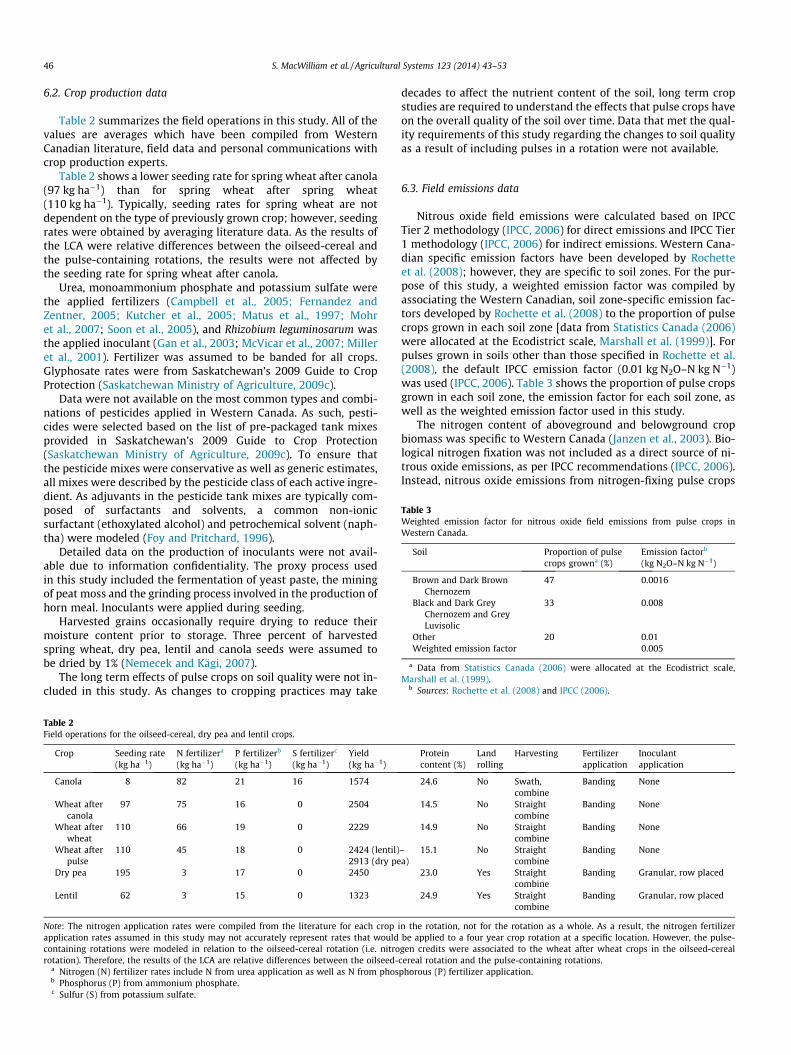
Table 3Weighted emission factor for nitrous oxide field emissions from pulse crops inWestern Canada.
Soil Proportion of pulsecrops growna (%)
Emission factorb
(kg N2O–N kg N�1)
Brown and Dark BrownChernozem
47 0.0016
Black and Dark GreyChernozem and GreyLuvisolic
33 0.008
Other 20 0.01Weighted emission factor 0.005
a Data from Statistics Canada (2006) were allocated at the Ecodistrict scale,Marshall et al. (1999).
b Sources: Rochette et al. (2008) and IPCC (2006).
46 S. MacWilliam et al. / Agricultural Systems 123 (2014) 43–53
6.2. Crop production data
Table 2 summarizes the field operations in this study. All of thevalues are averages which have been compiled from WesternCanadian literature, field data and personal communications withcrop production experts.
Table 2 shows a lower seeding rate for spring wheat after canola(97 kg ha�1) than for spring wheat after spring wheat(110 kg ha�1). Typically, seeding rates for spring wheat are notdependent on the type of previously grown crop; however, seedingrates were obtained by averaging literature data. As the results ofthe LCA were relative differences between the oilseed-cereal andthe pulse-containing rotations, the results were not affected bythe seeding rate for spring wheat after canola.
Urea, monoammonium phosphate and potassium sulfate werethe applied fertilizers (Campbell et al., 2005; Fernandez andZentner, 2005; Kutcher et al., 2005; Matus et al., 1997; Mohret al., 2007; Soon et al., 2005), and Rhizobium leguminosarum wasthe applied inoculant (Gan et al., 2003; McVicar et al., 2007; Milleret al., 2001). Fertilizer was assumed to be banded for all crops.Glyphosate rates were from Saskatchewan’s 2009 Guide to CropProtection (Saskatchewan Ministry of Agriculture, 2009c).
Data were not available on the most common types and combi-nations of pesticides applied in Western Canada. As such, pesti-cides were selected based on the list of pre-packaged tank mixesprovided in Saskatchewan’s 2009 Guide to Crop Protection(Saskatchewan Ministry of Agriculture, 2009c). To ensure thatthe pesticide mixes were conservative as well as generic estimates,all mixes were described by the pesticide class of each active ingre-dient. As adjuvants in the pesticide tank mixes are typically com-posed of surfactants and solvents, a common non-ionicsurfactant (ethoxylated alcohol) and petrochemical solvent (naph-tha) were modeled (Foy and Pritchard, 1996).
Detailed data on the production of inoculants were not avail-able due to information confidentiality. The proxy process usedin this study included the fermentation of yeast paste, the miningof peat moss and the grinding process involved in the production ofhorn meal. Inoculants were applied during seeding.
Harvested grains occasionally require drying to reduce theirmoisture content prior to storage. Three percent of harvestedspring wheat, dry pea, lentil and canola seeds were assumed tobe dried by 1% (Nemecek and Kägi, 2007).
The long term effects of pulse crops on soil quality were not in-cluded in this study. As changes to cropping practices may take
Table 2Field operations for the oilseed-cereal, dry pea and lentil crops.
Crop Seeding rate(kg ha�1)
N fertilizera
(kg ha�1)P fertilizerb
(kg ha�1)S fertilizerc
(kg ha�1)Yield(kg ha�1)
Canola 8 82 21 16 1574
Wheat aftercanola
97 75 16 0 2504
Wheat afterwheat
110 66 19 0 2229
Wheat afterpulse
110 45 18 0 2424 (lentil)2913 (dry pe
Dry pea 195 3 17 0 2450
Lentil 62 3 15 0 1323
Note: The nitrogen application rates were compiled from the literature for each cropapplication rates assumed in this study may not accurately represent rates that wouldcontaining rotations were modeled in relation to the oilseed-cereal rotation (i.e. nitrorotation). Therefore, the results of the LCA are relative differences between the oilseed-
a Nitrogen (N) fertilizer rates include N from urea application as well as N from phosb Phosphorus (P) from ammonium phosphate.c Sulfur (S) from potassium sulfate.
decades to affect the nutrient content of the soil, long term cropstudies are required to understand the effects that pulse crops haveon the overall quality of the soil over time. Data that met the qual-ity requirements of this study regarding the changes to soil qualityas a result of including pulses in a rotation were not available.
6.3. Field emissions data
Nitrous oxide field emissions were calculated based on IPCCTier 2 methodology (IPCC, 2006) for direct emissions and IPCC Tier1 methodology (IPCC, 2006) for indirect emissions. Western Cana-dian specific emission factors have been developed by Rochetteet al. (2008); however, they are specific to soil zones. For the pur-pose of this study, a weighted emission factor was compiled byassociating the Western Canadian, soil zone-specific emission fac-tors developed by Rochette et al. (2008) to the proportion of pulsecrops grown in each soil zone [data from Statistics Canada (2006)were allocated at the Ecodistrict scale, Marshall et al. (1999)]. Forpulses grown in soils other than those specified in Rochette et al.(2008), the default IPCC emission factor (0.01 kg N2O–N kg N�1)was used (IPCC, 2006). Table 3 shows the proportion of pulse cropsgrown in each soil zone, the emission factor for each soil zone, aswell as the weighted emission factor used in this study.
The nitrogen content of aboveground and belowground cropbiomass was specific to Western Canada (Janzen et al., 2003). Bio-logical nitrogen fixation was not included as a direct source of ni-trous oxide emissions, as per IPCC recommendations (IPCC, 2006).Instead, nitrous oxide emissions from nitrogen-fixing pulse crops
Proteincontent (%)
Landrolling
Harvesting Fertilizerapplication
Inoculantapplication
24.6 No Swath,combine
Banding None
14.5 No Straightcombine
Banding None
14.9 No Straightcombine
Banding None
–a)
15.1 No Straightcombine
Banding None
23.0 Yes Straightcombine
Banding Granular, row placed
24.9 Yes Straightcombine
Banding Granular, row placed
in the rotation, not for the rotation as a whole. As a result, the nitrogen fertilizerbe applied to a four year crop rotation at a specific location. However, the pulse-gen credits were associated to the wheat after wheat crops in the oilseed-cerealcereal rotation and the pulse-containing rotations.phorous (P) fertilizer application.
Fig. 3. Comparison of oilseed-cereal rotation to lentil and dry pea rotations.
S. MacWilliam et al. / Agricultural Systems 123 (2014) 43–53 47
were determined from the nitrogen content in the abovegroundand belowground biomass. Ammonia emissions resulting fromurea application were included in the nitrous oxide emission calcu-lations from indirect sources. The default IPCC emission factor forthe volatilization of ammonia was used (0.010 kg N2O–N kg N�1)(IPCC, 2006).
7. Economic assessment
7.1. Materials and methods
Economic analysis can be conducted using a variety of tools,such as a partial equilibrium approach, whole farm system model,static or a dynamic simulation model, or a stochastic dominancemodel. Of these approaches, the static simulation approach is themost appropriate for comparison of economic returns from alter-native rotations and was, therefore, applied in this study. The staticsimulation approach complements LCA as it can be performedusing the exact parameters applied to the LCA. All simulationswere conducted using a standard set of assumptions for marketconditions and physical characteristics of the farm. The onlychanges made under each simulation were those that were specificto the scenario being analyzed.
7.2. Economic assessment data source and quality
A simulation model for the Canadian Prairie Provinces wasdeveloped for the Brown, Dark Brown and Black soil zones. Themodel contained three types of tillage systems, namely, summer-fallow, continuous cropping and direct seeding. The model con-sisted of a series of integrated worksheets linking yield and inputlevels for various crops in each of the three provinces under differ-ent tillage systems.
For each province, soil zone and rotation, the technology of pro-duction was selected for each crop and yield and input levels as-sumed for the LCA were applied. Data for cost of production ofvarious crops reflected 2006 economic and market conditionsand were obtained from the Saskatchewan Ministry of Agriculture(2009a). Producers were assumed to be price takers. In otherwords, a change in the rotation and level of production was as-sumed to not affect the price received at the farm gate. In theBrown soil zone, data on cost of canola production were not avail-
able. As a result, it was assumed that mustard is an equivalent cropfor canola in this soil zone since both of these crops are oilseedcrops. A baseline budget for various crops under analysis is pre-sented in Appendix B.
The economics of a given crop rotation was an aggregation ofthe crops grown over four years. Since rotational benefits occurover different years of production, for comparative purposes, thedata were converted into present value (PV) form by using a dis-count rate of 5%. This level of discount rate is commonly usedand is close to the rate of discount used for public benefit-costanalysis. The PV was calculated using the following equation:
PV Rotation ¼XðNRiÞ=rð1þtÞ i ¼ 1; . . . ;4:
where NR is the net returns from the crop during year i; r is rate ofdiscount (assumed to be 5%); and t is time counter.
An estimation of the economics of a crop rotation for the prov-ince as a whole was conducted using weights for various soil zones,which were based on relative area.
Each of the rotations was further examined using the assump-tions of yield and selected inputs, mainly fertilizer and pesticides,as per the LCA. Other details of cost of production were obtainedfrom the Saskatchewan Ministry of Agriculture (2006). All valuesreflected a 2006 situation and no adjustment in these data weremade. The data on area producing dry pea and lentil were obtainedfrom Statistics Canada (2007). The share of each soil zone withineach of the Census Agriculture Regions (CAR) was calculated byoverlaying a map of rural municipalities for Saskatchewan and soilzone.
Data quality for all the series used in this study was acceptable,primarily because these data were generated using producers’ in-puts for each soil zone using various rotation and tillage systems.However, it should be noted that the management level of produc-ers providing data was not reported, and this may be a limitation interms of management style and its effect on cost of production ofvarious crops.
The data from the Census of Agriculture for the year 2006 werealso of acceptable quality, since these were based on a full censusof producers who provided the information.
Economic data used in this study were obtained from govern-ment sources and were considered to be credible. Although costof production and net return may vary from farm to farm and from
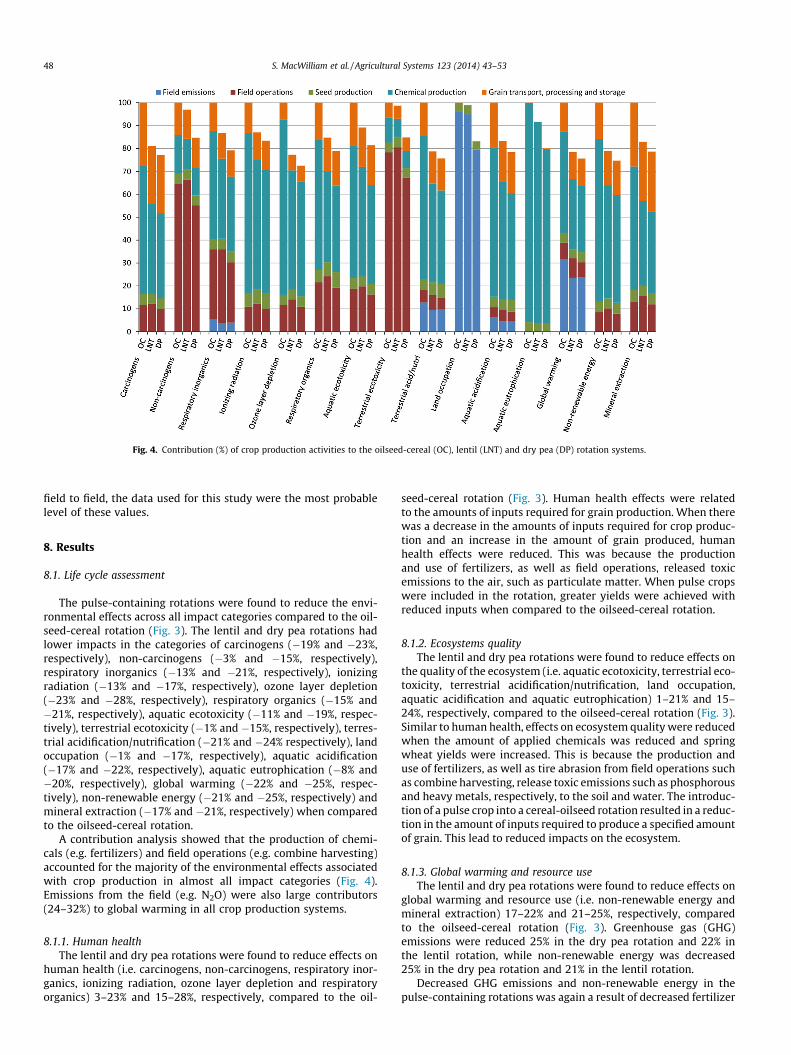
Fig. 4. Contribution (%) of crop production activities to the oilseed-cereal (OC), lentil (LNT) and dry pea (DP) rotation systems.
48 S. MacWilliam et al. / Agricultural Systems 123 (2014) 43–53
field to field, the data used for this study were the most probablelevel of these values.
8. Results
8.1. Life cycle assessment
The pulse-containing rotations were found to reduce the envi-ronmental effects across all impact categories compared to the oil-seed-cereal rotation (Fig. 3). The lentil and dry pea rotations hadlower impacts in the categories of carcinogens (�19% and �23%,respectively), non-carcinogens (�3% and �15%, respectively),respiratory inorganics (�13% and �21%, respectively), ionizingradiation (�13% and �17%, respectively), ozone layer depletion(�23% and �28%, respectively), respiratory organics (�15% and�21%, respectively), aquatic ecotoxicity (�11% and �19%, respec-tively), terrestrial ecotoxicity (�1% and �15%, respectively), terres-trial acidification/nutrification (�21% and �24% respectively), landoccupation (�1% and �17%, respectively), aquatic acidification(�17% and �22%, respectively), aquatic eutrophication (�8% and�20%, respectively), global warming (�22% and �25%, respec-tively), non-renewable energy (�21% and �25%, respectively) andmineral extraction (�17% and �21%, respectively) when comparedto the oilseed-cereal rotation.
A contribution analysis showed that the production of chemi-cals (e.g. fertilizers) and field operations (e.g. combine harvesting)accounted for the majority of the environmental effects associatedwith crop production in almost all impact categories (Fig. 4).Emissions from the field (e.g. N2O) were also large contributors(24–32%) to global warming in all crop production systems.
8.1.1. Human healthThe lentil and dry pea rotations were found to reduce effects on
human health (i.e. carcinogens, non-carcinogens, respiratory inor-ganics, ionizing radiation, ozone layer depletion and respiratoryorganics) 3–23% and 15–28%, respectively, compared to the oil-
seed-cereal rotation (Fig. 3). Human health effects were relatedto the amounts of inputs required for grain production. When therewas a decrease in the amounts of inputs required for crop produc-tion and an increase in the amount of grain produced, humanhealth effects were reduced. This was because the productionand use of fertilizers, as well as field operations, released toxicemissions to the air, such as particulate matter. When pulse cropswere included in the rotation, greater yields were achieved withreduced inputs when compared to the oilseed-cereal rotation.
8.1.2. Ecosystems qualityThe lentil and dry pea rotations were found to reduce effects on
the quality of the ecosystem (i.e. aquatic ecotoxicity, terrestrial eco-toxicity, terrestrial acidification/nutrification, land occupation,aquatic acidification and aquatic eutrophication) 1–21% and 15–24%, respectively, compared to the oilseed-cereal rotation (Fig. 3).Similar to human health, effects on ecosystem quality were reducedwhen the amount of applied chemicals was reduced and springwheat yields were increased. This is because the production anduse of fertilizers, as well as tire abrasion from field operations suchas combine harvesting, release toxic emissions such as phosphorousand heavy metals, respectively, to the soil and water. The introduc-tion of a pulse crop into a cereal-oilseed rotation resulted in a reduc-tion in the amount of inputs required to produce a specified amountof grain. This lead to reduced impacts on the ecosystem.
8.1.3. Global warming and resource useThe lentil and dry pea rotations were found to reduce effects on
global warming and resource use (i.e. non-renewable energy andmineral extraction) 17–22% and 21–25%, respectively, comparedto the oilseed-cereal rotation (Fig. 3). Greenhouse gas (GHG)emissions were reduced 25% in the dry pea rotation and 22% inthe lentil rotation, while non-renewable energy was decreased25% in the dry pea rotation and 21% in the lentil rotation.
Decreased GHG emissions and non-renewable energy in thepulse-containing rotations was again a result of decreased fertilizer
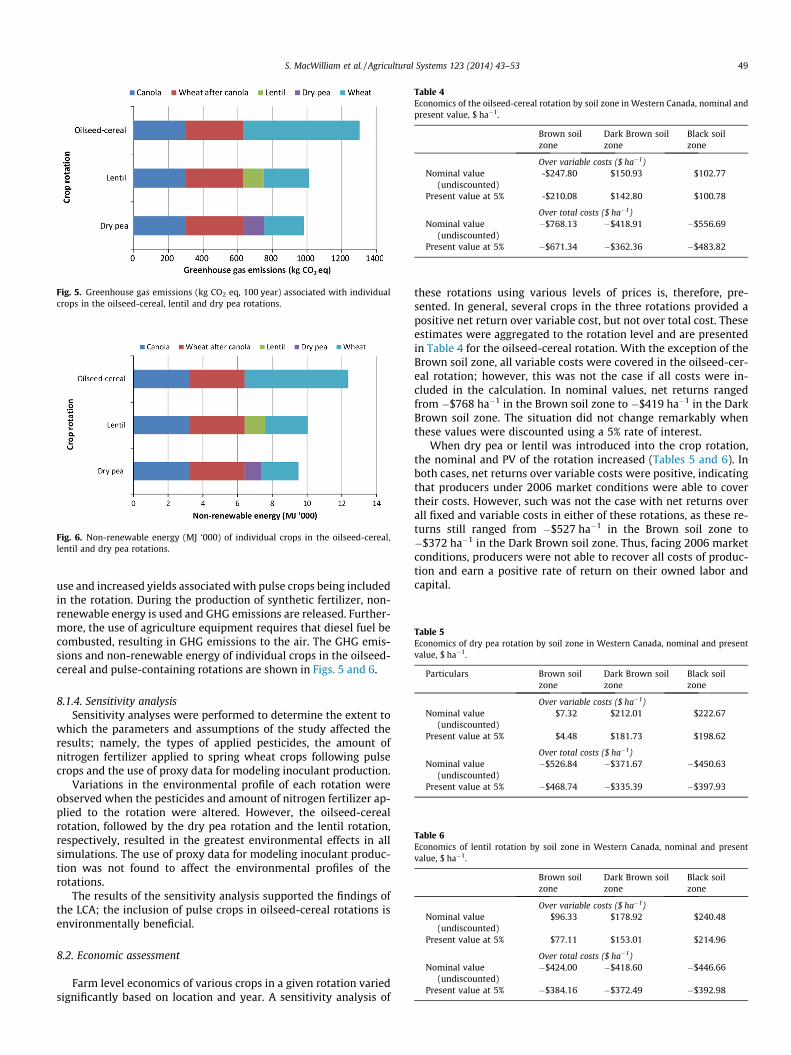
Fig. 5. Greenhouse gas emissions (kg CO2 eq, 100 year) associated with individualcrops in the oilseed-cereal, lentil and dry pea rotations.
Fig. 6. Non-renewable energy (MJ ‘000) of individual crops in the oilseed-cereal,lentil and dry pea rotations.
Table 4Economics of the oilseed-cereal rotation by soil zone in Western Canada, nominal andpresent value, $ ha�1.
Brown soilzone
Dark Brown soilzone
Black soilzone
Over variable costs ($ ha�1)Nominal value
(undiscounted)-$247.80 $150.93 $102.77
Present value at 5% -$210.08 $142.80 $100.78
Over total costs ($ ha�1)Nominal value
(undiscounted)�$768.13 �$418.91 �$556.69
Present value at 5% �$671.34 �$362.36 �$483.82
Table 5Economics of dry pea rotation by soil zone in Western Canada, nominal and presentvalue, $ ha�1.
Particulars Brown soilzone
Dark Brown soilzone
Black soilzone
Over variable costs ($ ha�1)Nominal value
(undiscounted)$7.32 $212.01 $222.67
Present value at 5% $4.48 $181.73 $198.62
Over total costs ($ ha�1)Nominal value
(undiscounted)�$526.84 �$371.67 �$450.63
Present value at 5% �$468.74 �$335.39 �$397.93
Table 6Economics of lentil rotation by soil zone in Western Canada, nominal and presentvalue, $ ha�1.
Brown soilzone
Dark Brown soilzone
Black soilzone
Over variable costs ($ ha�1)Nominal value
(undiscounted)$96.33 $178.92 $240.48
Present value at 5% $77.11 $153.01 $214.96
Over total costs ($ ha�1)Nominal value
(undiscounted)�$424.00 �$418.60 �$446.66
Present value at 5% �$384.16 �$372.49 �$392.98
S. MacWilliam et al. / Agricultural Systems 123 (2014) 43–53 49
use and increased yields associated with pulse crops being includedin the rotation. During the production of synthetic fertilizer, non-renewable energy is used and GHG emissions are released. Further-more, the use of agriculture equipment requires that diesel fuel becombusted, resulting in GHG emissions to the air. The GHG emis-sions and non-renewable energy of individual crops in the oilseed-cereal and pulse-containing rotations are shown in Figs. 5 and 6.
8.1.4. Sensitivity analysisSensitivity analyses were performed to determine the extent to
which the parameters and assumptions of the study affected theresults; namely, the types of applied pesticides, the amount ofnitrogen fertilizer applied to spring wheat crops following pulsecrops and the use of proxy data for modeling inoculant production.
Variations in the environmental profile of each rotation wereobserved when the pesticides and amount of nitrogen fertilizer ap-plied to the rotation were altered. However, the oilseed-cerealrotation, followed by the dry pea rotation and the lentil rotation,respectively, resulted in the greatest environmental effects in allsimulations. The use of proxy data for modeling inoculant produc-tion was not found to affect the environmental profiles of therotations.
The results of the sensitivity analysis supported the findings ofthe LCA; the inclusion of pulse crops in oilseed-cereal rotations isenvironmentally beneficial.
8.2. Economic assessment
Farm level economics of various crops in a given rotation variedsignificantly based on location and year. A sensitivity analysis of
these rotations using various levels of prices is, therefore, pre-sented. In general, several crops in the three rotations provided apositive net return over variable cost, but not over total cost. Theseestimates were aggregated to the rotation level and are presentedin Table 4 for the oilseed-cereal rotation. With the exception of theBrown soil zone, all variable costs were covered in the oilseed-cer-eal rotation; however, this was not the case if all costs were in-cluded in the calculation. In nominal values, net returns rangedfrom �$768 ha�1 in the Brown soil zone to �$419 ha�1 in the DarkBrown soil zone. The situation did not change remarkably whenthese values were discounted using a 5% rate of interest.
When dry pea or lentil was introduced into the crop rotation,the nominal and PV of the rotation increased (Tables 5 and 6). Inboth cases, net returns over variable costs were positive, indicatingthat producers under 2006 market conditions were able to covertheir costs. However, such was not the case with net returns overall fixed and variable costs in either of these rotations, as these re-turns still ranged from �$527 ha�1 in the Brown soil zone to�$372 ha�1 in the Dark Brown soil zone. Thus, facing 2006 marketconditions, producers were not able to recover all costs of produc-tion and earn a positive rate of return on their owned labor andcapital.
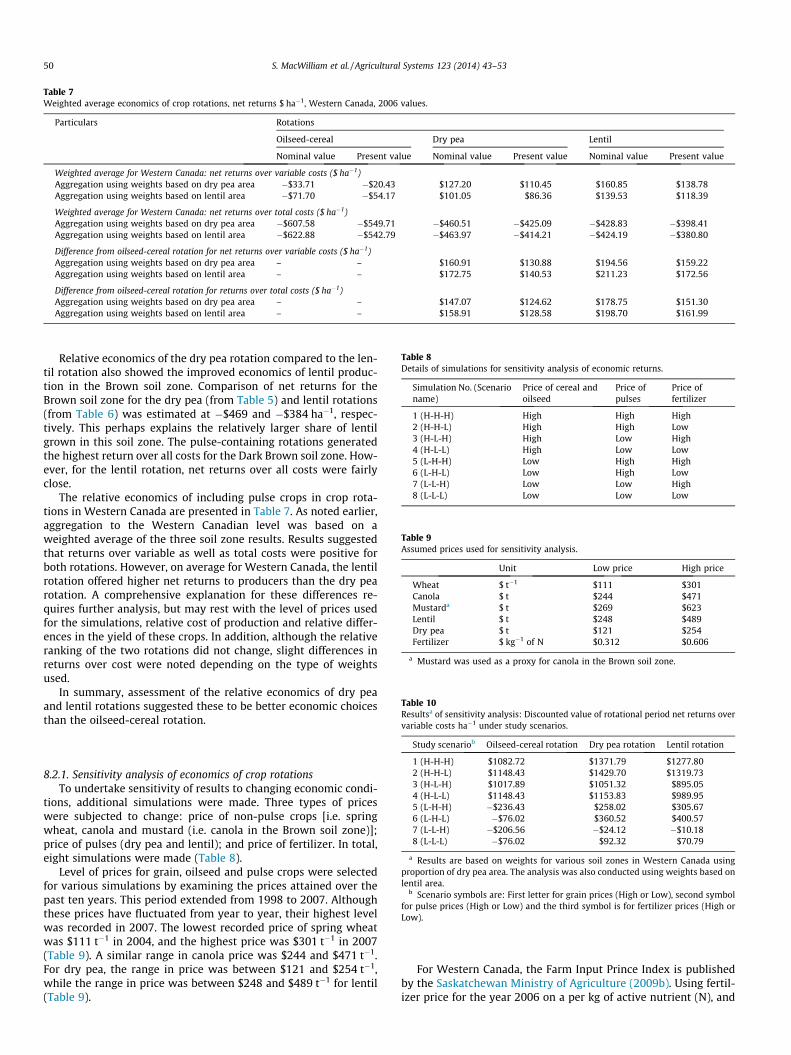
Table 7Weighted average economics of crop rotations, net returns $ ha�1, Western Canada, 2006 values.
Particulars Rotations
Oilseed-cereal Dry pea Lentil
Nominal value Present value Nominal value Present value Nominal value Present value
Weighted average for Western Canada: net returns over variable costs ($ ha�1)Aggregation using weights based on dry pea area �$33.71 �$20.43 $127.20 $110.45 $160.85 $138.78Aggregation using weights based on lentil area �$71.70 �$54.17 $101.05 $86.36 $139.53 $118.39
Weighted average for Western Canada: net returns over total costs ($ ha�1)Aggregation using weights based on dry pea area �$607.58 �$549.71 �$460.51 �$425.09 �$428.83 �$398.41Aggregation using weights based on lentil area �$622.88 �$542.79 �$463.97 �$414.21 �$424.19 �$380.80
Difference from oilseed-cereal rotation for net returns over variable costs ($ ha�1)Aggregation using weights based on dry pea area – – $160.91 $130.88 $194.56 $159.22Aggregation using weights based on lentil area – – $172.75 $140.53 $211.23 $172.56
Difference from oilseed-cereal rotation for returns over total costs ($ ha�1)Aggregation using weights based on dry pea area – – $147.07 $124.62 $178.75 $151.30Aggregation using weights based on lentil area – – $158.91 $128.58 $198.70 $161.99
Table 8Details of simulations for sensitivity analysis of economic returns.
Simulation No. (Scenarioname)
Price of cereal andoilseed
Price ofpulses
Price offertilizer
1 (H-H-H) High High High2 (H-H-L) High High Low3 (H-L-H) High Low High4 (H-L-L) High Low Low5 (L-H-H) Low High High6 (L-H-L) Low High Low7 (L-L-H) Low Low High8 (L-L-L) Low Low Low
Table 9Assumed prices used for sensitivity analysis.
Unit Low price High price
Wheat $ t�1 $111 $301Canola $ t $244 $471Mustarda $ t $269 $623Lentil $ t $248 $489Dry pea $ t $121 $254Fertilizer $ kg�1 of N $0.312 $0.606
a Mustard was used as a proxy for canola in the Brown soil zone.
Table 10Resultsa of sensitivity analysis: Discounted value of rotational period net returns overvariable costs ha�1 under study scenarios.
50 S. MacWilliam et al. / Agricultural Systems 123 (2014) 43–53
Relative economics of the dry pea rotation compared to the len-til rotation also showed the improved economics of lentil produc-tion in the Brown soil zone. Comparison of net returns for theBrown soil zone for the dry pea (from Table 5) and lentil rotations(from Table 6) was estimated at �$469 and �$384 ha�1, respec-tively. This perhaps explains the relatively larger share of lentilgrown in this soil zone. The pulse-containing rotations generatedthe highest return over all costs for the Dark Brown soil zone. How-ever, for the lentil rotation, net returns over all costs were fairlyclose.
The relative economics of including pulse crops in crop rota-tions in Western Canada are presented in Table 7. As noted earlier,aggregation to the Western Canadian level was based on aweighted average of the three soil zone results. Results suggestedthat returns over variable as well as total costs were positive forboth rotations. However, on average for Western Canada, the lentilrotation offered higher net returns to producers than the dry pearotation. A comprehensive explanation for these differences re-quires further analysis, but may rest with the level of prices usedfor the simulations, relative cost of production and relative differ-ences in the yield of these crops. In addition, although the relativeranking of the two rotations did not change, slight differences inreturns over cost were noted depending on the type of weightsused.
In summary, assessment of the relative economics of dry peaand lentil rotations suggested these to be better economic choicesthan the oilseed-cereal rotation.
Study scenariob Oilseed-cereal rotation Dry pea rotation Lentil rotation
1 (H-H-H) $1082.72 $1371.79 $1277.802 (H-H-L) $1148.43 $1429.70 $1319.733 (H-L-H) $1017.89 $1051.32 $895.054 (H-L-L) $1148.43 $1153.83 $989.955 (L-H-H) �$236.43 $258.02 $305.676 (L-H-L) �$76.02 $360.52 $400.577 (L-L-H) �$206.56 �$24.12 �$10.188 (L-L-L) �$76.02 $92.32 $70.79
a Results are based on weights for various soil zones in Western Canada usingproportion of dry pea area. The analysis was also conducted using weights based onlentil area.
b Scenario symbols are: First letter for grain prices (High or Low), second symbolfor pulse prices (High or Low) and the third symbol is for fertilizer prices (High orLow).
8.2.1. Sensitivity analysis of economics of crop rotationsTo undertake sensitivity of results to changing economic condi-
tions, additional simulations were made. Three types of priceswere subjected to change: price of non-pulse crops [i.e. springwheat, canola and mustard (i.e. canola in the Brown soil zone)];price of pulses (dry pea and lentil); and price of fertilizer. In total,eight simulations were made (Table 8).
Level of prices for grain, oilseed and pulse crops were selectedfor various simulations by examining the prices attained over thepast ten years. This period extended from 1998 to 2007. Althoughthese prices have fluctuated from year to year, their highest levelwas recorded in 2007. The lowest recorded price of spring wheatwas $111 t�1 in 2004, and the highest price was $301 t�1 in 2007(Table 9). A similar range in canola price was $244 and $471 t�1.For dry pea, the range in price was between $121 and $254 t�1,while the range in price was between $248 and $489 t�1 for lentil(Table 9).
For Western Canada, the Farm Input Prince Index is publishedby the Saskatchewan Ministry of Agriculture (2009b). Using fertil-izer price for the year 2006 on a per kg of active nutrient (N), and
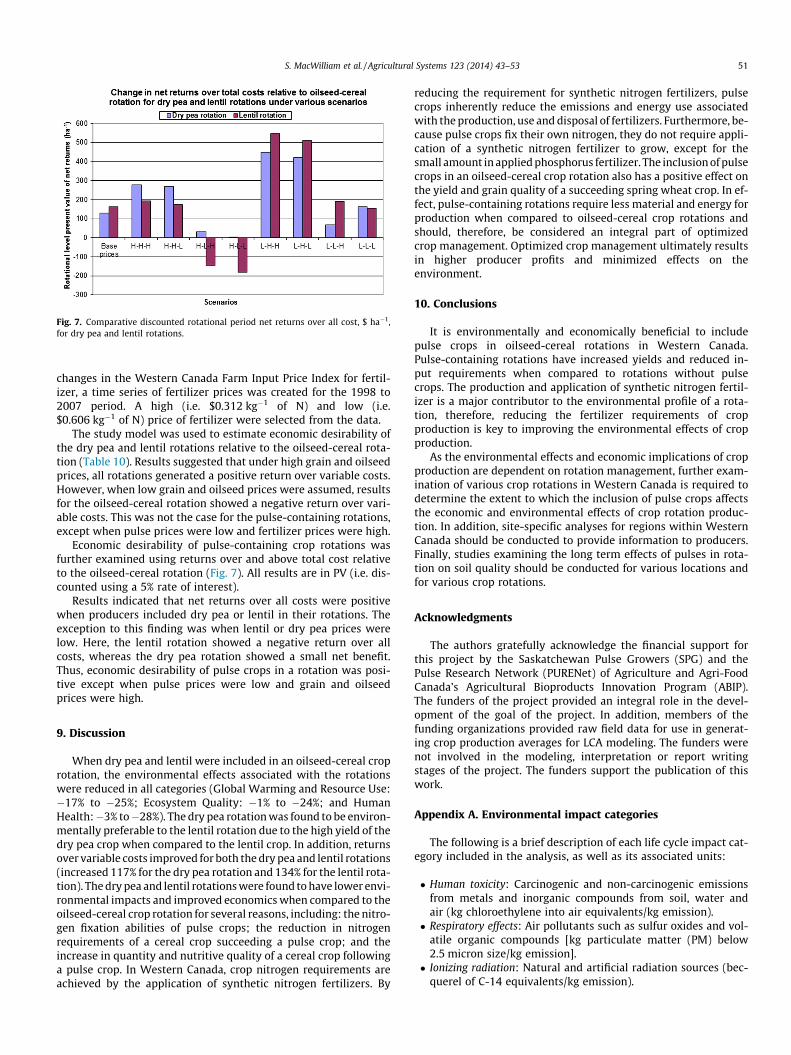
Fig. 7. Comparative discounted rotational period net returns over all cost, $ ha�1,for dry pea and lentil rotations.
S. MacWilliam et al. / Agricultural Systems 123 (2014) 43–53 51
changes in the Western Canada Farm Input Price Index for fertil-izer, a time series of fertilizer prices was created for the 1998 to2007 period. A high (i.e. $0.312 kg�1 of N) and low (i.e.$0.606 kg�1 of N) price of fertilizer were selected from the data.
The study model was used to estimate economic desirability ofthe dry pea and lentil rotations relative to the oilseed-cereal rota-tion (Table 10). Results suggested that under high grain and oilseedprices, all rotations generated a positive return over variable costs.However, when low grain and oilseed prices were assumed, resultsfor the oilseed-cereal rotation showed a negative return over vari-able costs. This was not the case for the pulse-containing rotations,except when pulse prices were low and fertilizer prices were high.
Economic desirability of pulse-containing crop rotations wasfurther examined using returns over and above total cost relativeto the oilseed-cereal rotation (Fig. 7). All results are in PV (i.e. dis-counted using a 5% rate of interest).
Results indicated that net returns over all costs were positivewhen producers included dry pea or lentil in their rotations. Theexception to this finding was when lentil or dry pea prices werelow. Here, the lentil rotation showed a negative return over allcosts, whereas the dry pea rotation showed a small net benefit.Thus, economic desirability of pulse crops in a rotation was posi-tive except when pulse prices were low and grain and oilseedprices were high.
9. Discussion
When dry pea and lentil were included in an oilseed-cereal croprotation, the environmental effects associated with the rotationswere reduced in all categories (Global Warming and Resource Use:�17% to �25%; Ecosystem Quality: �1% to �24%; and HumanHealth:�3% to�28%). The dry pea rotation was found to be environ-mentally preferable to the lentil rotation due to the high yield of thedry pea crop when compared to the lentil crop. In addition, returnsover variable costs improved for both the dry pea and lentil rotations(increased 117% for the dry pea rotation and 134% for the lentil rota-tion). The dry pea and lentil rotations were found to have lower envi-ronmental impacts and improved economics when compared to theoilseed-cereal crop rotation for several reasons, including: the nitro-gen fixation abilities of pulse crops; the reduction in nitrogenrequirements of a cereal crop succeeding a pulse crop; and theincrease in quantity and nutritive quality of a cereal crop followinga pulse crop. In Western Canada, crop nitrogen requirements areachieved by the application of synthetic nitrogen fertilizers. By
reducing the requirement for synthetic nitrogen fertilizers, pulsecrops inherently reduce the emissions and energy use associatedwith the production, use and disposal of fertilizers. Furthermore, be-cause pulse crops fix their own nitrogen, they do not require appli-cation of a synthetic nitrogen fertilizer to grow, except for thesmall amount in applied phosphorus fertilizer. The inclusion of pulsecrops in an oilseed-cereal crop rotation also has a positive effect onthe yield and grain quality of a succeeding spring wheat crop. In ef-fect, pulse-containing rotations require less material and energy forproduction when compared to oilseed-cereal crop rotations andshould, therefore, be considered an integral part of optimizedcrop management. Optimized crop management ultimately resultsin higher producer profits and minimized effects on theenvironment.
10. Conclusions
It is environmentally and economically beneficial to includepulse crops in oilseed-cereal rotations in Western Canada.Pulse-containing rotations have increased yields and reduced in-put requirements when compared to rotations without pulsecrops. The production and application of synthetic nitrogen fertil-izer is a major contributor to the environmental profile of a rota-tion, therefore, reducing the fertilizer requirements of cropproduction is key to improving the environmental effects of cropproduction.
As the environmental effects and economic implications of cropproduction are dependent on rotation management, further exam-ination of various crop rotations in Western Canada is required todetermine the extent to which the inclusion of pulse crops affectsthe economic and environmental effects of crop rotation produc-tion. In addition, site-specific analyses for regions within WesternCanada should be conducted to provide information to producers.Finally, studies examining the long term effects of pulses in rota-tion on soil quality should be conducted for various locations andfor various crop rotations.
Acknowledgments
The authors gratefully acknowledge the financial support forthis project by the Saskatchewan Pulse Growers (SPG) and thePulse Research Network (PURENet) of Agriculture and Agri-FoodCanada’s Agricultural Bioproducts Innovation Program (ABIP).The funders of the project provided an integral role in the devel-opment of the goal of the project. In addition, members of thefunding organizations provided raw field data for use in generat-ing crop production averages for LCA modeling. The funders werenot involved in the modeling, interpretation or report writingstages of the project. The funders support the publication of thiswork.
Appendix A. Environmental impact categories
The following is a brief description of each life cycle impact cat-egory included in the analysis, as well as its associated units:
� Human toxicity: Carcinogenic and non-carcinogenic emissionsfrom metals and inorganic compounds from soil, water andair (kg chloroethylene into air equivalents/kg emission).� Respiratory effects: Air pollutants such as sulfur oxides and vol-
atile organic compounds [kg particulate matter (PM) below2.5 micron size/kg emission].� Ionizing radiation: Natural and artificial radiation sources (bec-
querel of C-14 equivalents/kg emission).
52 S. MacWilliam et al. / Agricultural Systems 123 (2014) 43–53
� Ozone layer depletion: Several ozone depleting gases, such aschlorofluorocarbons (CFCs) and halogenated compounds (kgCFC-11 equivalents/kg emission).� Photochemical oxidation: Includes smog-forming particles, such
as olefins and hydrocarbons (kg ethylene into air/kg emission).� Aquatic ecotoxicity: Emissions to water sources, such as surface
water, lakes and rivers [kg triethylene glycol (TEG) equivalentsinto water/kg of emission].� Terrestrial ecotoxicity: Emissions to soil, such as metals, hydro-
carbons and pesticides (kg TEG equivalents into water/kg ofemission).� Aquatic acidification: Potential proton release of substances such
as nitrogen oxides and ammonia (kg sulfur dioxide (SO2) equiv-alents into air/kg emission).� Aquatic eutrophication: Chemical nutrient contribution to bodies
of water from such sources such as nitrogen oxides and phos-phates (kg phosphate (PO3�
4 ) into water/kg of emission).� Terrestrial acidification and nutrification: Proton release and/or
chemical nutrient release to soil (kg SO2 equivalents into air/kg emission).
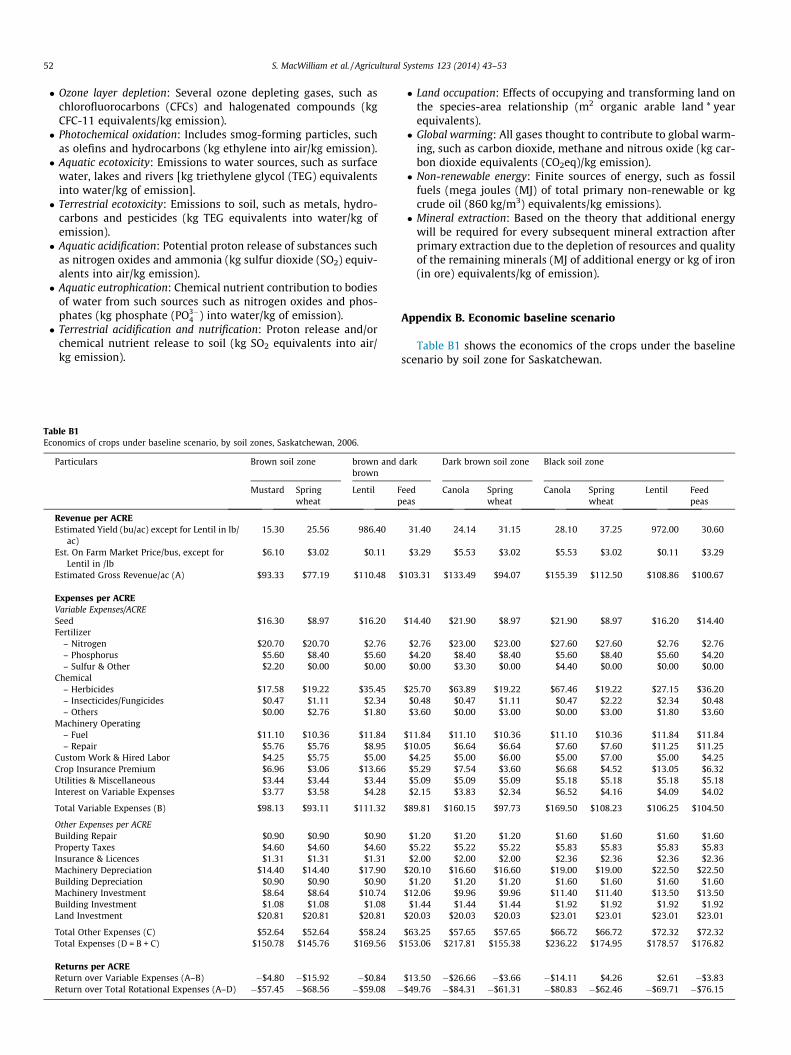
Table B1Economics of crops under baseline scenario, by soil zones, Saskatchewan, 2006.
Particulars Brown soil zone brown andbrown
Mustard Springwheat
Lentil Fp
Revenue per ACREEstimated Yield (bu/ac) except for Lentil in lb/
ac)15.30 25.56 986.40
Est. On Farm Market Price/bus, except forLentil in /lb
$6.10 $3.02 $0.11
Estimated Gross Revenue/ac (A) $93.33 $77.19 $110.48
Expenses per ACREVariable Expenses/ACRESeed $16.30 $8.97 $16.20Fertilizer
– Nitrogen $20.70 $20.70 $2.76– Phosphorus $5.60 $8.40 $5.60– Sulfur & Other $2.20 $0.00 $0.00
Chemical– Herbicides $17.58 $19.22 $35.45– Insecticides/Fungicides $0.47 $1.11 $2.34– Others $0.00 $2.76 $1.80
Machinery Operating– Fuel $11.10 $10.36 $11.84– Repair $5.76 $5.76 $8.95
Custom Work & Hired Labor $4.25 $5.75 $5.00Crop Insurance Premium $6.96 $3.06 $13.66Utilities & Miscellaneous $3.44 $3.44 $3.44Interest on Variable Expenses $3.77 $3.58 $4.28
Total Variable Expenses (B) $98.13 $93.11 $111.32
Other Expenses per ACREBuilding Repair $0.90 $0.90 $0.90Property Taxes $4.60 $4.60 $4.60Insurance & Licences $1.31 $1.31 $1.31Machinery Depreciation $14.40 $14.40 $17.90Building Depreciation $0.90 $0.90 $0.90Machinery Investment $8.64 $8.64 $10.74Building Investment $1.08 $1.08 $1.08Land Investment $20.81 $20.81 $20.81
Total Other Expenses (C) $52.64 $52.64 $58.24Total Expenses (D = B + C) $150.78 $145.76 $169.56
Returns per ACREReturn over Variable Expenses (A–B) �$4.80 �$15.92 �$0.84Return over Total Rotational Expenses (A–D) �$57.45 �$68.56 �$59.08 �
� Land occupation: Effects of occupying and transforming land onthe species-area relationship (m2 organic arable land * yearequivalents).� Global warming: All gases thought to contribute to global warm-
ing, such as carbon dioxide, methane and nitrous oxide (kg car-bon dioxide equivalents (CO2eq)/kg emission).� Non-renewable energy: Finite sources of energy, such as fossil
fuels (mega joules (MJ) of total primary non-renewable or kgcrude oil (860 kg/m3) equivalents/kg emissions).� Mineral extraction: Based on the theory that additional energy
will be required for every subsequent mineral extraction afterprimary extraction due to the depletion of resources and qualityof the remaining minerals (MJ of additional energy or kg of iron(in ore) equivalents/kg of emission).
Appendix B. Economic baseline scenario
Table B1 shows the economics of the crops under the baselinescenario by soil zone for Saskatchewan.
dark Dark brown soil zone Black soil zone
eedeas
Canola Springwheat
Canola Springwheat
Lentil Feedpeas
31.40 24.14 31.15 28.10 37.25 972.00 30.60
$3.29 $5.53 $3.02 $5.53 $3.02 $0.11 $3.29
$103.31 $133.49 $94.07 $155.39 $112.50 $108.86 $100.67
$14.40 $21.90 $8.97 $21.90 $8.97 $16.20 $14.40
$2.76 $23.00 $23.00 $27.60 $27.60 $2.76 $2.76$4.20 $8.40 $8.40 $5.60 $8.40 $5.60 $4.20$0.00 $3.30 $0.00 $4.40 $0.00 $0.00 $0.00
$25.70 $63.89 $19.22 $67.46 $19.22 $27.15 $36.20$0.48 $0.47 $1.11 $0.47 $2.22 $2.34 $0.48$3.60 $0.00 $3.00 $0.00 $3.00 $1.80 $3.60
$11.84 $11.10 $10.36 $11.10 $10.36 $11.84 $11.84$10.05 $6.64 $6.64 $7.60 $7.60 $11.25 $11.25
$4.25 $5.00 $6.00 $5.00 $7.00 $5.00 $4.25$5.29 $7.54 $3.60 $6.68 $4.52 $13.05 $6.32$5.09 $5.09 $5.09 $5.18 $5.18 $5.18 $5.18$2.15 $3.83 $2.34 $6.52 $4.16 $4.09 $4.02
$89.81 $160.15 $97.73 $169.50 $108.23 $106.25 $104.50
$1.20 $1.20 $1.20 $1.60 $1.60 $1.60 $1.60$5.22 $5.22 $5.22 $5.83 $5.83 $5.83 $5.83$2.00 $2.00 $2.00 $2.36 $2.36 $2.36 $2.36
$20.10 $16.60 $16.60 $19.00 $19.00 $22.50 $22.50$1.20 $1.20 $1.20 $1.60 $1.60 $1.60 $1.60
$12.06 $9.96 $9.96 $11.40 $11.40 $13.50 $13.50$1.44 $1.44 $1.44 $1.92 $1.92 $1.92 $1.92
$20.03 $20.03 $20.03 $23.01 $23.01 $23.01 $23.01
$63.25 $57.65 $57.65 $66.72 $66.72 $72.32 $72.32$153.06 $217.81 $155.38 $236.22 $174.95 $178.57 $176.82
$13.50 �$26.66 �$3.66 �$14.11 $4.26 $2.61 �$3.83$49.76 �$84.31 �$61.31 �$80.83 �$62.46 �$69.71 �$76.15
S. MacWilliam et al. / Agricultural Systems 123 (2014) 43–53 53
References
Bailey, K.L., Gossen, B.D., Derksen, D.A., Watson, P.R., 2000. Impact of agronomicpractices and environment on diseases of wheat and lentil in southeasternSaskatchewan. Can. J. Plant Sci. 80, 917–927.
Campbell, C.A., Zentner, R.P., Selles, F., Jefferson, P.G., McConkey, B., Lemke, R.,Blomert, B., 2005. Long-term effect of cropping system and nitrogen andphosphorus fertilizer on production and nitrogen economy of grain crops in aBrown Chernozem. Can. J. Plant Sci. 85, 81–93.
Carlyle, W.J., 1997. The decline of summerfallow on the Canadian Prairies. Can.Geogr. 41, 267–280.
Edwards, N.M., Fu, B.X., Hatcher, D.W., 2009. Quality of Western Canadian wheat.Canadian Grain Commission. <http://publications.gc.ca/collections/collection_2012/ccg-cgc/A92-23-2009-eng.pdf> (accessed 2009).
Environment Canada, 2008. National Inventory Report 1990–2006 – GreenhouseGas Sources and Sinks in Canada. The Canadian Government’s Submissions tothe UN Framework Convention on Climate Change.
Fernandez, M.R., Zentner, R.P., 2005. The impact of crop rotation and N fertilizer oncommon root rot of spring wheat in the Brown soil zone in western Canada.Can. J. Plant Sci. 85, 569–575.
Foy, C.L., Pritchard, D.W., 1996. Pesticide Formulation and Adjuvant Technology.CRC Press LLC.
Frischknecht, R., Jungbluth, N., Althaus, H.J., Doka, G., Heck, T., Hellweg, S., Hischier,R., Nemecek, T., Rebitzer, G., Spielmann, M., Wernet, G., 2007. Overview andMethodology. Ecoinvent Report No. 1. Dübendorf, Swiss Centre for Life CycleInventories.
Gan, Y., Miller, P.R., McConkey, B., Zentner, R.P., Liu, P.H., McDonald, C.L., 2003.Optimum plant population density for chickpea and dry pea in a semiaridenvironment. Can. J. Plant Sci. 8, 31–39.
Grant, C.A., Peterson, G.A., Campbell, C.A., 2002. Nutrient considerations indiversified cropping systems in the northern great plains. Agron. J. 94,186–198.
[IPCC] Intergovernmental Panel on Climate Change, 2006. Chapter 11: N2OEmissions from Managed Soils, and CO2 Emissions from Lime and UreaApplication. 2006 IPCC Guidelines for National Greenhouse Gas Inventories.Intergovernmental Panel on Climate Change National Greenhouse GasInventories Programme, 11.1-11.35.
[IPCC] Intergovernmental Panel on Climate Change, 2007. Chapter 2: Changes inAtmospheric Constituents and in Radiative Forcing. Working Group I Report‘‘The Physical Science Basis’’. IPCC Fourth Assessment Report.
[ISO] International Organization for Standardization 14040, 2006a. EnvironmentalManagement – Life cycle Assessment – Principles and Framework.
[ISO] International Organization for Standardization 14044, 2006b. EnvironmentalManagement – Life Cycle Assessment – Requirements and Guidelines.
Janzen, H.H., Beauchemin, K.A., Bruinsma, Y., Campbell, C.A., Desjardins, R., Ellert,B.H., Smith, E.G., 2003. The fate of nitrogen in agroecosystems: an illustrationusing Canadian estimates. Nutr. Cycl. Agroecosys. 67, 85–102.
Jolliet, O., Margni, M., Charles, R., Humbert, S., Payet, J., Rebitzer, G., Rosenbaum, R.,2003. IMPACT 2002+: a new life cycle impact assessment methodology. Int. J.LCA 83, 324–330.
Kutcher, H.R., Malhi, S.S., Gill, K.S., 2005. Topography and management of nitrogenand fungicide affects diseases and productivity of canola. Agron. J. 97, 533–541.
Lemke, R., 2008. Research Scientist, Agriculture and Agri-Food Canada, Saskatoon,Saskatchewan. Personal Communications.
Marshall, I.B., Schut, P.H., Ballard, M., 1999. A National Ecological Framework forCanada: Attribute Data. Agriculture and Agri-Food Canada, Research Branch,Centre for Land and Biological Resources Research, and Environment Canada,State of the Environment Directorate, Ecozone Analysis Branch, Ottawa/Hull.<http://sis.agr.gc.ca/cansis/nsdb/ecostrat/1999report/intro.html> (accessed2008).
Matus, A., Derksen, D.A., Walley, F., Loeppky, H.A., van Kessel, C., 1997. The influenceof tillage and crop rotation on nitrogen fixation in lentil and pea. Can. J. PlantSci. 77, 197–200.
McVicar, R., Panchuk, K., Pearse, P., 2007. Inoculation of Pulse Crops. Soils, Fertilityand Nutrients. <http://www.agriculture.gov.sk.ca/Inoculation_Pulse_Crops>(accessed 2009).
Miller, P.R., McDonald, C.L., Derksen, D.A., Waddington, J., 2001. The adaptation ofseven broadleaf crops to the dry semiarid prairie. Can. J. Plant Sci. 81, 29–43.
Mohr, R.M., Derksen, D.A., Grant, C.A., McLaren, D.L., Monreal, M.A., Moulin, A.P.,Khakbazan, M., Irvine, R.B., 2007. Effect of nitrogen fertilizer rate, herbicide rate,and soil disturbance at seeding on the productivity of a wheat-pea rotation. Can.J. Plant Sci. 87, 241–253.
Nagy, C., 2001. Agriculture Energy Use of Adaptation Options to Climate Change. Areport to the Prairie Adaptation Research Collaborative (PARC).
Nemecek, T., Kägi, T., 2007. Life Cycle Inventories of Agricultural ProductionSystems. Zürich and Dübendorf, Agroscope Reckenholz-Täenikon ResearchStation ART, 360.
[NREL] National Renewable Energy Laboratory, 2003. U.S. Life-Cycle InventoryDatabase.
PRé, 2009. SimaPro 7 – Product Ecology Consultants. <http://www.pre.nl/simapro/simapro_lca_software.htm> (accessed 2009).
Rochette, P., Worth, D.E., Lemke, R., McConkey, B., Pennock, D.J., Wagner-Riddle, C.,Desjardins, R., 2008. Estimation of N2O emissions from agricultural soils in Canada.I. Development of a country specific methodology. Can. J. Soil Sci. 88, 641–645.
Saskatchewan Ministry of Agriculture, 2006. Crop Planning Guide 2006.Saskatchewan Ministry of Agriculture, 2009a. 2008 Specialty Crop Report. Regina,
Saskatchewan.Saskatchewan Ministry of Agriculture, 2009b. Agriculture Statistics.
<www.agriculture.gov.sk.ca/agricultural_statistics> (accessed 2009).Saskatchewan Ministry of Agriculture, 2009c. 2009 Guide to Crop Protection.
Saskatchewan weeds, plant diseases, insects. Regina, Saskatchewan,Saskatchewan Ministry of Agriculture.
Soon, Y.K., Klein-Gebbinck, H.W., Arshad, M.A., 2005. Residue Management andCrop Sequence Effects on the Yield and Brown Girdlign Root Rot of Canola. Can.J. Plant Sci. 85, 67–72.
[SPG] Saskatchewan Pulse Growers, 2000. General Production. Pulse ProductionManual 2000.
Spratt, E.D., Strain, J.H., Gorby, B.J., 1975. Summer fallow substitutes for westernCanada. Can. J. Plant Sci. 55, 477–484.
Statistics Canada, 2006. Field Crop Reporting Series, Chronological Index (accessed2007).
Statistics Canada, 2007. Area under Crops. <www.statcan.gc.ca/pub/95-629-X/>(accessed 2009).
Tanaka, D.L., Lyon, D.J., Miller, P.R., Merrill, S.D., McConkey, B.G., 2010. Soil andwater conservation advances in the semiarid northern Great Plains. Soil Sci. Soc.Am. J. SP 60, 81–102.
Whitney, E., Rolfes, S.R., 2005. Understanding Nutrition. Belmont, California,Wadsworth.