Embed Size (px)
DESCRIPTION
S0889974608000753
Citation preview
ARTICLE IN PRESS
0889-9746/$ - se
doi:10.1016/j.jfl
�CorrespondE-mail addr
1Now with T2Now with G
Journal of Fluids and Structures 25 (2009) 229–244
www.elsevier.com/locate/jfs
A numerical investigation of the near-wake structure in thevariable frequency forced oscillation of a circular cylinder
S. Atluri1, V.K. Rao2, C. Dalton�
Department of Mechanical Engineering, University of Houston, Houston, Texas 77204-4006, USA
Received 29 March 2007; accepted 4 June 2008
Available online 15 October 2008
Abstract
The near-wake structure of a uniform flow past a circular cylinder undergoing a constant-amplitude transverse forced
oscillation is studied numerically using a 2-D large eddy simulation (LES) calculation with a Reynolds number range
from 500 to 8000. Two effects are considered: First, a comparison is made between the wake structures of periodic and
nonperiodic forced oscillations of the cylinder. This was done to emphasize the importance of wake-structure
differences of a periodic forced oscillation and a self-excited oscillation of a circular cylinder with the latter being
characterized as a nonperiodic forced oscillation. The nonperiodic constant-amplitude forced oscillations were obtained
by modulating the frequency of the periodically oscillating cylinder. The differences in the vortex-shedding behavior
were made evident by analyzing the vorticity field in the entire wake domain. Second, the effect of changes in the
moderate values of the Reynolds number for constant and variable frequency oscillation was investigated. Significant
effects on the vortex-shedding patterns in the near wake were observed for both aspects of this study.
r 2009 Elsevier Ltd. All rights reserved.
Keywords: Computational Fluid Dynamics; Vortex-induced vibration; Forced oscillations; Wake mode response; Variable frequency;
Variable Reynolds number; Large eddy simulation
1. Introduction
1.1. Forced oscillation of a circular cylinder
Any motion of a cylinder in a steady approach flow clearly affects the flow field in the wake of the cylinder. The
cylinder motion can be in-line with the approach flow direction, transverse to the approach flow direction, or in some
combination of the two. The motion of the cylinder can occur from either a forced or free oscillation. The latter type of
oscillation is commonly referred to as vortex-induced vibration (VIV). Early studies of VIV were oriented toward
studying the effects of the controlled motion of the cylinder on its wake pattern. Several early experiments were
conducted on this controlled motion by forcibly oscillating the cylinder at constant amplitude and constant frequency in
e front matter r 2009 Elsevier Ltd. All rights reserved.
uidstructs.2008.06.012
ing author.
ess: [email protected] (C. Dalton).
echnip, Houston, TX, USA.
ranheme, KBR, Houston, TX, USA.
ARTICLE IN PRESSS. Atluri et al. / Journal of Fluids and Structures 25 (2009) 229–244230
the transverse direction. The force on the cylinder due to the fluid flow can be determined by subtracting the inertia
force of the cylinder from the force required to oscillate the cylinder.
Bishop and Hassan (1964) investigated experimentally the forces exerted on a cylinder in a forced oscillation over a
wide range of frequencies and oscillation amplitudes. Their experiments showed that there was an increase in the
magnitude of mean drag and lift amplitude when the excitation frequency approaches the natural shedding frequency of
the cylinder. There was an abrupt change in the phase angle between the lift force and the cylinder displacement near
this shedding frequency.
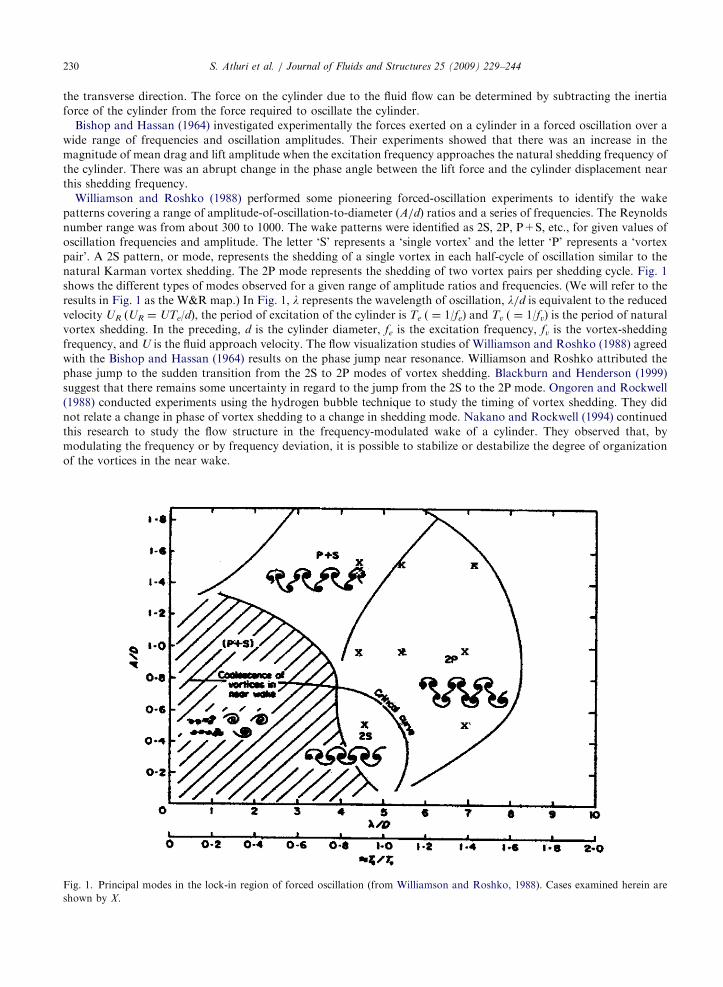
Williamson and Roshko (1988) performed some pioneering forced-oscillation experiments to identify the wake
patterns covering a range of amplitude-of-oscillation-to-diameter (A/d) ratios and a series of frequencies. The Reynolds
number range was from about 300 to 1000. The wake patterns were identified as 2S, 2P, P+S, etc., for given values of
oscillation frequencies and amplitude. The letter ‘S’ represents a ‘single vortex’ and the letter ‘P’ represents a ‘vortex
pair’. A 2S pattern, or mode, represents the shedding of a single vortex in each half-cycle of oscillation similar to the
natural Karman vortex shedding. The 2P mode represents the shedding of two vortex pairs per shedding cycle. Fig. 1
shows the different types of modes observed for a given range of amplitude ratios and frequencies. (We will refer to the
results in Fig. 1 as the W&R map.) In Fig. 1, l represents the wavelength of oscillation, l/d is equivalent to the reduced
velocity UR (UR ¼ UTe/d), the period of excitation of the cylinder is Te ( ¼ 1/fe) and Tv ( ¼ 1/fv) is the period of natural
vortex shedding. In the preceding, d is the cylinder diameter, fe is the excitation frequency, fv is the vortex-shedding
frequency, and U is the fluid approach velocity. The flow visualization studies of Williamson and Roshko (1988) agreed
with the Bishop and Hassan (1964) results on the phase jump near resonance. Williamson and Roshko attributed the
phase jump to the sudden transition from the 2S to 2P modes of vortex shedding. Blackburn and Henderson (1999)
suggest that there remains some uncertainty in regard to the jump from the 2S to the 2P mode. Ongoren and Rockwell
(1988) conducted experiments using the hydrogen bubble technique to study the timing of vortex shedding. They did
not relate a change in phase of vortex shedding to a change in shedding mode. Nakano and Rockwell (1994) continued
this research to study the flow structure in the frequency-modulated wake of a cylinder. They observed that, by
modulating the frequency or by frequency deviation, it is possible to stabilize or destabilize the degree of organization
of the vortices in the near wake.
Fig. 1. Principal modes in the lock-in region of forced oscillation (from Williamson and Roshko, 1988). Cases examined herein are
shown by X.
ARTICLE IN PRESSS. Atluri et al. / Journal of Fluids and Structures 25 (2009) 229–244 231
More recently, Gu et al. (1994) also undertook an experimental study of the timing problem. They noticed that, for a
cylinder oscillating at a frequency lower than the natural shedding frequency, the vortices were shed when the cylinder
had reached the maximum amplitude on the same side from which the maximum amplitude was reached. As the
oscillation frequency was increased above the natural shedding frequency, the vortices were shed on the opposite side
from which the maximum amplitude of the cylinder displacement was reached. Lu and Dalton (1996) confirmed these
results numerically.
Feng (1968) studied VIV for air flow past an elastically mounted circular cylinder. The response behavior in
his studies is fairly similar to the forced oscillation experiments. There were both high-amplitude and low-amplitude
responses. Brika and Laneville (1993) and Govardhan and Williamson (2000) conducted similar experiments to those
of Feng, but in water which produces a very different mass ratio effect. Both studies concluded that the lower
amplitude response corresponds to 2S vortex shedding and the higher amplitude response corresponds to 2P vortex
shedding.
Khalak and Williamson (1999) also repeated Feng’s experiments in water at a different mass ratio. A larger
synchronization range was observed compared to Feng’s results. The initial branch of Khalak and Williamson
represents a 2S mode and the lower branch represents a 2P mode. Blackburn et al. (2001) validated these results by
using Direct Numerical Simulation (DNS) at Re ¼ 500.
Several recent CFD studies are relevant regarding the W&R map. A few studies at moderate Reynolds numbers will
be discussed briefly. Lu and Turan (2000) examined the forced-oscillation problem for Re ¼ 2000. They observed that
the wake had a 2P behavior at fv/fe ¼ 1.21 for A/d ¼ 2; this point on the W&R map is slightly above the 2P and P+S
boundary in the region where no synchronized pattern exists. They also found, at fv/fe ¼ 2.0, that there was no
synchronized pattern which is consistent with the W&R map. At fv/fe ¼ 3.0, they found a 3P pattern where the updated
W&R map (Williamson and Govardhan, 2004) calls this structure the 2P+2S mode. These quite likely represent the
same mode since each contains six vortices shed per cycle. Lu and Turan note their results at Re ¼ 100 agreed better
with the experimental results of W&R. For Re41000, they note that ‘‘quantitative differences occur although the
qualitative flow field is still in close agreement with the experimental results’’. Lu and Turan attribute these differences
to the fact that they did not use a turbulence model, even at Re ¼ 2000, and their calculations were 2-D which suggests
that they could not capture the upper branch of the displacement versus reduced velocity plot. Regardless of these
suggested shortcomings, there is quite likely a Reynolds number influence here also.
Guilmineau and Queutey (2004) considered an elastically mounted cylinder at low mass damping, oscillating
transversely. They performed a 2-D numerical solution using primitive variables on a structured grid using k�oReynolds-averaged Navier–Stokes (RANS) modeling and a finite volume representation. The Reynolds number range
was 900–15 000, the reduced velocity range was 1–17, the reduced mass was 2.4 and the mass-damping value was 0.013.
A 2S mode was observed at UR ¼ 3.63 and A/d ¼ 0.34 (initial branch), 2P (possibly) at UR ¼ 4.51 and 2S at UR ¼ 11.0
and A/d ¼ 0.95 (upper branch), 2P at UR ¼ 6.91 and A/d ¼ 0.58 (lower branch). The second and fourth of these results
do not agree with the W&R map which again suggests a Reynolds number influence as Re increases.
Willden (2006) considered an undamped self-excited 2-D oscillation at Re ¼ 104 and m* ¼ 2, using large eddy
simulation (LES) on an unstructured grid with a finite-element solution. He found the wake to be 2S (initial branch) at
UR ¼ 2.2 and A/d ¼ 0.25, 2P (lower branch) at UR ¼ 5.9 and A/d ¼ 0.55, P+S at UR ¼ 6.9 and A/d ¼ 0.55 and 0.4,
and indeterminate (switching from P+S to 2P) on the upper branch. Again, these behaviors deviate somewhat from the
W&R map, possibly because of the higher value of Re.
However, most of these results, both experimental and numerical, represent moderate Reynolds numbers. A typical
practical scenario, like VIV of a riser on an offshore platform, would be at high Reynolds numbers and at a
nonconstant frequency and amplitude, i.e., a self-excited oscillation.
1.2. Focus of this study
One objective of this study is to identify the differences in the wake structures of a periodic forced oscillation and a
self-excited oscillation. A true VIV event does not have a controlled oscillation of the cylinder, and hence it is not
meaningful to compare a periodic forced-oscillation case and a self-excited oscillation case. Our approach is to compare
a periodic forced oscillation with a nonperiodic forced oscillation, both at constant amplitude. So, we seek further
clarification to the differences between constant and variable frequency oscillations of a circular cylinder. Instead, while
keeping the amplitude constant, the frequency of the periodic forced oscillation will be modulated to accommodate
variable frequencies to achieve an effect a step closer to an actual VIV event. This kind of oscillation will have the
dominant frequency and amplitude similar to that of a periodic oscillation but its instantaneous frequency differs from
that of a pure sinusoidal oscillation. The vorticity contours for the various runs will be plotted and examined at
different amplitudes, frequencies, and Reynolds numbers.
ARTICLE IN PRESSS. Atluri et al. / Journal of Fluids and Structures 25 (2009) 229–244232
A second objective is to show that there is a Reynolds number influence on the vortex-shedding modes. We feel that
we can demonstrate, using a 2-D calculation, that both effects influence the wake modes even though we are not
capturing the complete details of the flow. Both of these considerations will provide an extended interpretation of the
W&R map and complement other studies that have also provided further understanding of the W&R map.
In the present study, a 2-D uniform flow past a circular cylinder oscillating at a modulated frequency is numerically
simulated. The Reynolds number range is 500–8000 and the wake turbulence is modeled by the Smagorinsky version of
LES. The 2-D Navier–Stokes equations in a vorticity/stream-function form are solved using a finite-difference
discretization. A second-order implicit Crank–Nicolson scheme for the diffusion terms and a third-order
Adams–Bashforth scheme for time advancement are used in the solution.
We preface the discussion of our calculations with the reminder that our calculations are 2-D while the experiments
represented in the W&R map are clearly 3-D. We obviously do not capture these 3-D effects with our 2-D simulations.
Thus, we expect some influence on the results from this difference. However, the kinematics of a calculated 2-D flow
field do not differ from the actual flow at a given axial position nearly as much as the calculated 2-D forces differ from
the measured forces, especially at the relatively low Reynolds numbers representing the W&R map. So we expect that
the calculated 2-D vortex patterns do have a reasonable measure of reality when compared to physical results at a given
axial plane.
We do not always obtain the same mode behavior as shown on the W&R map for the same set of parameters in this
set of comparisons. We attribute some of the differences to the fact that we are doing 2-D simulations; but some of the
differences can also be attributed to the changes in Reynolds number. We note here that other investigators have also
not found strict agreement with the W&R map.
2. Numerical studies of flow past a cylinder
In recent years, the forced-vibration problem and the VIV problem have been addressed using various computational
procedures such as a discrete-vortex method, RANS equations, LES, DNS or a combination of different models.
LES involves a direct simulation of the dynamically important large-scale motions. The subgrid-scale turbulence
model represents the effect of the unresolved small scales on the large scales. Many recent numerical studies, such as
Beaudan and Moin (1994), Zhang (1995), Lu et al. (1997), Kravchenko et al. (1999) and Xu and Dalton (2001),
conducted LES studies for 3-D flow past a fixed circular cylinder over a range of moderate values of Re and showed a
similarity between the computed wake structures to those obtained from flow visualization studies. There have been
more recent studies at higher Reynolds numbers, but these are not relevant to this effort.
Zhang and Dalton (1996) performed a 2-D LES numerical study at Re ¼ 13 000 for transverse VIV. The results
showed a reasonable agreement with the experimental measurements of the lock-in phenomenon. Dalheim (2000)
conducted a 2-D numerical study to predict transverse VIV oscillation of a long riser using Strip Theory coupled
with the technique of modal superposition. Saltara et al. (1998) performed a VIV study using a discrete-vortex/LES
method at Re ¼ 1000 for a one degree-of-freedom (dof) problem. Tutar and Holdo (2000) found that a 3-D simulation
is necessary for accurate results when the cylinder is vibrating. Al-Jamal and Dalton (2004) conducted a 2-D numerical
simulation with LES modeling of a uniform approach-velocity flow past a circular cylinder undergoing VIV in
the transverse direction. The calculated lock-in regime obtained by them found agreement with many experimental
results for the case of moderate ratios of effective density of the cylinder to the fluid density. However, some
disagreements were found for the cases of smaller ratios. These disagreements provided some of the impetus for the
present study.
2.1. Governing equations
We will use the LES method with Smagorinsky subgrid scale modeling to represent the wake turbulence for the range
of Reynolds numbers considered. The approach taken to calculate the flow field is similar to that of Zhang and Dalton
(1996). A finite-difference scheme serves as a natural filtering operation with a filter width that is the width of the local
grid size. The filtered 2-D governing equations are the Poisson equation for the stream function c,
r2c ¼ �o, (1)
and the vorticity transport equation
qoqtþ u
qoqrþ
v
r
qoqy¼ ðnþ ntÞ
q2
qr2þ
1
r
qqrþ
q2
qy2
� �o, (2)
ARTICLE IN PRESSS. Atluri et al. / Journal of Fluids and Structures 25 (2009) 229–244 233
where
u ¼1
r
qcqy; v ¼ �
qcqr; and o ¼
1
r
qðrvÞ
qr�
1
r
qu
qy. (3)
In the equations above, r and y are the dimensional coordinates in the physical plane, t is the dimensional time, v is
the kinematic viscosity of the fluid, vt is the turbulent eddy viscosity, u and v are the radial and circumferential velocity
components, and o is the vorticity. All of the flow variables are the filtered, or resolvable, quantities.
The effects of the turbulence are represented by an eddy viscosity nt which is determined from a subgrid scale model.
In the present study, we use the Smagorinsky model
nt ¼ ðCsDÞ2ffiffiffiffiffiffiffiffiffiffiffiffiffi2SijSij
p(4)
where Cs is the Smagorinsky constant, D is the length scale (taken here to be the local mesh size), and Sij is the strain
rate tensor.
The fluid viscosity dominates over the turbulence as the wall is approached. A wall damping formulation, suggested
by Van Driest (1956) is implemented such that the turbulence is damped exponentially. As a result, nt will become
nt ¼ CsD 1� exp �yþ
26
� �2" # !( )2 ffiffiffiffiffiffiffiffiffiffiffiffiffi
2SijSij
p, (5)
where y+ denotes the nondimensional normal distance from the cylinder surface in the inner region, y+¼ yut/n with
ut ¼ (to/r)1/2, where to is the wall shear stress.
The cylinder radius, R, and the steady approach velocity, UN, have been selected as the length and velocity scales,
respectively, and the dimensionless time t is tUN/R. The nondimensional governing equations are
qoqtþ u
qoqrþ
v
r
qoqy¼
2
Reþ
2
Ret
� �r2o (6)
and
r2c ¼ �o. (7)
All of the terms in Eqs. (6) and (7) are now nondimensional. The Reynolds number and the turbulent (based on the
turbulent eddy viscosity) Reynolds number are, respectively, Re ¼ 2UN R/v and Ret ¼ 2UN R/vt It is more convenient
to solve this set of governing equations in a rectangular grid than a polar grid. Thus, the coordinate system is
transformed to a rectangular system. The coordinate transformation, similar to the one used by Justesen (1991), is
r ¼ 0:6ex þ 0:4 and y ¼ pZ. (8)
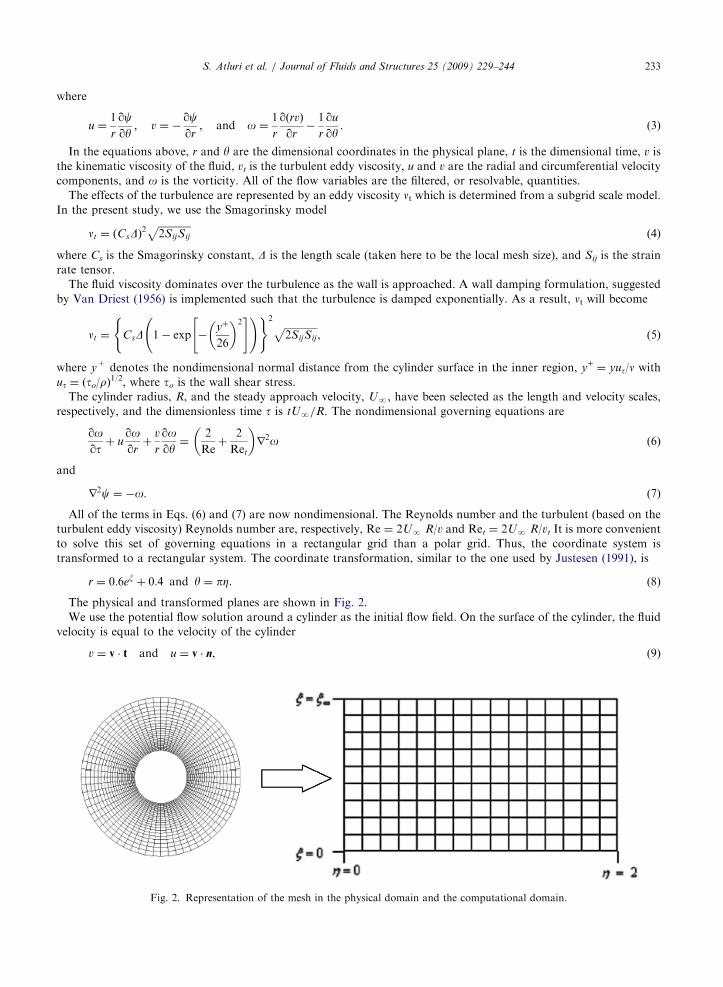
The physical and transformed planes are shown in Fig. 2.
We use the potential flow solution around a cylinder as the initial flow field. On the surface of the cylinder, the fluid
velocity is equal to the velocity of the cylinder
v ¼ v � t and u ¼ v � n, (9)
Fig. 2. Representation of the mesh in the physical domain and the computational domain.
ARTICLE IN PRESSS. Atluri et al. / Journal of Fluids and Structures 25 (2009) 229–244234
where v and u are, respectively, the tangential and normal components of the velocity of the cylinder, v is the fluid
velocity vector, and t and n are, respectively, the unit tangent and normal vectors of the moving cylinder surface. In the
coordinate system that is attached to the cylinder, we have
v ¼ u ¼ 0. (10)
2.2. Boundary conditions
On the surface of the fixed cylinder, r ¼ 1, the boundary conditions are the no-slip and no-penetration conditions
c ¼ �qcqr¼
1
r
qcqy¼ 0. (11)
The outer boundary conditions, as r-rN, are the combination of the Dirichlet boundary conditions, in the nonwake
region
c ¼ U1 r� 1r
� �sin y
o ¼ 0
)(12)
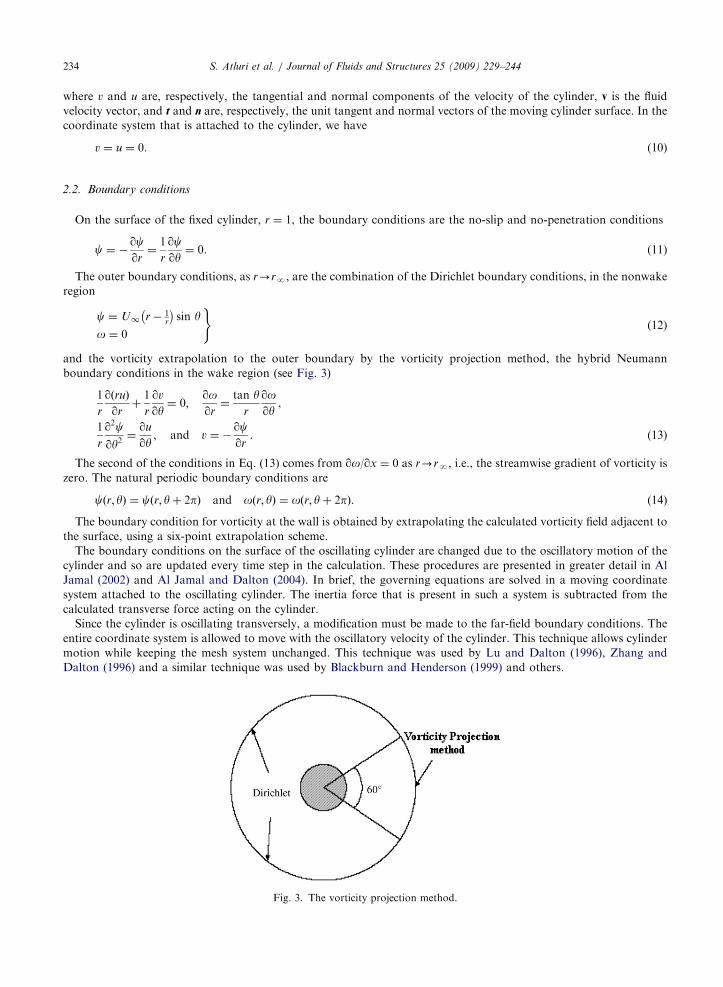
and the vorticity extrapolation to the outer boundary by the vorticity projection method, the hybrid Neumann
boundary conditions in the wake region (see Fig. 3)
1
r
qðruÞ
qrþ
1
r
qv
qy¼ 0;
qoqr¼
tan yr
qoqy
,
1
r
q2c
qy2¼
qu
qy; and v ¼ �
qcqr
. (13)
The second of the conditions in Eq. (13) comes from qo/qx ¼ 0 as r-rN, i.e., the streamwise gradient of vorticity is
zero. The natural periodic boundary conditions are
cðr; yÞ ¼ cðr; yþ 2pÞ and oðr; yÞ ¼ oðr; yþ 2pÞ. (14)
The boundary condition for vorticity at the wall is obtained by extrapolating the calculated vorticity field adjacent to
the surface, using a six-point extrapolation scheme.
The boundary conditions on the surface of the oscillating cylinder are changed due to the oscillatory motion of the
cylinder and so are updated every time step in the calculation. These procedures are presented in greater detail in Al
Jamal (2002) and Al Jamal and Dalton (2004). In brief, the governing equations are solved in a moving coordinate
system attached to the oscillating cylinder. The inertia force that is present in such a system is subtracted from the
calculated transverse force acting on the cylinder.
Since the cylinder is oscillating transversely, a modification must be made to the far-field boundary conditions. The
entire coordinate system is allowed to move with the oscillatory velocity of the cylinder. This technique allows cylinder
motion while keeping the mesh system unchanged. This technique was used by Lu and Dalton (1996), Zhang and
Dalton (1996) and a similar technique was used by Blackburn and Henderson (1999) and others.
Fig. 3. The vorticity projection method.
ARTICLE IN PRESSS. Atluri et al. / Journal of Fluids and Structures 25 (2009) 229–244 235
The motion of the cylinder oscillating with constant frequency is given as
Y ¼ A sinð2pf ctÞ, (15)
where A is the amplitude of oscillation and fc is the base frequency (hereafter, carrier frequency) of oscillation. The
description in Eq. (15) is referred to later as the mod-zero case. The motion of the cylinder oscillating with variable
frequency is given as
Y ¼ A sin 2pf ctþf c � f 1
f 1
sinð2pf 1tÞ� �
, (16)
where f1 is a modulating frequency. This is referred to later as the mod-one oscillation. Multiple frequencies can be used
to produce a more irregular frequency of oscillation as
Y ¼ A sin 2pf ctþXI
i
f c � f i
f i
sinð2pf itÞ
!, (17)
where fi represents the ith modulation frequency. This will be referred to later as a mod-I oscillation.
3. Results and discussion
Before proceeding to the results of the calculations of varying the Reynolds number with no modulation and
modulating the frequency at different Reynolds numbers, it would be instructive to examine the results at a particular
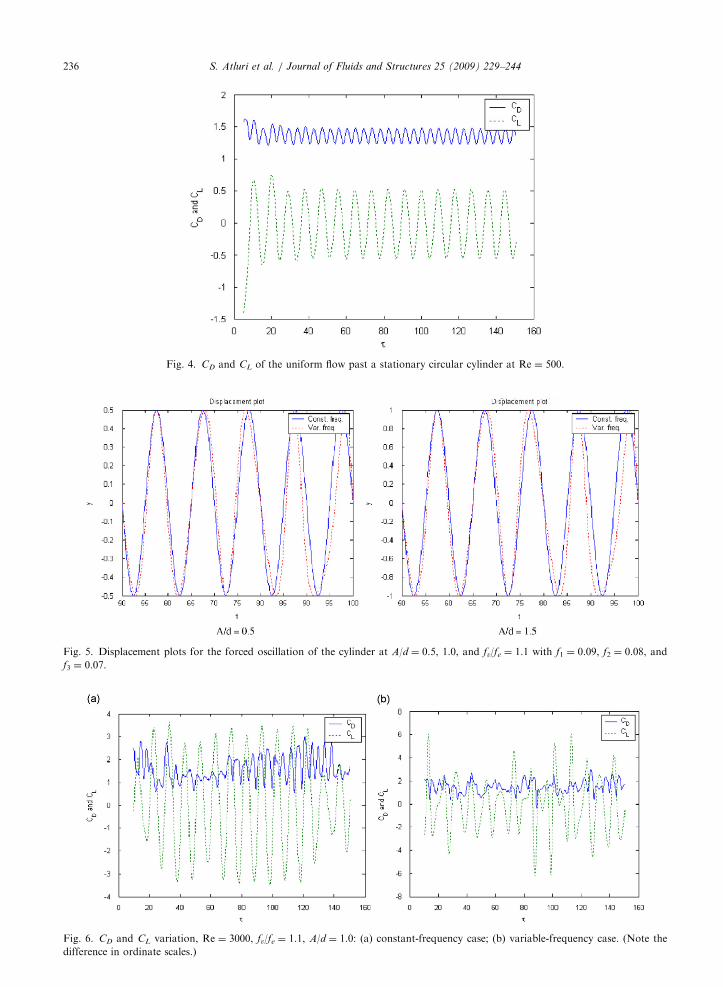
Reynolds number to see how the calculations compare with experimental results. Fig. 4 shows the drag and lift
coefficients for a stationary cylinder at Re ¼ 500. The values of the coefficients are about 10% higher than the
experimental values because of the 2-D representation of the flow in the calculations. The frequency of vortex shedding
is captured quite well; the Strouhal frequency is 0.22 as compared to the experimental value of about 0.2 at Re ¼ 500.
Fig. 5 shows a comparison between the constant and variable frequency oscillations for Re ¼ 500 at A/d ¼ 0.5 and
1.0. The influence is apparent. The modulation of the vibration frequency causes the time-response of the cylinder
displacement to vary noticeably, especially at the larger times in both plots in Fig. 5.
Fig. 6 shows the drag and lift coefficients at both constant and variable frequency (modulated so that the deviations
from the base frequency were small, regardless of the level of modulation).
3.1. Reynolds number dependence with no modulation
To illustrate the effect of Reynolds number, we have performed a series of calculations for Re values ranging from
500 to 8000 for A/d ¼ 0.5, 1.0, 1.5, and 2.0 and fv/fe ¼ 0.88, 1.1 and 1.36. Note that fv/fe ¼ Te/Tv on the W&R map. All
of these cases are shown in Table 1 and also indicated by X in Fig. 1 (the W&R map). Note that A/d ¼ 2.0 slightly
exceeds the maximum on the W&R map shown in Fig. 1, but the mode behavior at A/d ¼ 2.0 can be determined. Each
point (each set of A/d and Te/Tv (or fv/fe) values) in Fig. 1 represents up to five Reynolds numbers as mentioned above.
The W&R map does not represent the effects of Reynolds number greater than about 1000. It is the objective of this
part of the study to consider higher values of Re. For purposes of comparison, we will consider three consecutive cycles
of oscillation after the wake has been established and report the wake patterns for those cycles.
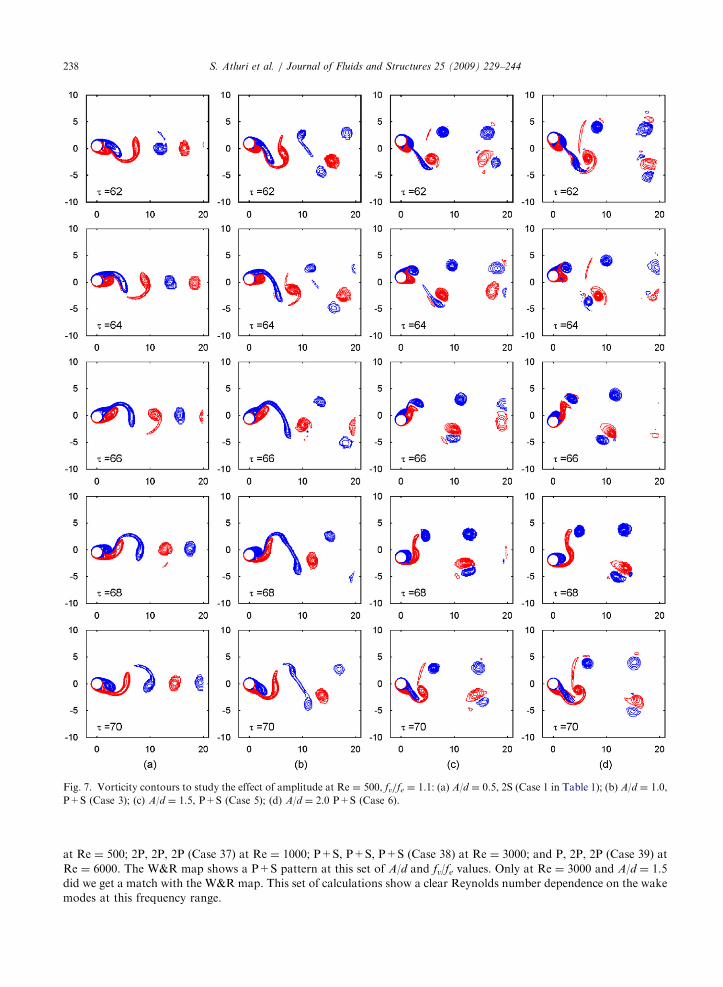
Fig. 7 shows the effect of changing the A/d value for Re ¼ 500 and fv/fe ¼ 1.1. At A/d ¼ 0.5, the mode pattern is 2S
(Case 1 in Table 1); at A/d ¼ 1.0, P+S (Case 3); at A/d ¼ 1.5, P+S (Case 5); and at A/d ¼ 2.0, P+S (Case 6). Modes of
2P are found on the W&R map for A/d ¼ 0.5, 1.0, and 1.5, although the two extreme values are close to the 2S and
P+S boundaries on the map, respectively. It is quite clear that increasing the A/d value changes the shedding modes, as
is shown on the W&R map. However, the calculations yield a different set of shedding modes than shown on the map.
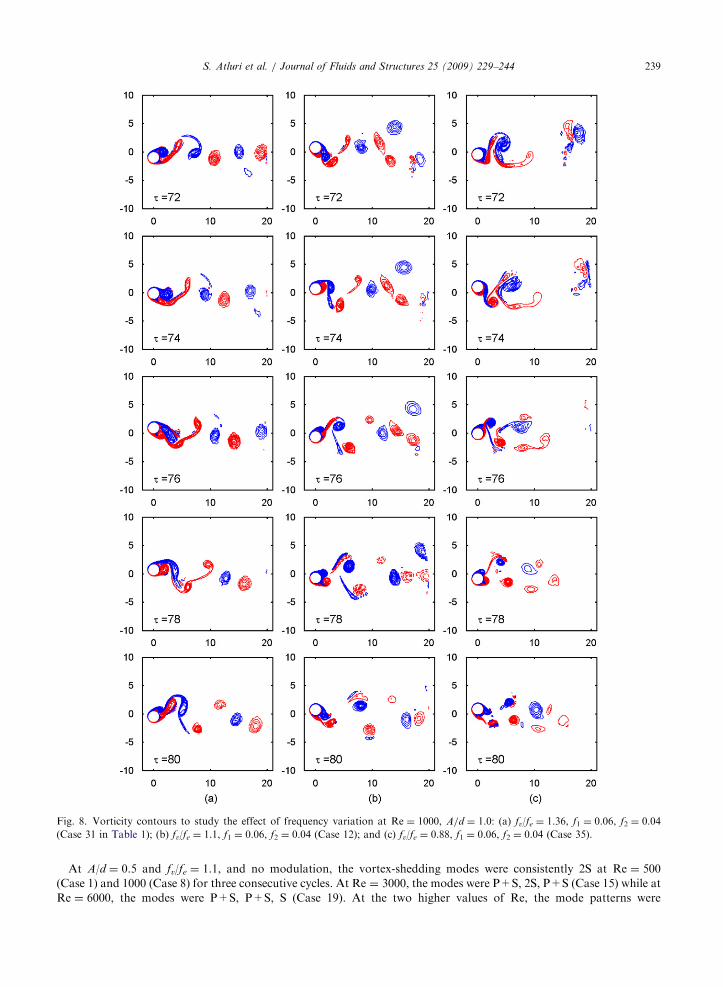
Fig. 8 shows the effect of changing the frequency ratio for Re ¼ 1000 and A/d ¼ 1.0 for a mod-two oscillation. Note
that the change in mode behavior with increasing time in the respective cycles for each of the three cases. Each of these
three cases on the W&R map falls in the 2P range. Only in the case of fv/fe ¼ 1.36 did the results yield a 2P pattern. For
fv/fe ¼ 1.1, there was a consistent P+S pattern over three consecutive cycles. For fv/fe ¼ 0.88, there was no consistent
pattern over three cycles. About one cycle of oscillation is covered in the five frames shown in Figs. 7 and 8. Since the
frequency is variable, it is difficult to compare these results in terms of cycles because each cycle is different.
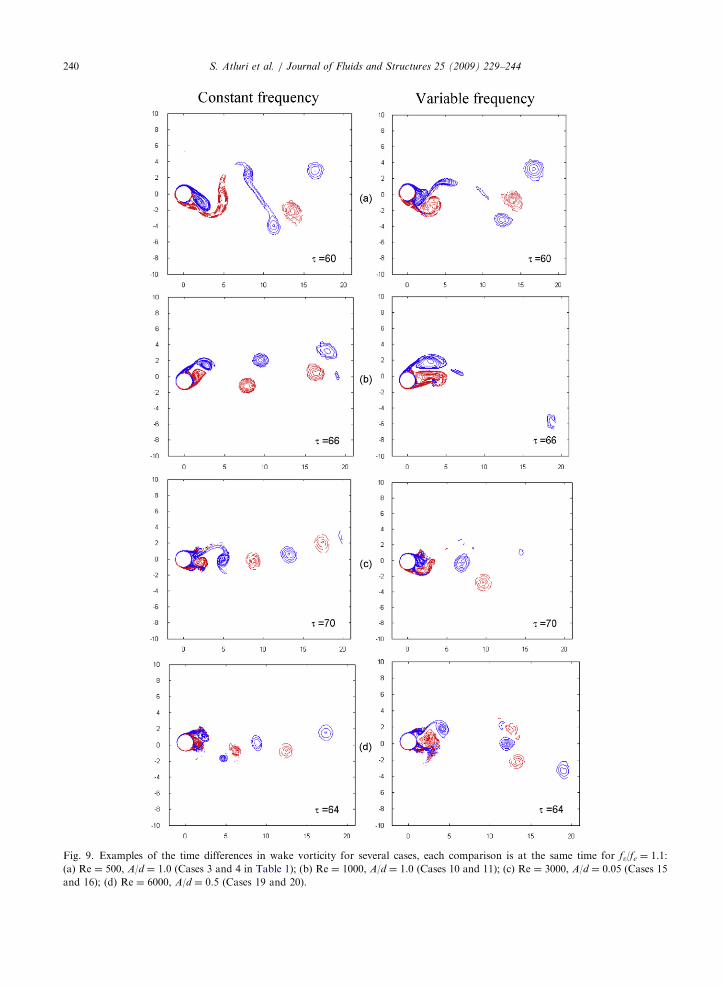
Fig. 9 shows a comparison between the constant and variable frequency cases at four different Reynolds numbers for
fv/fe ¼ 1.1. At Re ¼ 500 and A/d ¼ 1.0, the wake patterns are observed to be P+S, P+S, P+S (Case 3 in Table 1) for
constant frequency and 2S, P+S, 2S (Case 4) for modulated frequency. At Re ¼ 1000 and A/d ¼ 1.0, the wake patterns
ARTICLE IN PRESS
Fig. 5. Displacement plots for the forced oscillation of the cylinder at A/d ¼ 0.5, 1.0, and fv/fe ¼ 1.1 with f1 ¼ 0.09, f2 ¼ 0.08, and
f3 ¼ 0.07.
Fig. 6. CD and CL variation, Re ¼ 3000, fv/fe ¼ 1.1, A/d ¼ 1.0: (a) constant-frequency case; (b) variable-frequency case. (Note the
difference in ordinate scales.)
Fig. 4. CD and CL of the uniform flow past a stationary circular cylinder at Re ¼ 500.
S. Atluri et al. / Journal of Fluids and Structures 25 (2009) 229–244236
ARTICLE IN PRESS
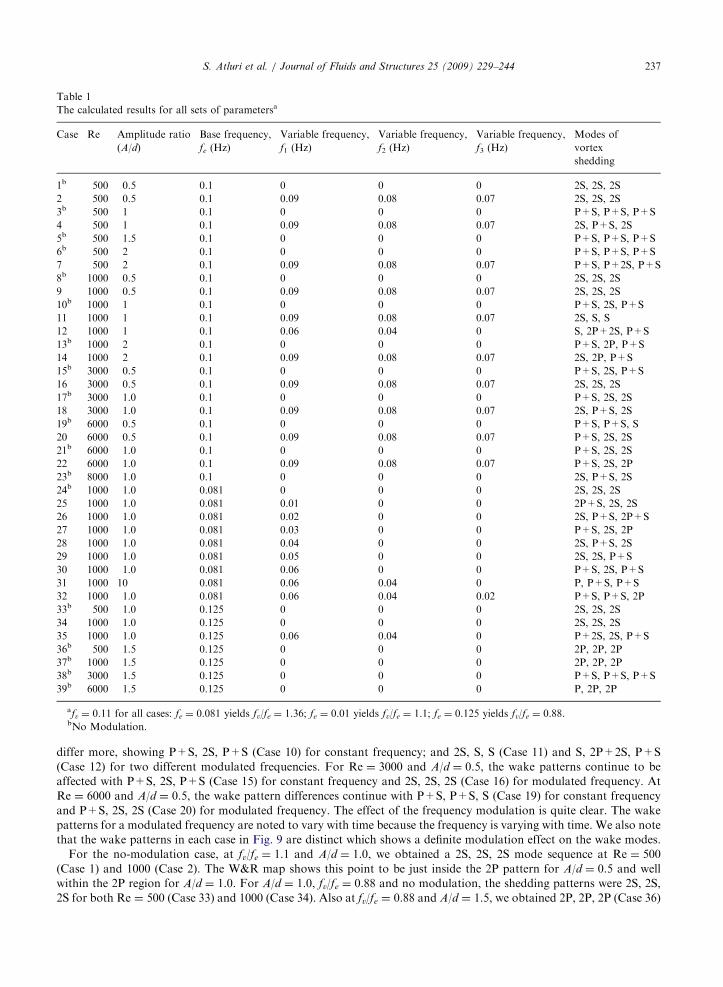
Table 1
The calculated results for all sets of parametersa
Case Re Amplitude ratio
(A/d)
Base frequency,
fe (Hz)
Variable frequency,
f1 (Hz)
Variable frequency,
f2 (Hz)
Variable frequency,
f3 (Hz)
Modes of
vortex
shedding
1b 500 0.5 0.1 0 0 0 2S, 2S, 2S
2 500 0.5 0.1 0.09 0.08 0.07 2S, 2S, 2S
3b 500 1 0.1 0 0 0 P+S, P+S, P+S
4 500 1 0.1 0.09 0.08 0.07 2S, P+S, 2S
5b 500 1.5 0.1 0 0 0 P+S, P+S, P+S
6b 500 2 0.1 0 0 0 P+S, P+S, P+S
7 500 2 0.1 0.09 0.08 0.07 P+S, P+2S, P+S
8b 1000 0.5 0.1 0 0 0 2S, 2S, 2S
9 1000 0.5 0.1 0.09 0.08 0.07 2S, 2S, 2S
10b 1000 1 0.1 0 0 0 P+S, 2S, P+S
11 1000 1 0.1 0.09 0.08 0.07 2S, S, S
12 1000 1 0.1 0.06 0.04 0 S, 2P+2S, P+S
13b 1000 2 0.1 0 0 0 P+S, 2P, P+S
14 1000 2 0.1 0.09 0.08 0.07 2S, 2P, P+S
15b 3000 0.5 0.1 0 0 0 P+S, 2S, P+S
16 3000 0.5 0.1 0.09 0.08 0.07 2S, 2S, 2S
17b 3000 1.0 0.1 0 0 0 P+S, 2S, 2S
18 3000 1.0 0.1 0.09 0.08 0.07 2S, P+S, 2S
19b 6000 0.5 0.1 0 0 0 P+S, P+S, S
20 6000 0.5 0.1 0.09 0.08 0.07 P+S, 2S, 2S
21b 6000 1.0 0.1 0 0 0 P+S, 2S, 2S
22 6000 1.0 0.1 0.09 0.08 0.07 P+S, 2S, 2P
23b 8000 1.0 0.1 0 0 0 2S, P+S, 2S
24b 1000 1.0 0.081 0 0 0 2S, 2S, 2S
25 1000 1.0 0.081 0.01 0 0 2P+S, 2S, 2S
26 1000 1.0 0.081 0.02 0 0 2S, P+S, 2P+S
27 1000 1.0 0.081 0.03 0 0 P+S, 2S, 2P
28 1000 1.0 0.081 0.04 0 0 2S, P+S, 2S
29 1000 1.0 0.081 0.05 0 0 2S, 2S, P+S
30 1000 1.0 0.081 0.06 0 0 P+S, 2S, P+S
31 1000 10 0.081 0.06 0.04 0 P, P+S, P+S
32 1000 1.0 0.081 0.06 0.04 0.02 P+S, P+S, 2P
33b 500 1.0 0.125 0 0 0 2S, 2S, 2S
34 1000 1.0 0.125 0 0 0 2S, 2S, 2S
35 1000 1.0 0.125 0.06 0.04 0 P+2S, 2S, P+S
36b 500 1.5 0.125 0 0 0 2P, 2P, 2P
37b 1000 1.5 0.125 0 0 0 2P, 2P, 2P
38b 3000 1.5 0.125 0 0 0 P+S, P+S, P+S
39b 6000 1.5 0.125 0 0 0 P, 2P, 2P
afv ¼ 0.11 for all cases: fe ¼ 0.081 yields fv/fe ¼ 1.36; fe ¼ 0.01 yields fv/fe ¼ 1.1; fe ¼ 0.125 yields fv/fe ¼ 0.88.bNo Modulation.
S. Atluri et al. / Journal of Fluids and Structures 25 (2009) 229–244 237
differ more, showing P+S, 2S, P+S (Case 10) for constant frequency; and 2S, S, S (Case 11) and S, 2P+2S, P+S
(Case 12) for two different modulated frequencies. For Re ¼ 3000 and A/d ¼ 0.5, the wake patterns continue to be
affected with P+S, 2S, P+S (Case 15) for constant frequency and 2S, 2S, 2S (Case 16) for modulated frequency. At
Re ¼ 6000 and A/d ¼ 0.5, the wake pattern differences continue with P+S, P+S, S (Case 19) for constant frequency
and P+S, 2S, 2S (Case 20) for modulated frequency. The effect of the frequency modulation is quite clear. The wake
patterns for a modulated frequency are noted to vary with time because the frequency is varying with time. We also note
that the wake patterns in each case in Fig. 9 are distinct which shows a definite modulation effect on the wake modes.
For the no-modulation case, at fv/fe ¼ 1.1 and A/d ¼ 1.0, we obtained a 2S, 2S, 2S mode sequence at Re ¼ 500
(Case 1) and 1000 (Case 2). The W&R map shows this point to be just inside the 2P pattern for A/d ¼ 0.5 and well
within the 2P region for A/d ¼ 1.0. For A/d ¼ 1.0, fv/fe ¼ 0.88 and no modulation, the shedding patterns were 2S, 2S,
2S for both Re ¼ 500 (Case 33) and 1000 (Case 34). Also at fv/fe ¼ 0.88 and A/d ¼ 1.5, we obtained 2P, 2P, 2P (Case 36)
ARTICLE IN PRESS
Fig. 7. Vorticity contours to study the effect of amplitude at Re ¼ 500, fv/fe ¼ 1.1: (a) A/d ¼ 0.5, 2S (Case 1 in Table 1); (b) A/d ¼ 1.0,
P+S (Case 3); (c) A/d ¼ 1.5, P+S (Case 5); (d) A/d ¼ 2.0 P+S (Case 6).
S. Atluri et al. / Journal of Fluids and Structures 25 (2009) 229–244238
at Re ¼ 500; 2P, 2P, 2P (Case 37) at Re ¼ 1000; P+S, P+S, P+S (Case 38) at Re ¼ 3000; and P, 2P, 2P (Case 39) at
Re ¼ 6000. The W&R map shows a P+S pattern at this set of A/d and fv/fe values. Only at Re ¼ 3000 and A/d ¼ 1.5
did we get a match with the W&R map. This set of calculations show a clear Reynolds number dependence on the wake
modes at this frequency range.
ARTICLE IN PRESS
Fig. 8. Vorticity contours to study the effect of frequency variation at Re ¼ 1000, A/d ¼ 1.0: (a) fv/fe ¼ 1.36, f1 ¼ 0.06, f2 ¼ 0.04
(Case 31 in Table 1); (b) fv/fe ¼ 1.1, f1 ¼ 0.06, f2 ¼ 0.04 (Case 12); and (c) fv/fe ¼ 0.88, f1 ¼ 0.06, f2 ¼ 0.04 (Case 35).
S. Atluri et al. / Journal of Fluids and Structures 25 (2009) 229–244 239
At A/d ¼ 0.5 and fv/fe ¼ 1.1, and no modulation, the vortex-shedding modes were consistently 2S at Re ¼ 500
(Case 1) and 1000 (Case 8) for three consecutive cycles. At Re ¼ 3000, the modes were P+S, 2S, P+S (Case 15) while at
Re ¼ 6000, the modes were P+S, P+S, S (Case 19). At the two higher values of Re, the mode patterns were
ARTICLE IN PRESS
Fig. 9. Examples of the time differences in wake vorticity for several cases, each comparison is at the same time for fv/fe ¼ 1.1:
(a) Re ¼ 500, A/d ¼ 1.0 (Cases 3 and 4 in Table 1); (b) Re ¼ 1000, A/d ¼ 1.0 (Cases 10 and 11); (c) Re ¼ 3000, A/d ¼ 0.05 (Cases 15
and 16); (d) Re ¼ 6000, A/d ¼ 0.5 (Cases 19 and 20).
S. Atluri et al. / Journal of Fluids and Structures 25 (2009) 229–244240
ARTICLE IN PRESSS. Atluri et al. / Journal of Fluids and Structures 25 (2009) 229–244 241
inconsistent, unlike those at the two lower values of Re. The W&R map shows a 2P pattern for this set of values of A/d
and fv/fe, although this point on the map is very close to the line separating the 2S and 2P regimes. A Reynolds number
effect seems to be responsible for these discrepancies with the W&R map.
At A/d ¼ 1.0 and fv/fe ¼ 1.1 again with no modulation, we obtained shedding modes of P+S, P+S, P+S at
Re ¼ 500 (Case 3); P+S, 2S, P+S at Re ¼ 1000 (Case 10); P+S, 2S, 2S at Re ¼ 3000 (Case 17); P+S, 2S, 2S at
Re ¼ 6000 (Case 21); and 2S, P+S, 2S at Re ¼ 8000 (Case 23). The W&R map shows a 2P shedding pattern for this set
of A/d and fv/fe values. Similar to the A/d ¼ 0.5 results, this shows a definite Reynolds number influence as Re increases.
The vortex modes do not have a consistent behavior at the two larger Re values.
For A/d ¼ 2.0 and fv/fe ¼ 1.1 and no modulation, we found that the shedding modes were P+S, P+S, P+S at
Re ¼ 500 (Case 6) and P+S, 2P, P+S at Re ¼ 1000 (Case 13). From the W&R map, a P+S behavior might be
expected for this condition, although this is somewhat speculative.
For A/d ¼ 1.0 and fv/fe ¼ 1.36 and no modulation (Case 24), the shedding patterns were P+S, P+S, and P+S for
the three consecutive cycles of vortex shedding at Re ¼ 1000. The W&R map shows a 2P pattern for this condition,
although, as noted before, this point is somewhat close to the right extreme of the 2P regime.
Our observation for this set of calculations at these three different constant (unmodulated) frequencies is that there is
a Reynolds number dependence on the vortex-shedding patterns for several cases. We also note that we did not
reproduce the results in the W&R map except for the case of A/d ¼ 1.5 and fv/fe ¼ 0.88 at Re ¼ 3000. In addition, the
calculated results were somewhat close to those results shown in the W&R map at Re ¼ 500.
3.2. Modulation dependence at different Reynolds numbers
We also allowed the frequency of oscillation to vary while keeping the oscillation amplitude constant for many of the
cases considered in the variable Re study.
At A/d ¼ 0.5, fv/fe ¼ 1.1, and Re ¼ 500, 1000, 3000, and 6000, we compared a constant frequency of oscillation
(mod-zero) case with a modulated frequency with f1 ¼ 0.09, f2 ¼ 0.08, and f3 ¼ 0.07 (mod-three). At Re ¼ 500 (Cases 1
and 2) and 1000 (Cases 8 and 9), we found a repeatable 2S pattern at both the mod-zero and mod-three cases. In other
words, modulation had no effect at this low amplitude and low Re cases. The W&R map indicates a 2P mode is present
for this case, although the point is very close to the line separating the 2S and 2P regimes. At Re ¼ 3000, the mod-zero
results shows P+S, 2S, P+S (Case 15) while the mod-three result shows 2S, 2S, 2S (Case 16) which clearly indicates an
effect of frequency modulation. At Re ¼ 6000, the mod-zero result shows 2S, P+S, 2S (Case 19) while the mod-three
result shows P+S, 2S, 2S (Case 20). This latter case indicates essentially no effect of frequency modulation. The
observation to be made here is that there is an effect on the vortex-shedding modes, but it seems to be a Reynolds
number dependence rather than a dependence on the frequency at this low value of A/d.
Next, a comparison was made between the mod-zero and mod-three cases at A/d ¼ 1.0, Re ¼ 500, and fv/fe ¼ 1.1.
For mod-zero, we found P+S, P+S, P+S (Case 3) and, for mod-three, we found 2S, P+S, 2S (Case 4) in three
consecutive cycles. This shows a dependence on the frequency change. When we increase A/d to a value of 2 at Re ¼ 500
and fv/fe ¼ 1.1, the mod-zero pattern is P+S, P+S, P+S (Case 6) and the mod-three pattern is P+S, P+2S, P+S
(Case 7). There is a very slight modification in the wake pattern for this frequency change.
We then compared the mod-zero, mod-two and mod-three cases at A/d ¼ 1.0, Re ¼ 1000, and fv/fe ¼ 1.1. The mod-
zero pattern is P+S, 2S, P+S (Case 10); the mod-two pattern is S, 2P+2S, P+S (Case 12); and the mod-three pattern
is 2S, S, S (Case 11). This comparison shows a clear dependence on modulation. We next increased the A/d value to 2.0
with Re ¼ 1000 and fv/fe ¼ 1.1. The mod-zero pattern is P+S, 2P, P+S (Case 13) while the mod-three pattern is 2S, 2P,
P+S (Case 14). This comparison also shows a clear dependence on modulation.
We next increased Re to 3000 for A/d ¼ 1.0 and fv/fe ¼ 1.1. The mod-zero pattern is P+S, 2S, 2S (Case17) while the
mod-three pattern is 2S, P+S, 2S (Case 18). Next, Re was increased to 6000, while keeping the same A/d and fv/fe
values. The mod-zero result is P+S, 2S, 2S (Case 21) while the mod-three result is P+S, 2S, 2P (Case 22). This shows a
slight Re dependence for like values of A/d and fv/fe.
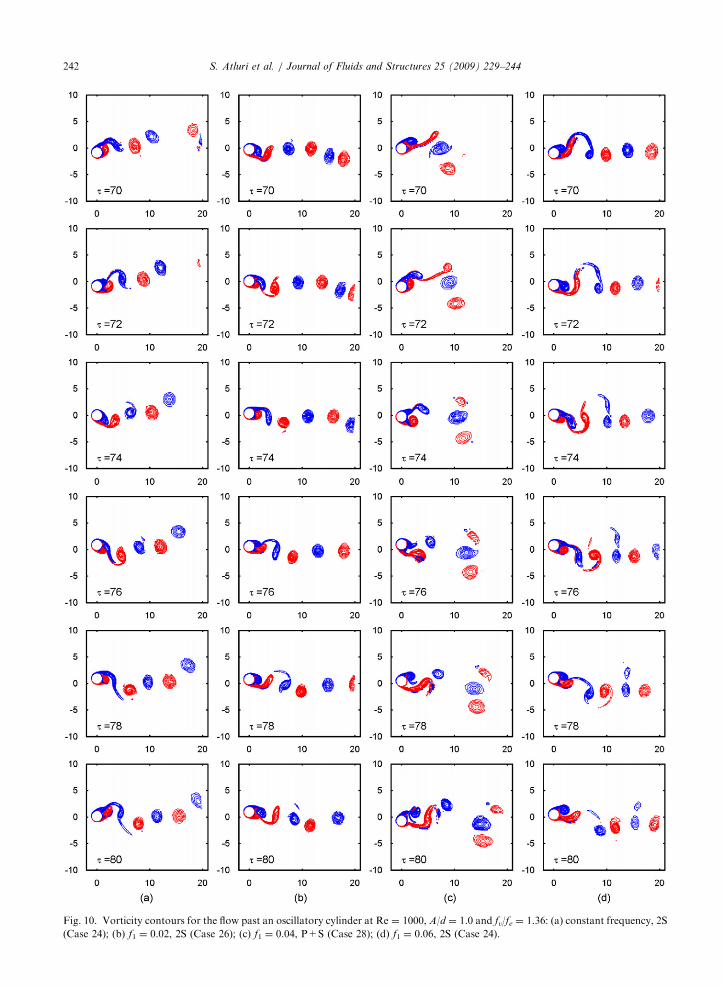
The next frequency-modulated case is for A/d ¼ 1.0 and Re ¼ 1000 at fv/fe ¼ 1.36 (mod-one). In the example, we let
the value of f1 increase from 0.0 to 0.06 in increments of 0.01 with f2 ¼ f3 ¼ 0. With f1 ¼ 0.0, the shedding mode is 2S,
2S, 2S (Case 24); at f1 ¼ 0.01, 2P+S, 2S, 2S (Case 25); at f1 ¼ 0.02, 2S, 2P+S, 2P+S (Case 26); f1 ¼ 0.03, P+S, 2S, 2P
(Case 27); f1 ¼ 0.04, 2S, P+S, 2S (Case 28); f1 ¼ 0.05, 2S, 2S, P+S (Case 29); and f1 ¼ 0.06, P+S, 2S, P+S (Case 30).
It is clear that there is a frequency dependence on the vortex-shedding modes. There is a continual change in the modes
as the value of f1 is increased. This sequence is shown in Fig. 10 in which there is a clear influence shown for the change
in the modulation frequency.
The situation in the preceding paragraph is extended by further modulation of the frequency. First, we let f2 ¼ 0.04
(mod-two) with f1 ¼ 0.06 and f3 ¼ 0.0. This yields a vortex-shedding pattern of P, P+S, P+S (Case 31). Next, with f2
ARTICLE IN PRESS
Fig. 10. Vorticity contours for the flow past an oscillatory cylinder at Re ¼ 1000, A/d ¼ 1.0 and fv/fe ¼ 1.36: (a) constant frequency, 2S
(Case 24); (b) f1 ¼ 0.02, 2S (Case 26); (c) f1 ¼ 0.04, P+S (Case 28); (d) f1 ¼ 0.06, 2S (Case 24).
S. Atluri et al. / Journal of Fluids and Structures 25 (2009) 229–244242
ARTICLE IN PRESSS. Atluri et al. / Journal of Fluids and Structures 25 (2009) 229–244 243
still equal to 0.04, we let f3 ¼ 0.02 (mod-three); the vortex-shedding pattern becomes P+S, P+S, 2P (Case 32). Again,
there is a clear frequency dependence on the shedding modes.
A summary of the modulated frequency comparisons indicates that there is a modulation influence in most cases and
that there is no consistency in the wake patterns regarding frequency modulations. There appears to be no predictable
trend to the results. It is not meaningful to relate these results to the W&R map since the frequency is a variable in the
present study. Thus, we observe, in general, that the W&R mode patterns are not replicated when frequency variations
are taken into account.
4. Conclusions
We have examined the influence of Reynolds number and frequency modulation on the constant-amplitude forced
oscillation of a circular cylinder in a constant-velocity approach flow. Our calculations have been 2-D which do not
provide for a precise comparison to experimental results. However, within the context of the 2-D calculations, the effect
of the influence of oscillation frequency and Reynolds number on the wake mode behaviors can clearly be seen. We
have found that there is an influence of Reynolds number when Re is increased to a value as high as 8000. The
calculated wake modes do not agree with those in the W&R map except in some cases where Re and A/d are in the
lowest ranges considered herein. We have also found that modulating the oscillation frequency at a constant-amplitude
oscillation also has a distinct influence on the wake-mode behaviors. The base frequency was modulated by small
increments with noticeable effects. Regardless of agreement with the W&R map, we found that modulating the
oscillatory frequency clearly affects the vortex-shedding modes. However, we have not found a predictable trend
regarding the effect of either Reynolds number or frequency modulation in the calculations we have performed. Thus,
we suggest that there is a considerably more complicated nature of the wake patterns than is suggested by the
Williamson and Roshko map for higher Reynolds numbers and for slightly variable frequency. There remains
additional work to be done to clarify these issues.
Acknowledgements
The authors are grateful to RPSEA for providing financial support to the Center for Engineering Applications of
Composites at UH for this project. TLC2 at UH provided the computer support for this project for which we are grateful.
The authors are grateful to the reviewers of the paper for their scrutiny because of which the paper has been improved.
References
Al Jamal, H., 2002. A 2-D numerical study with LES modeling of vortex-induced vibration of a circular cylinder in a uniform flow at
moderate Reynolds number. Master’s Thesis, Mechanical Engineering, University of Houston.
Al Jamal, H., Dalton, C., 2004. Vortex-induced vibrations using large eddy simulation at a moderate Reynolds number. Journal of
Fluids and Structures 19, 73–92.
Beaudan, P., Moin, P., 1994. Numerical experiments on the flow past a circular cylinder at sub-critical Reynolds number. Report
TF-62, Mechanical Engineering Department, Stanford University, USA.
Bishop, R.E.D., Hassan, A.Y., 1964. The lift and drag forces in a circular cylinder in a flowing fluid. Proceedings of the Royal Society
of London A 277, 32–48.
Blackburn, H., Henderson, R., 1999. A study of 2-D flow past an oscillating cylinder. Journal of Fluid Mechanics 385, 255–286.
Blackburn, H., Govardhan, R.N., Williamson, C.H.K., 2001. A complementary numerical and physical investigation of vortex-
induced vibration. Journal of Fluids and Structures 15, 481–488.
Brika, D., Laneville, A., 1993. Vortex-induced vibrations of a long flexible cylinder. Journal of Fluid Mechanics 250, 451–508.
Dalheim, J., 2000. A numerical procedure for prediction of interference and collision of multiple risers. In: Proceedings of the ETCE/
OMAE/ASME Conference, February, New Orleans, LA, USA.
Feng, C.C., 1968. The measurement of vortex-induced effects in flow past stationary and oscillating circular and D-section cylinders.
M.A.Sc. Thesis, The University of British Columbia, Vancouver, BC, Canada.
Govardhan, R., Williamson, C.H.K., 2000. Modes of vortex formation and frequency response for a freely-vibrating cylinder. Journal
of Fluid Mechanics 420, 85–130.
Gu, W., Chyu, C., Rockwell, D., 1994. Timing of vortex shedding from an oscillating cylinder. Physics of Fluids 6, 3677–3682.
Guilmineau, E., Queutey, P., 2004. Numerical simulation of vortex-induced vibration of a circular cylinder with low mass-damping.
Journal of Fluids and Structures 19, 449–466.
Justesen, P., 1991. A numerical study of oscillating flow past a circular cylinder. Journal of Fluid Mechanics 222, 157–196.
ARTICLE IN PRESSS. Atluri et al. / Journal of Fluids and Structures 25 (2009) 229–244244
Khalak, A., Williamson, C.H.K., 1999. Motions, forces, and mode transitions in vortex-induced vibrations at low mass damping.
Journal of Fluids and Structures 13, 813–851.
Kravchenko, A.G., Moin, P., Shariff, K., 1999. B-spline methods and zonal grids for simulations of complex turbulent flows. Journal
of Computational Physics 151, 757–789.
Lu, X., Dalton, C., 1996. Calculation of the timing of vortex formation from an oscillating circular cylinder. Journal of Fluids and
Structures 10, 527–541.
Lu, S., Turan, O.F., 2000. Numerical prediction of flow fields around circular cylinders: forced motion and dynamic response cases.
ASME Journal of Fluids Engineering 122, 703–714.
Lu, X., Dalton, C., Zhang, J., 1997. Application of large eddy simulation flow past a circular cylinder. ASME Journal of Offshore
Mechanics and Arctic Engineering 119, 219–225.
Nakano, M., Rockwell, D., 1994. Flow structure in the frequency-modulated wake of a cylinder. Journal of Fluid Mechanics 266,
93–119.
Ongoren, A., Rockwell, D., 1988. Flow structure from an oscillating cylinder. Part 1. Mechanisms of phase shift and recovery in the
near wake. Journal of Fluid Mechanics 191, 197–223.
Saltara, F., Meneghini, J., Sigueria, C.R., Bearman, P., 1998. The simulation of vortex shedding from an oscillating circular cylinder
with turbulence modeling. In: Proceedings of the ASME Conference on Bluff Bodies and Vortex-Induced Vibration, Washington,
DC, USA.
Tutar, M., Holdo, A.E., 2000. Large eddy simulation of a smooth circular cylinder oscillating normal to a uniform flow. ASME
Journal of Fluids Engineering 122, 694–702.
Van Driest, E.R., 1956. On turbulent flow near a wall. Journal of the Aeronautical Sciences 23, 1007–1011.
Willden, R., 2006. Numerical simulation of the multiple branch transverse response of a low mass ratio elastically supported circular
cylinder. In: Proceedings, ASME PVP2006 Conference, Fluid-Structure Interaction Division, Vancouver, Canada.
Williamson, C.H.K., Govardhan, R., 2004. Vortex-induced vibrations. Annual Review of Fluid Mechanics 36, 413–455.
Williamson, C.H.K., Roshko, A., 1988. Vortex formation in the wake of an oscillating cylinder. Journal of Fluids and Structures 2,
355–381.
Xu, Y., Dalton, C., 2001. Computation of force on a cylinder in a shear flow. Journal of Fluids and Structures 15, 941–954.
Zhang, J., 1995. A numerical study of the three-dimensional unsteady flows past a circular cylinder. Ph.D. Dissertation, University of
Houston.
Zhang, J., Dalton, C., 1996. Interaction of vortex-induced vibrations of a circular cylinder and a steady approach flow at Re ¼ 13,000.
Computers and Fluids 25, 283–294.


