Embed Size (px)
Citation preview

1
Scoggins Dam
Overview of Seismic Risk
July 18, 2012
Overview of Seismic Risk
• Facility Description• Seismic Risk Identified• Risk Evaluation
– Seismic Loading– Field Program– Lab Testing– Embankment Analyses– Risk Analyses– Conclusions
2

Facility Description
3
Scoggins Dam
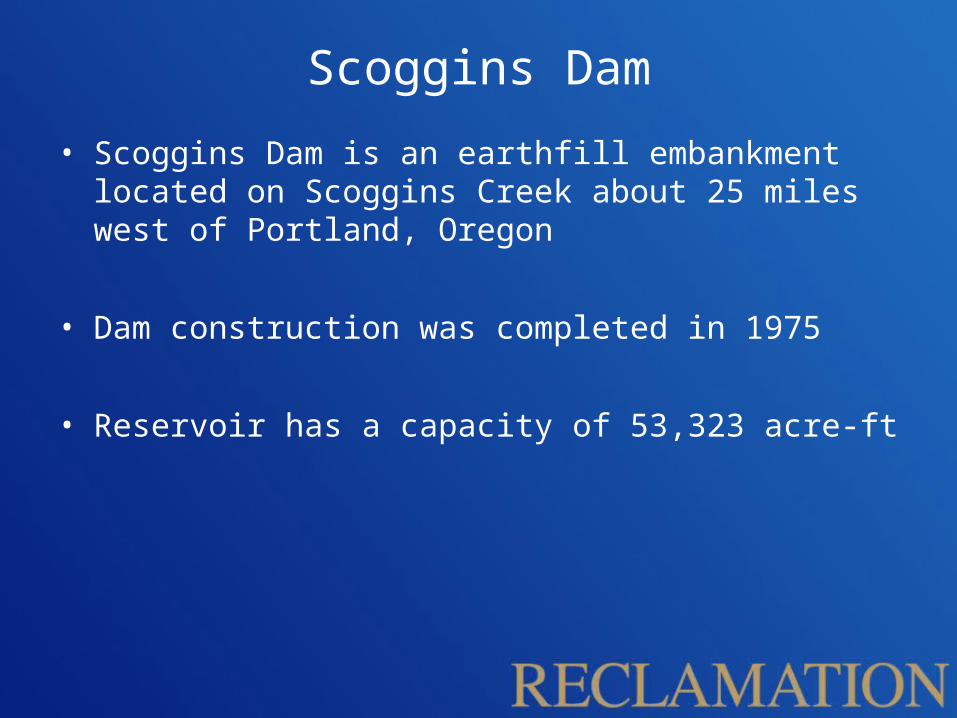
• Scoggins Dam is an earthfill embankment located on Scoggins Creek about 25 miles west of Portland, Oregon
• Dam construction was completed in 1975
• Reservoir has a capacity of 53,323 acre-ft

Scoggins Dam
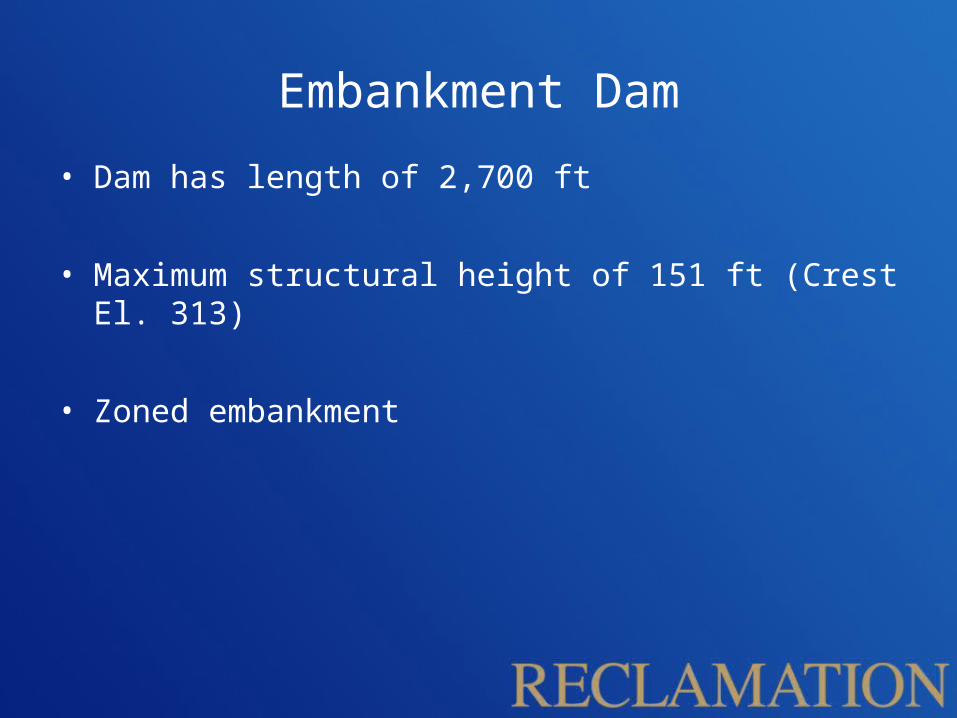
Embankment Dam
• Dam has length of 2,700 ft
• Maximum structural height of 151 ft (Crest El. 313)
• Zoned embankment
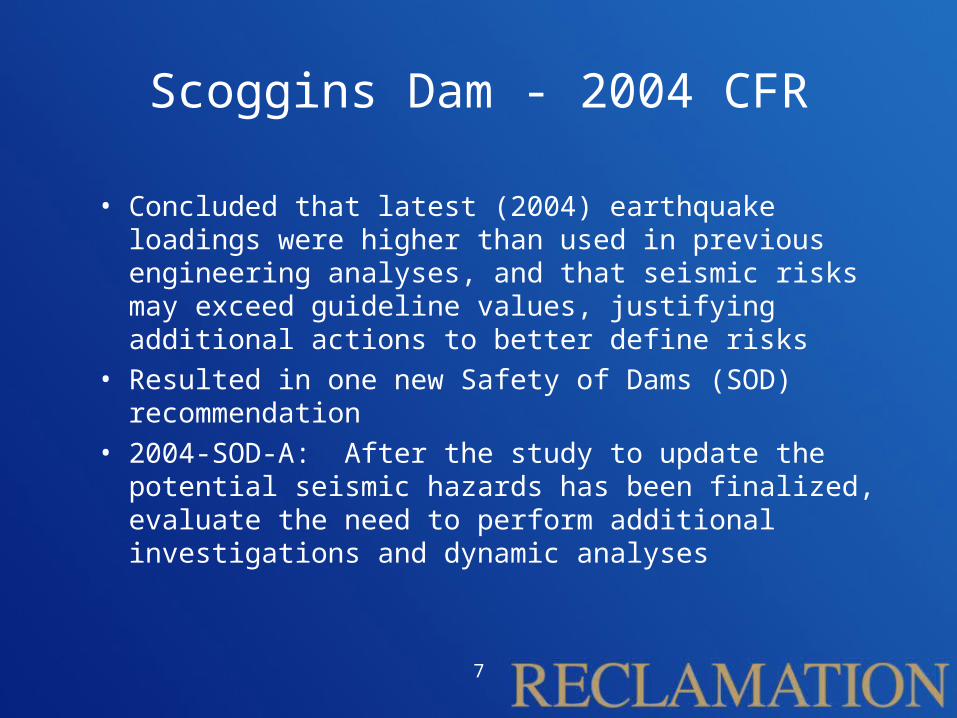
Scoggins Dam - 2004 CFR
• Concluded that latest (2004) earthquake loadings were higher than used in previous engineering analyses, and that seismic risks may exceed guideline values, justifying additional actions to better define risks
• Resulted in one new Safety of Dams (SOD) recommendation
• 2004-SOD-A: After the study to update the potential seismic hazards has been finalized, evaluate the need to perform additional investigations and dynamic analyses
7

Scoggins Dam – 2010 IE
• 2010 Issue Evaluation (IE) studies included the following activities:– Updated PSHA and development of ground motions– Extensive field program– Evaluation of in situ and laboratory testing– Detailed engineering analyses– Facilitated, team risk analysis
8

Seismic Loading• Increments were chosen to bracket the 5 return periods
developed in the ground motion study
9
Basic Return Period
Loading Increment Probability of Load
Approximate Ground Motion
Range
< 300-yr 99.667 % < .23g
500-yr 300- to 800-yr 0.208 % .23 to .42g
1,000-yr 800- to 3,000-yr 0.092 % .42 to .76g
5,000-yr 3,000- to 8,000-yr 0.021 % .76 to 1.05g
10,000-yr 8,000- to 25,000-yr 0.008 % 1.05 to 1.42g
50,000-yr > 25,000-yr 0.004 % > 1.42g
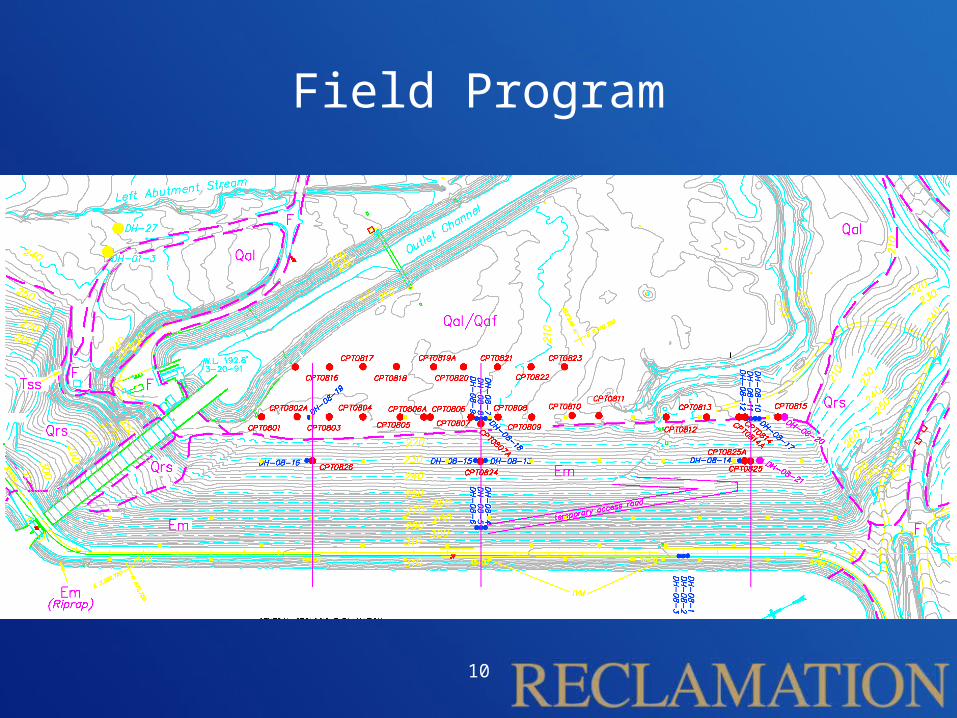
Field Program
10
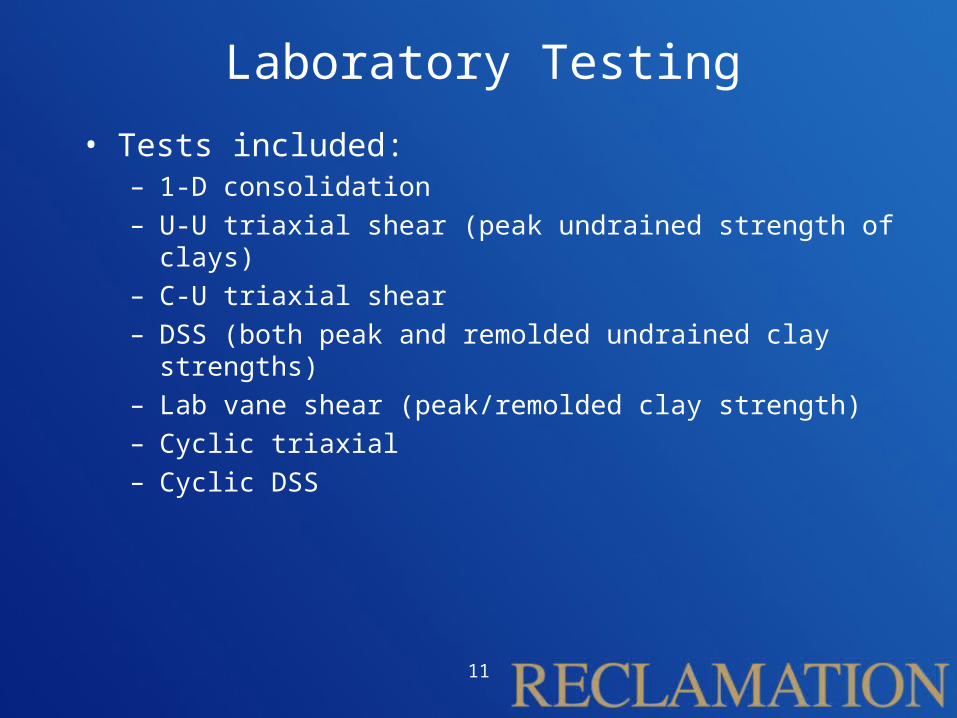
Laboratory Testing
• Tests included:– 1-D consolidation – U-U triaxial shear (peak undrained strength of clays)– C-U triaxial shear– DSS (both peak and remolded undrained clay strengths)– Lab vane shear (peak/remolded clay strength)– Cyclic triaxial– Cyclic DSS
11
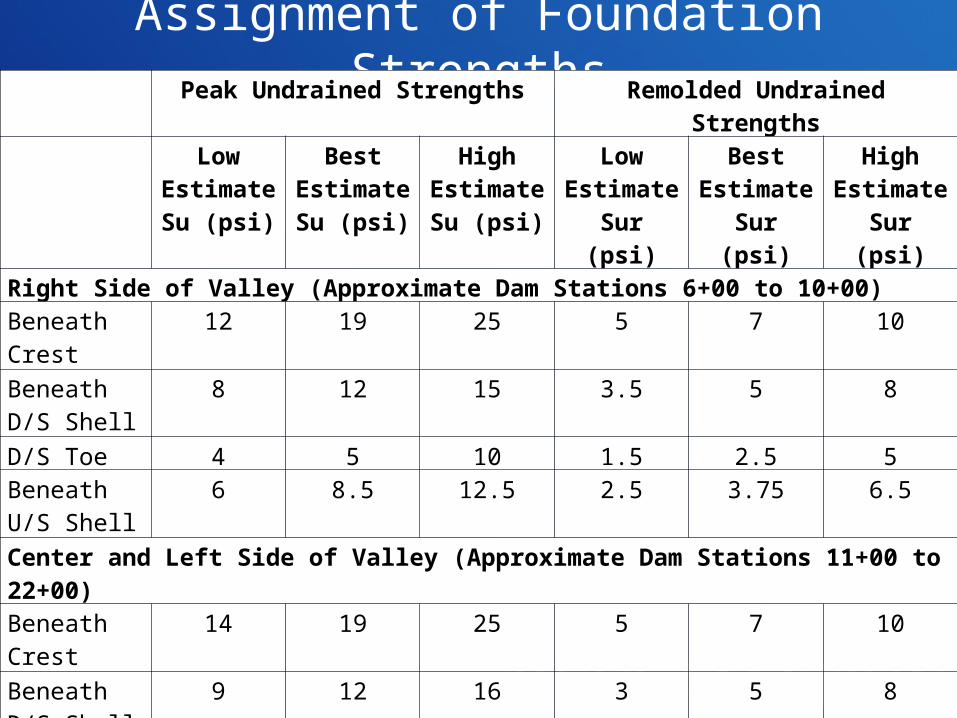
Assignment of Foundation Strengths
12
Peak Undrained Strengths Remolded Undrained StrengthsLow
Estimate Su (psi)
Best Estimate Su (psi)
High Estimate Su (psi)
Low Estimate Sur (psi)
Best Estimate Sur (psi)
High Estimate Sur (psi)
Right Side of Valley (Approximate Dam Stations 6+00 to 10+00)Beneath Crest
12 19 25 5 7 10
Beneath D/S Shell
8 12 15 3.5 5 8
D/S Toe 4 5 10 1.5 2.5 5Beneath U/S Shell
6 8.5 12.5 2.5 3.75 6.5
Center and Left Side of Valley (Approximate Dam Stations 11+00 to 22+00)Beneath Crest
14 19 25 5 7 10
Beneath D/S Shell
9 12 16 3 5 8
Beneath U/S Shell
9 12 16 3 5 8

“Squashed Dam” Results
13

FLAC Analyses
14
FLAC (Version 6.00)
LEGEND
13-Nov-09 15:28 step 2079824Dynamic Time 3.6000E+01 7.552E+01 <x< 1.470E+03 -4.313E+02 <y< 9.634E+02
Exaggerated Grid DistortionMagnification = 1.000E+00Max Disp = 7.035E+01Exaggerated Boundary Disp.
Magnification = 0.000E+00Max Disp = 7.005E+01Max. shear strain increment 0.00E+00 1.00E+00 2.00E+00 3.00E+00 4.00E+00 5.00E+00 6.00E+00 7.00E+00
Contour interval= 1.00E+00Extrap. by averaging
-3.000
-1.000
1.000
3.000
5.000
7.000
9.000
(*10^2)
0.200 0.400 0.600 0.800 1.000 1.200 1.400(*10^3)
JOB TITLE : 50k-bbl, Low Sur, Sta 9+00

Most Plausible/Critical Embankment PFMs
• Dam overtopping due to slope failures caused by significant strength loss in foundation soils
• Dam overtopping due to Newmark-type displacements (without significant strength loss in foundation soils)
• Internal erosion resulting from cracking due to partial slope failures caused by significant strength loss in foundation soils
• Internal erosion due to cracking caused by Newmark-type displacements (without significant strength loss in foundation soils)
15
16
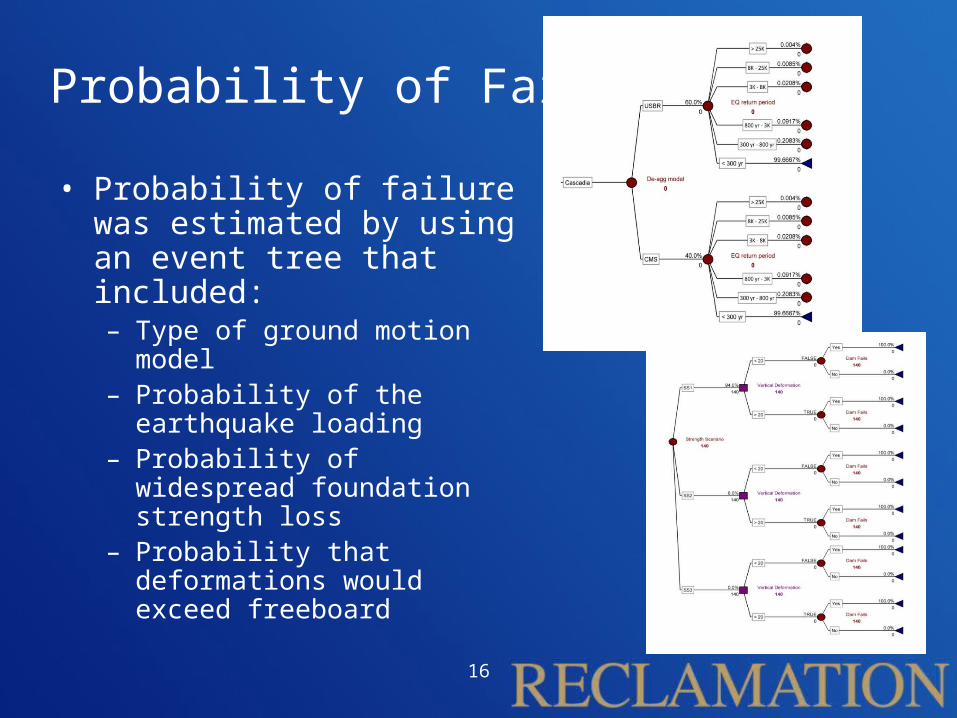
Probability of Failure
• Probability of failure was estimated by using an event tree that included: – Type of ground motion model– Probability of the earthquake
loading– Probability of widespread
foundation strength loss– Probability that deformations
would exceed freeboard

Predicted Deformations (CSZ EQ)
17
Expected Deformation (feet of Vertical Crest Loss) - Cascadia Subduction Zone Earthquake using USBR approach
Load Increment Type of Estimate SS1 SS2 SS3
300-yr to 800-yrUpper Bound 60* 5* 4*
Best Estimate 33* 3* 2*
Lower Bound 10* 1* 1*
800-yr to 3,000-yrUpper Bound 70 35 12
Best Estimate 40 20 5
Lower Bound 10 5 2
3,000-yr to 8,000-yrUpper Bound 75 50 35
Best Estimate 45 30 20
Lower Bound 20 10 5
8,000-yr to 25,000-yrUpper Bound 75 60 50
Best Estimate 45 35 25
Lower Bound 20 15 7
> 25,000-yrUpper Bound 75 65 60
Best Estimate 45 40 30
Lower Bound 20 15 12
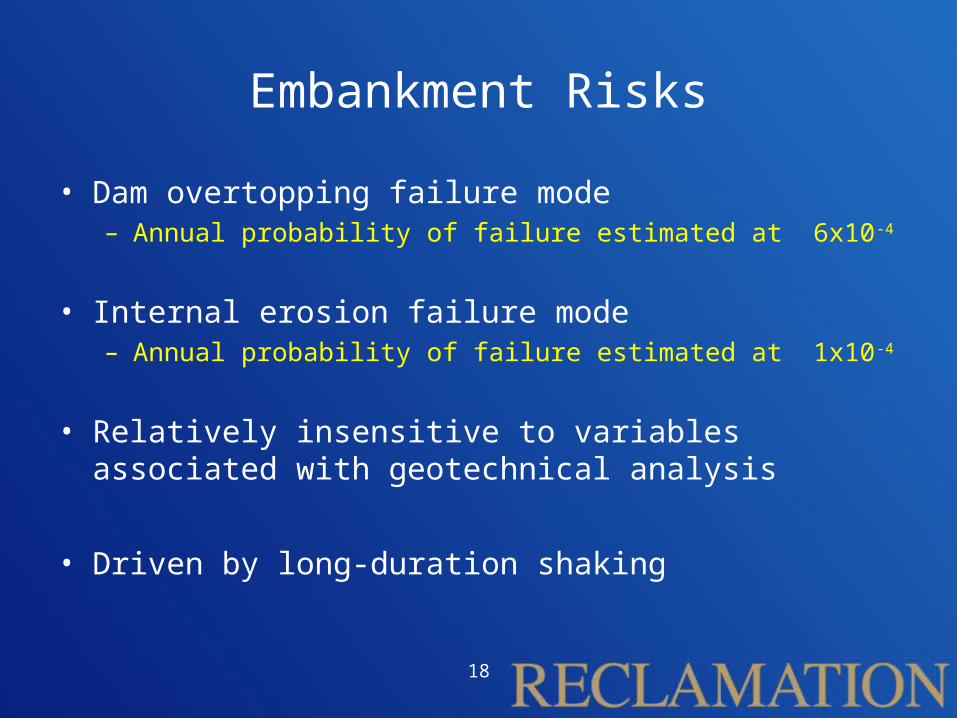
Embankment Risks
• Dam overtopping failure mode– Annual probability of failure estimated at 6x10⁻⁴
• Internal erosion failure mode– Annual probability of failure estimated at 1x10⁻⁴
• Relatively insensitive to variables associated with geotechnical analysis
• Driven by long-duration shaking
18
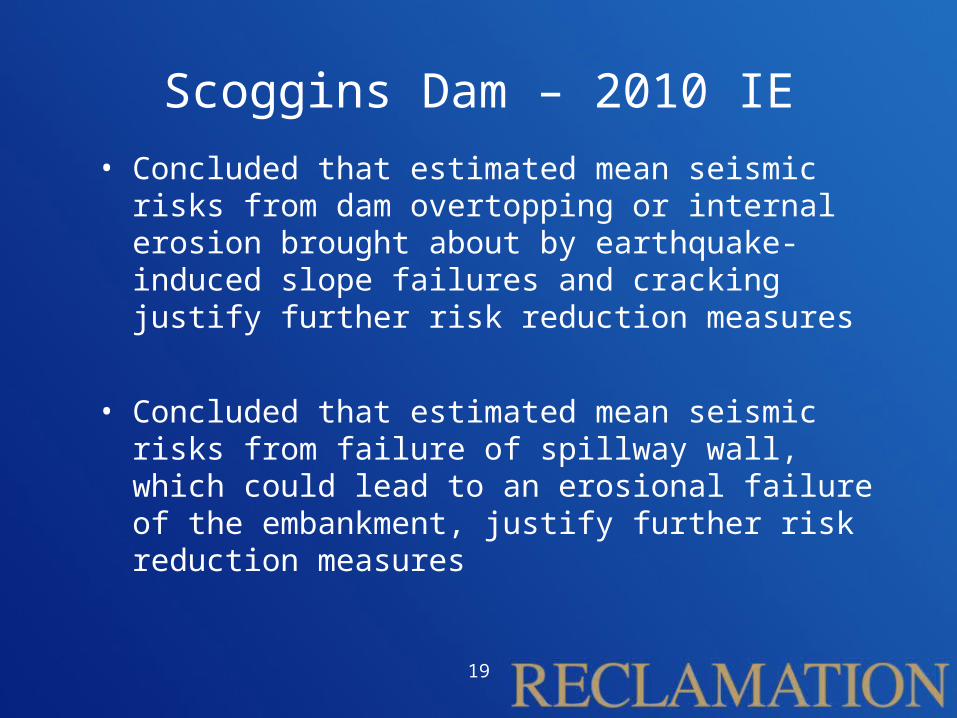
Scoggins Dam – 2010 IE
• Concluded that estimated mean seismic risks from dam overtopping or internal erosion brought about by earthquake-induced slope failures and cracking justify further risk reduction measures
• Concluded that estimated mean seismic risks from failure of spillway wall, which could lead to an erosional failure of the embankment, justify further risk reduction measures
19

Questions ?
20