Embed Size (px)
Citation preview

11
Seasonal variations ofthe muon flux seen by
the muon detector BUST
1Institute of Terrestrial Magnetism, Ionosphere and Radiowave Propagation RAN of N.V. Pushkov (IZMIRAN), Troitsk, MR, RU-142190, Russia2Instutute for Nuclear Research, 60th Oct. Anniversaryprospects 7A, Moscow, RU-117 312, Russia
M.Berkova1, V. Petkov2, M.Kostyuk2, R. Novoseltseva2, Yu. Novoseltsev2, P. Striganov2, M. Boliev2, V.Yanke1
ID 0751

22
Further development of the methods of temperature effect excluding from the cosmic ray muon component using the model temperature data
To exclude the temperature effect from the data of the Baksan underground muon scintillation telescope (BUST) (Rc ~ 5,6 GV) for 2009-2010 by the effective temperature method using the model temperature data.
To determine temperature coefficients for the BUST for this period.
Our goals
Abstract: According to the Baksan underground muon telescope (BUST) for the period 2009-2010 it was established a correlation between variations of the muon flux of the energy > 220 GeV at the observation level and variations of the atmosphere temperature profile. The obtained temperature coefficients were compared with the results from other authors. For the analysis, the vertical temperature profile of the atmosphere obtained according to the atmosphere model was used. The temperature effect was excluded from the hourly BUST data for 2009-2010.
3
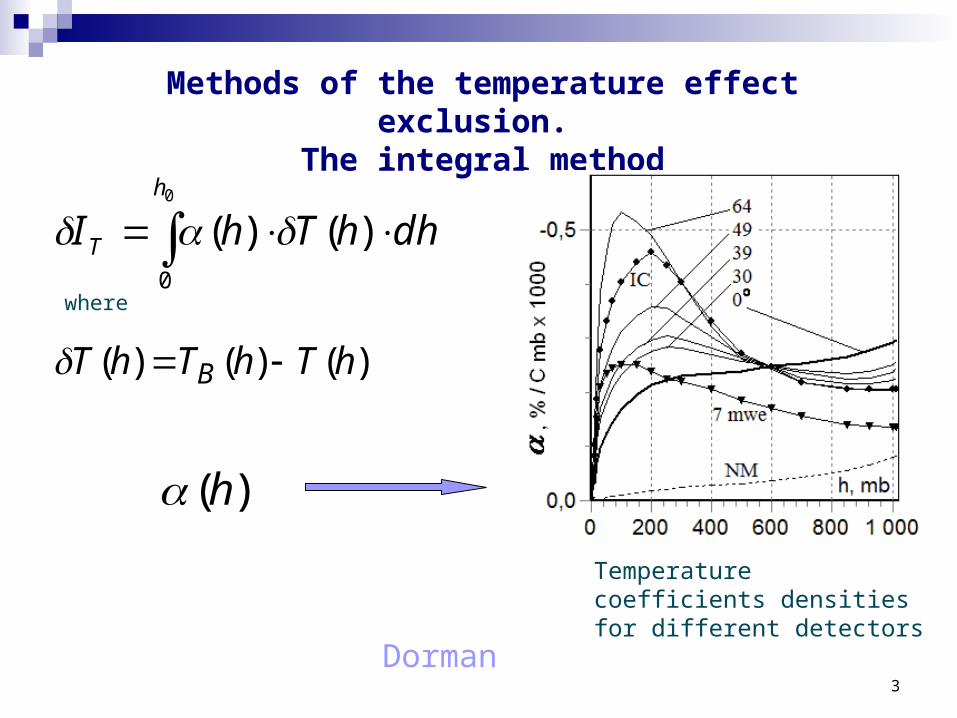
Methods of the temperature effect exclusion. The integral method
0
0
)()(h
T dhhThI
Temperature coefficients densities for different detectors
)()()( hThThT B
where
)(h
Dorman

4
Methods of the temperature effect exclusion. The method of effective level of generation
where
THI THT
HT
The method is based on the assumption that muons are generally generated at the isobaric level usually taking for 100 mb , and its height is changing with change of the atmosphere temperature.
decay coefficient (%/km) – negative effect
positive temperature coefficient (%/C)
The height of isobaric level 100 mb: is determined via measuring; is calculated with the barometric formula, if it is known the height distribution T(h) )
)(exp(
0
0 H
hT
dh
R
gPP
Duperier

5
Methods of the temperature effect exclusion.The method of mass-average temperature
T
The method of mass-average temperature is based on the assumption that the temperature coefficient densities are changed in a small way with the atmosphere depth h (just for the ground-based detectors)
mass-average temperature
temperature coefficient
0
0
)(h
mT TdhhTI
mT
6
0
0
)()(h
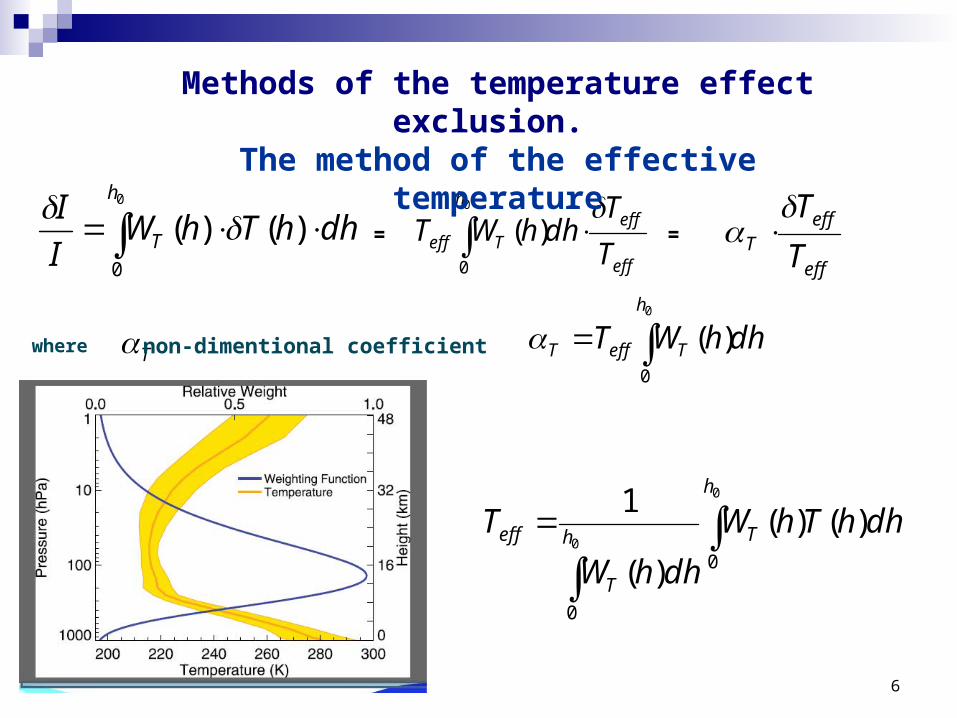
T dhhThWI
I =
eff
effh
Teff T
TdhhWT
0
0
)(eff
effT T
T =
where T non-dimentional coefficient dhhWTh
TeffT 0
0
)(
0
0
0
0
)()(
)(
1h
Th
T
eff dhhThW
dhhW
T
Methods of the temperature effect exclusion. The method of the effective temperature
7
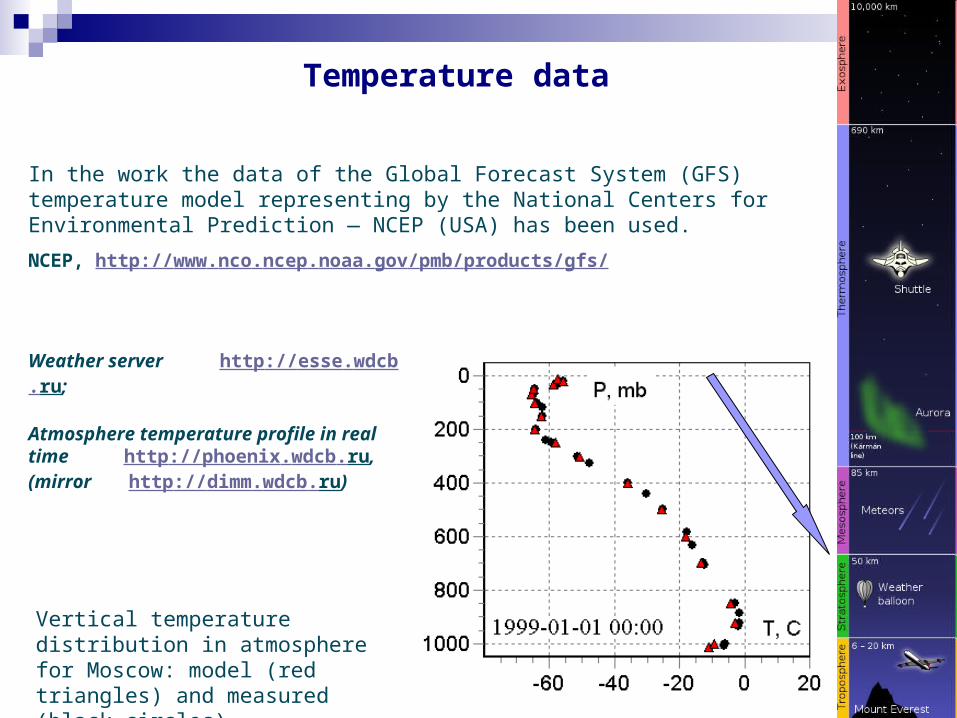
In the work the data of the Global Forecast System (GFS) temperature model representing by the National Centers for Environmental Prediction — NCEP (USA) has been used.
NCEP, http://www.nco.ncep.noaa.gov/pmb/products/gfs/
Temperature data
Vertical temperature distribution in atmosphere for Moscow: model (red triangles) and measured (black circles)
Weather server http://esse.wdcb.ru;
Atmosphere temperature profile in real time http://phoenix.wdcb.ru, (mirror http://dimm.wdcb.ru)

8
The model output data are temperature at the 17 isobaric levels: observation level, 1000, 925, 850, 700, 500, 400, 300, 250, 200, 150, 100, 70, 50, 30, 20, 10 hPa for four times 00, 06, 12 and 18 hours every day. The data are interpolated on the grid of 1°x1° resolution. To obtain hourly data the interpolation by the cubic spline function on five nodal points is carried out. A query about temperature distribution is carried out at the beginning of every day, realizing the forecast for current day. The accuracy of these models is about one degree for all isobaric levels and several degrees for the ground level.
Comparison of experimental and model temperature data in the surface layer for Moscow station.
Analysis shows that remainder distribution of the experimental data and the model data is approximately governed by the Gaussian distribution with good enough value of σ=0.26 Сº. The most error should be expected for the observation level as the temperature is more changeable in the lower layer. So, for the remainder of the hourly experimental and model data in the surface layer for Moscow σ=2.8 Сº.
Temperature data

99
BUST
The Baksan Underground Scintillation Detector of the Institute for Nuclear Research RAS is located in the Caucasus mountains (43.28o N and 42.69o E) inside the mine of 24×24×16 m3 under the Andyrcha mountain. There is 350 m of rock vertical depth (850 mwe) over the telescope. The BUST is parallelepiped of 16.7×16.7×11.1 m3 consisting of 8 planes (4 inner and 4 outer) of detectors (each of 70×70×30 сm3) with liquid scintillater. The range of measuring energies in one detector is 0.5-500 GeV. The muon threshold energy is 220 GeV. The observatory level is 1700 m above sea level, average pressure is 820 mb.
10
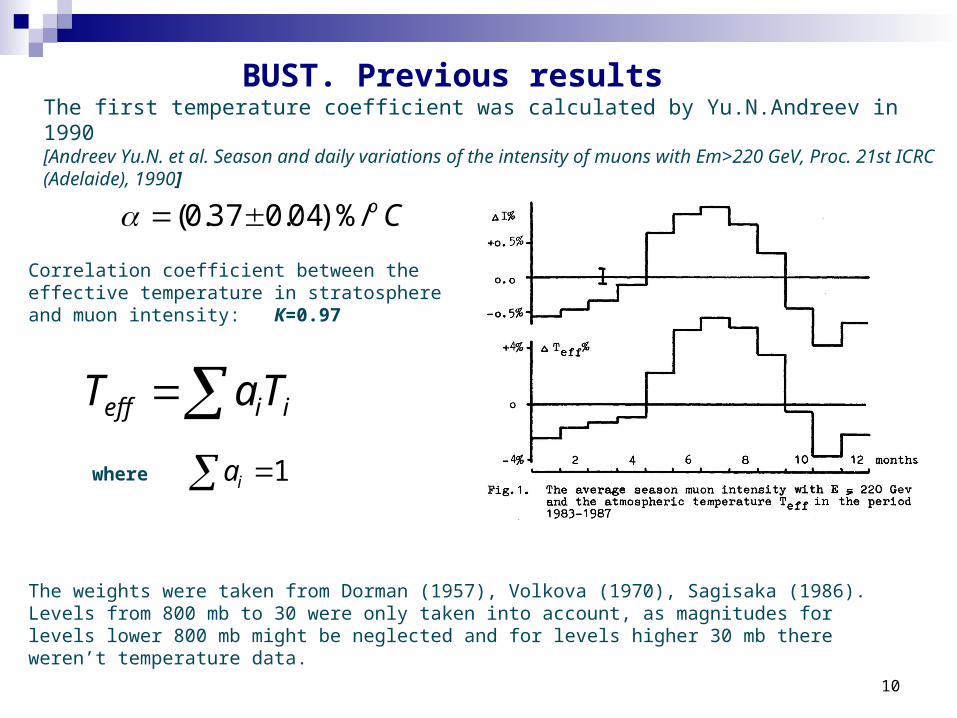
Correlation coefficient between the effective temperature in stratosphere and muon intensity: К=0.97
The weights were taken from Dorman (1957), Volkova (1970), Sagisaka (1986). Levels from 800 mb to 30 were only taken into account, as magnitudes for levels lower 800 mb might be neglected and for levels higher 30 mb there weren’t temperature data.
Co/)%04.037.0(
iieff TaT
where 1 ia
The first temperature coefficient was calculated by Yu.N.Andreev in 1990 [Andreev Yu.N. et al. Season and daily variations of the intensity of muons with Em>220 GeV, Proc. 21st ICRC (Adelaide), 1990]
BUST. Previous results
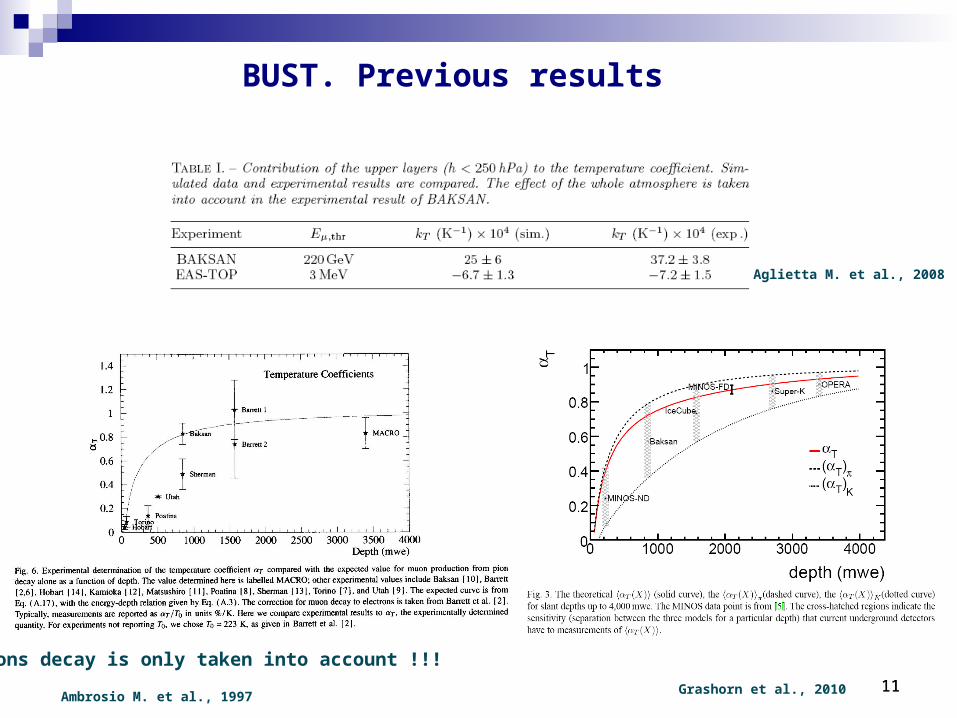
1111Ambrosio M. et al., 1997
Pions decay is only taken into account !!!
Grashorn et al., 2010
Aglietta M. et al., 2008
BUST. Previous results

12
0
0
0
0
)()(
)(
1h
Th
T
eff dhhThW
dhhW
T
BUST. Temperature coefficient densities
For WT(h) an approximation may be used
(Gaisser, 1990)
)()( // NhhT ee
hchW
,
WT(h) for muons with E >200 GeV (red line)
and for infinitely great energies (black curve)
)/( NN
where pions and nucleons free path
2/160 cmg
2/120 cmgN
13
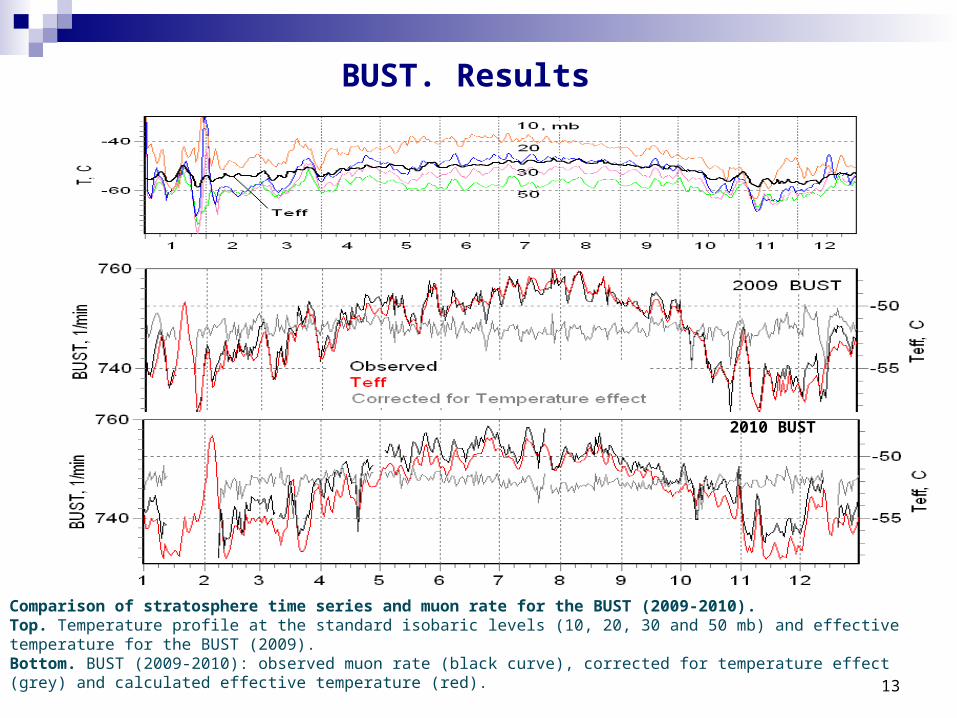
BUST. Results
Comparison of stratosphere time series and muon rate for the BUST (2009-2010).Top. Temperature profile at the standard isobaric levels (10, 20, 30 and 50 mb) and effective temperature for the BUST (2009) .Bottom. BUST (2009-2010): observed muon rate (black curve), corrected for temperature effect (grey) and calculated effective temperature (red).
2010 BUST

14
Temperature coefficients for the BUST
BUST. Results

15
BUST. Results
Correlation between observed and calculated temperature variations for the BUST
16
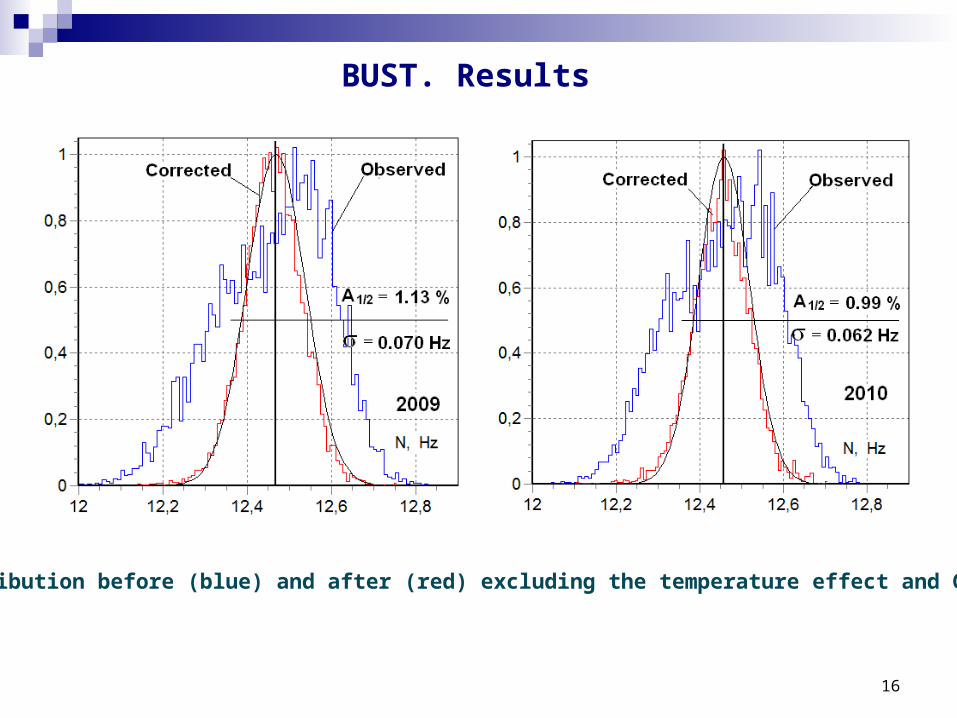
BUST. Results
Distribution before (blue) and after (red) excluding the temperature effect and Gauss
17
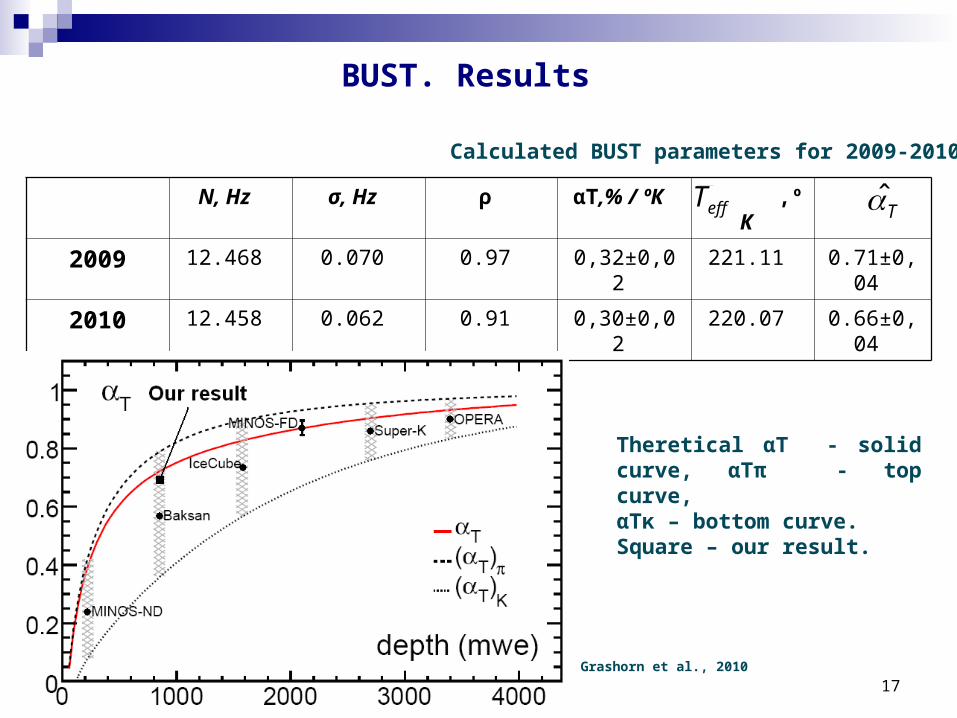
BUST. Results
Calculated BUST parameters for 2009-2010
N, Hz σ, Hz ρ αT,% / ºК ,ºК
2009 12.468 0.070 0.97 0,32±0,02 221.11 0.71±0,04
2010 12.458 0.062 0.91 0,30±0,02 220.07 0.66±0,04
effT T̂
Theretical αT - solid curve, αTπ - top curve, αTκ – bottom curve. Square – our result.
Grashorn et al., 2010

18
Conclusions
1) The model data of the vertical temperature profile and used method of the temperature variations determination (the effective temperature method) make it possible to exclude the temperature effect with proper accuracy .
2) There is a good positive correlation between muon rate variations and effective temperature change that makes it possible to obtain the value of the temperature coefficient. The average temperature coefficients for 2009-2010 are αT=(0.31±0.04) %/ºK and =0.69±0,04.
3) The obtained in this work temperature coefficients are in good agreement with previous results for the BUST.