Embed Size (px)
Citation preview
1
Section 1: Minnesota Health Care Spending and Cost Drivers
• Minnesota health care spending by source of funds
• Minnesota health care spending by type of service
• Minnesota/U.S. health care spending comparisons
• Minnesota private market trends: premiums, spending, and cost drivers

MINNESOTA HEALTH CARE SPENDING BY SOURCE OF FUNDS
3
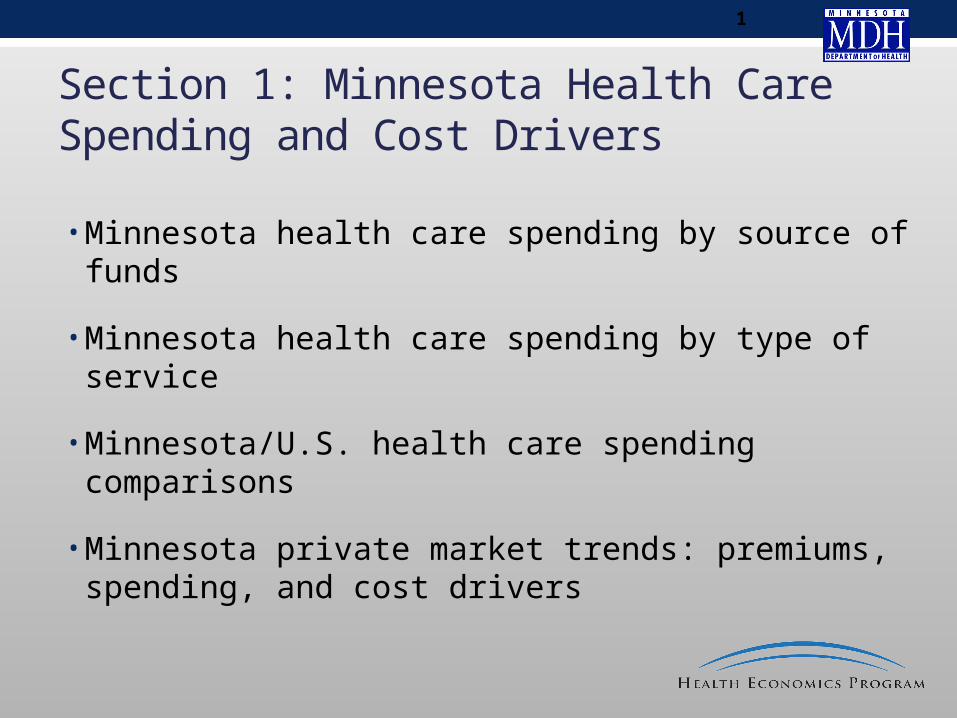
Minnesota Health Care Spending by Source of Funds, 2012
Total Spending $39.8 Billion
Other Public Spending**6.0%
Medicare19.1%
Medical Assistance21.0%
Other Private*2.5%
Out-of-Pocket12.4%
Private Health Insurance38.9%
*Other major private payers include, private worker’s compensation and auto medical insurance.**Major components of other public spending are MinnesotaCare, government workers’ compensation and Veterans Administration.Source: MDH Health Economics Program
4
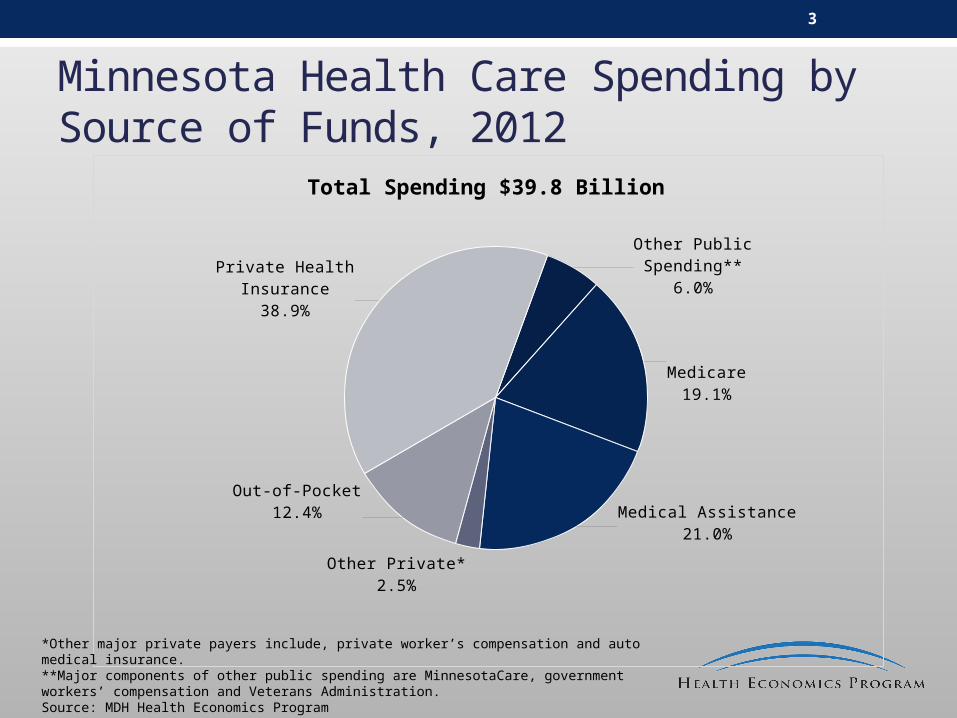
Minnesota Health Spending by Source of Funds, 2008 to 2012
Millions of Dollars
2008 2009 2010 2011 2012
Public Spending, Total $14,901 $16,054 $16,785 $17,571 $18,398
Medicare $6,165 $6,564 $6,887 $7,158 $7,626
Medicaid $6,543 $7,006 $7,322 $8,047 $8,374
Other Public Spending $2,193 $2,484 $2,575 $2,366 $2,398
Private Spending, Total $20,598 $20,909 $20,769 $20,729 $21,425
Private Health Insurance $14,884 $15,155 $15,149 $15,015 $15,491
Out-of-Pocket $4,775 $4,779 $4,657 $4,749 $4,932
Other Private $939 $975 $963 $966 $1,002
Total $35,500 $36,963 $37,554 $38,301 $39,823
Note: Detail may not sum to total due to rounding. Revisions to historic time series may lead to slight variation from previously published estimates.Source: MDH Health Economics Program
5
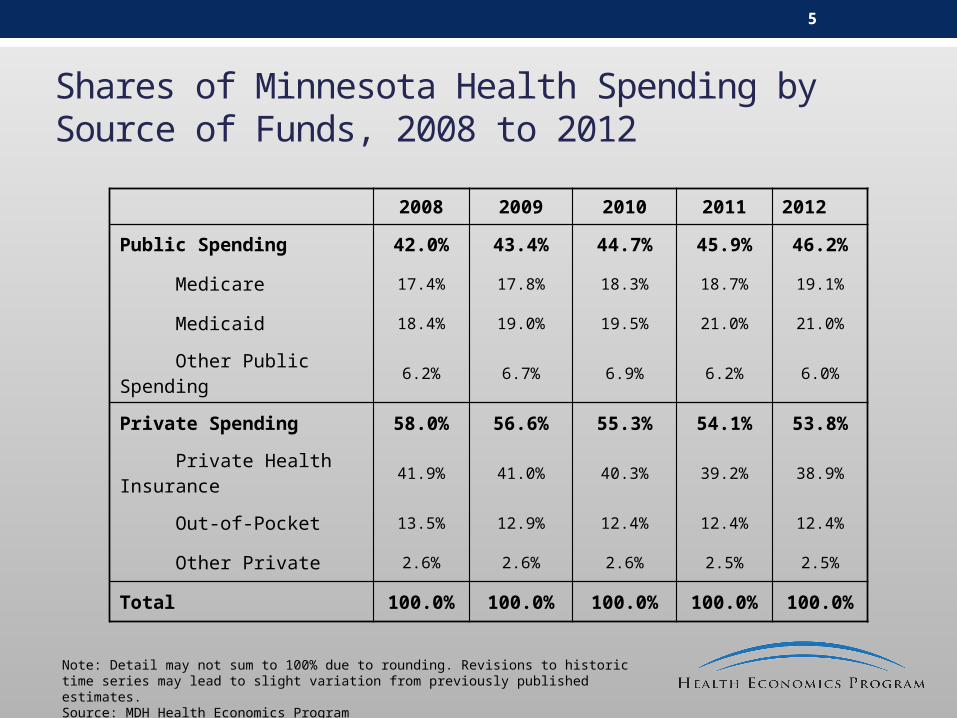
Shares of Minnesota Health Spending by Source of Funds, 2008 to 2012
2008 2009 2010 2011 2012
Public Spending 42.0% 43.4% 44.7% 45.9% 46.2%
Medicare 17.4% 17.8% 18.3% 18.7% 19.1%
Medicaid 18.4% 19.0% 19.5% 21.0% 21.0%
Other Public Spending 6.2% 6.7% 6.9% 6.2% 6.0%
Private Spending 58.0% 56.6% 55.3% 54.1% 53.8%
Private Health Insurance 41.9% 41.0% 40.3% 39.2% 38.9%
Out-of-Pocket 13.5% 12.9% 12.4% 12.4% 12.4%
Other Private 2.6% 2.6% 2.6% 2.5% 2.5%
Total 100.0% 100.0% 100.0% 100.0% 100.0%
Note: Detail may not sum to 100% due to rounding. Revisions to historic time series may lead to slight variation from previously published estimates. Source: MDH Health Economics Program
6
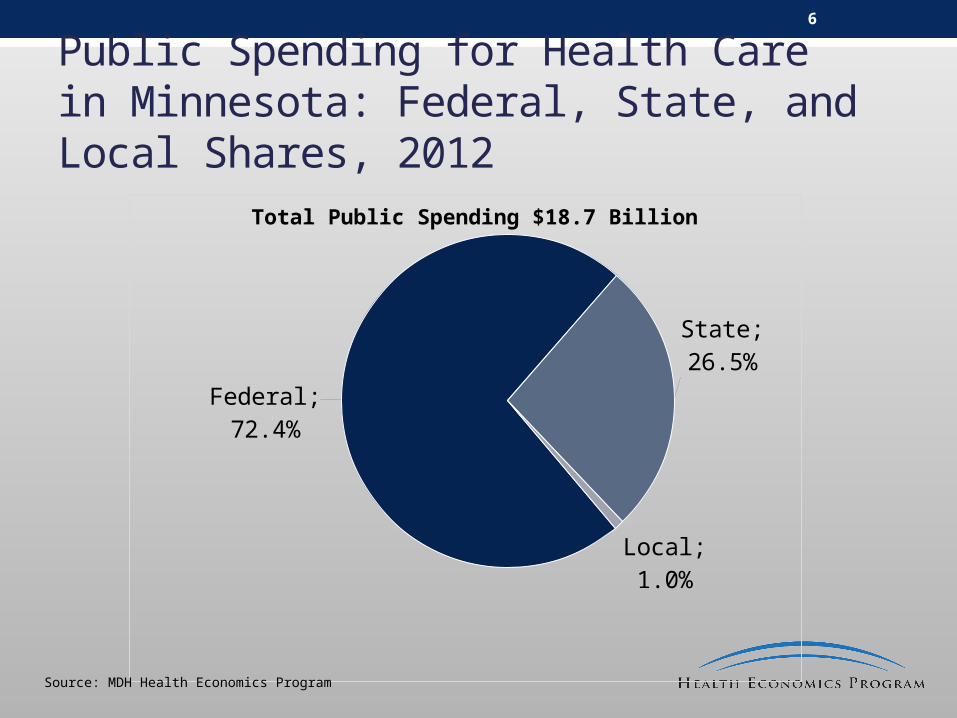
Public Spending for Health Care in Minnesota: Federal, State, and Local Shares, 2012
Total Public Spending $18.7 Billion
Federal; 72.4%
State; 26.5%
Local; 1.0%
Source: MDH Health Economics Program
7
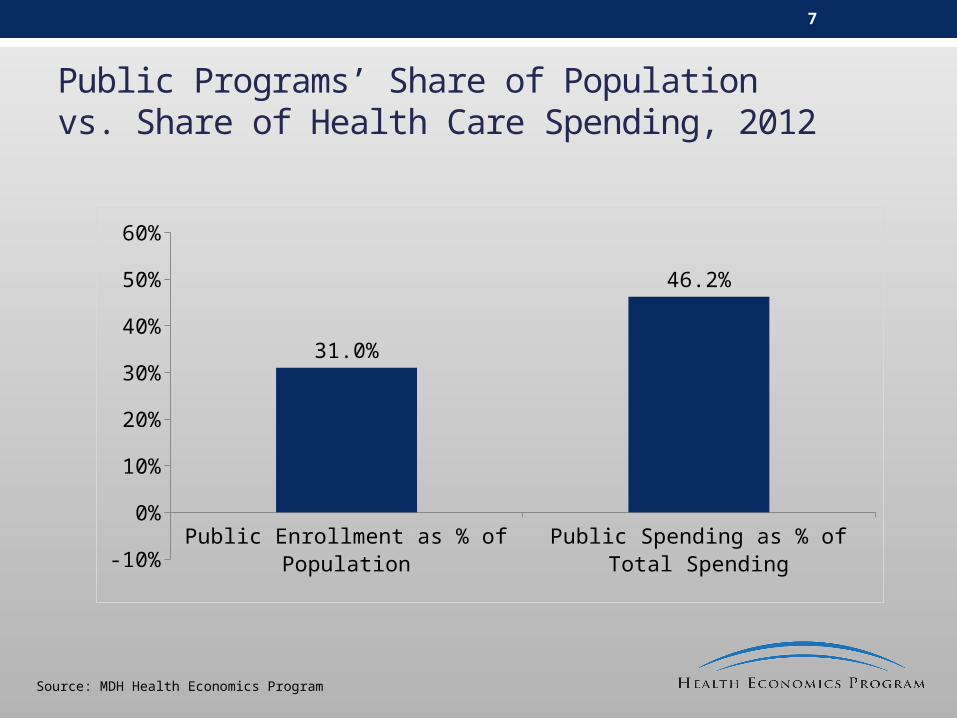
Public Programs’ Share of Population vs. Share of Health Care Spending, 2012
Public Enrollment as % of Popula-tion
Public Spending as % of Total Spending-10%
0%
10%
20%
30%
40%
50%
60%
31.0%
46.2%
Source: MDH Health Economics Program
8
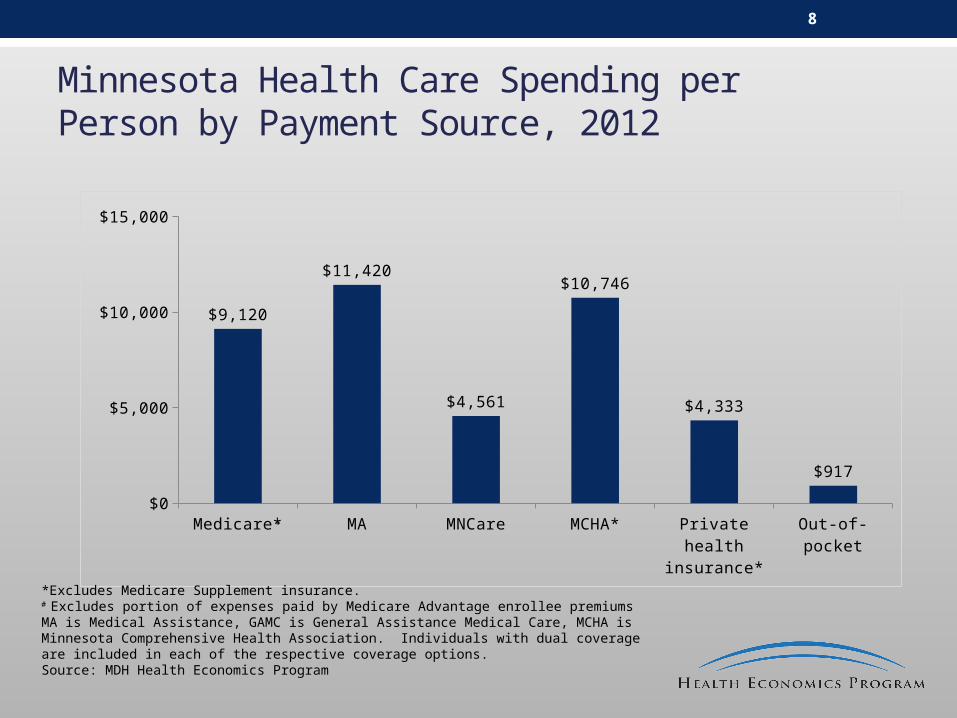
Minnesota Health Care Spending per Person by Payment Source, 2012
Medicare* MA MNCare MCHA* Private health insurance*
Out-of-pocket$0
$5,000
$10,000
$15,000
$9,120
$11,420
$4,561
$10,746
$4,333
$917
#
*Excludes Medicare Supplement insurance. # Excludes portion of expenses paid by Medicare Advantage enrollee premiumsMA is Medical Assistance, GAMC is General Assistance Medical Care, MCHA is Minnesota Comprehensive Health Association. Individuals with dual coverage are included in each of the respective coverage options.Source: MDH Health Economics Program
9
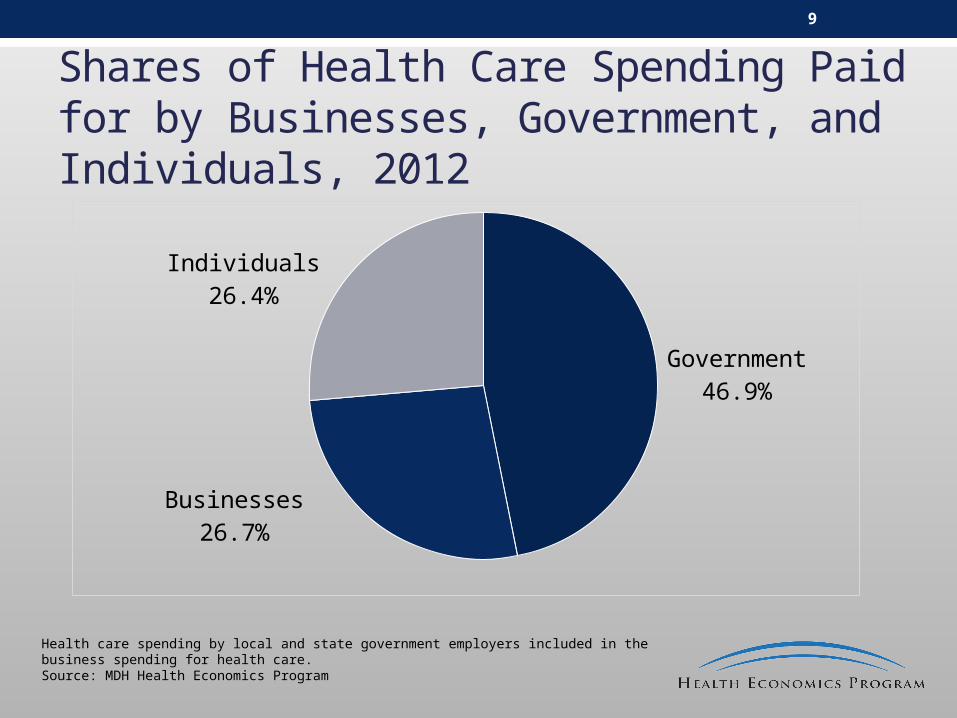
Shares of Health Care Spending Paid for by Businesses, Government, and Individuals, 2012
Government46.9%
Businesses26.7%
Individuals26.4%
Health care spending by local and state government employers included in the business spending for health care.Source: MDH Health Economics Program

MINNESOTA HEALTH CARE SPENDING BY TYPE OF SERVICE
11
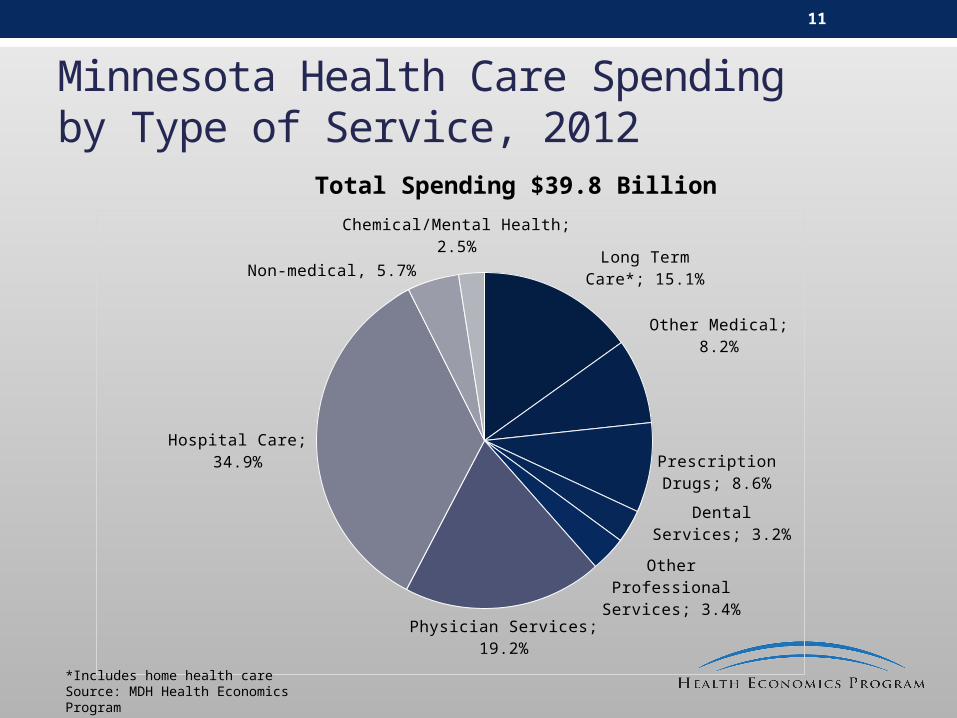
Minnesota Health Care Spending by Type of Service, 2012
Total Spending $39.8 Billion
Long Term Care*; 15.1%
Other Medical; 8.2%
Prescription Drugs; 8.6%
Dental Services; 3.2%
Other Professional Services; 3.4%
Physician Services; 19.2%
Hospital Care; 34.9%
Non-medical, 5.7%
Chemical/Mental Health; 2.5%
*Includes home health careSource: MDH Health Economics Program
12
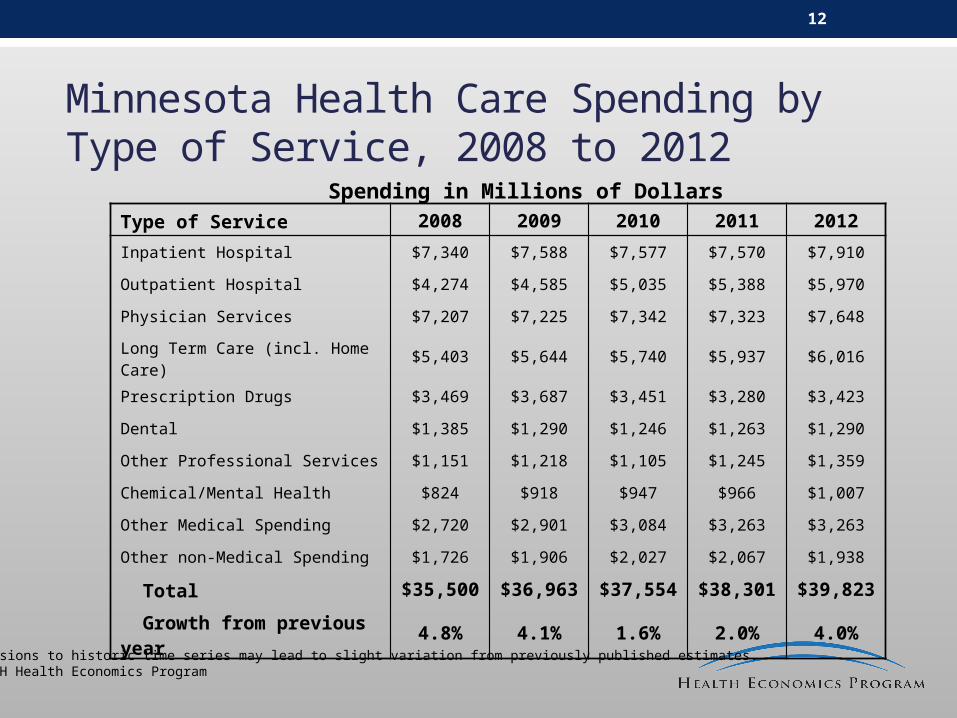
Minnesota Health Care Spending by Type of Service, 2008 to 2012
Spending in Millions of DollarsType of Service 2008 2009 2010 2011 2012
Inpatient Hospital $7,340 $7,588 $7,577 $7,570 $7,910
Outpatient Hospital $4,274 $4,585 $5,035 $5,388 $5,970
Physician Services $7,207 $7,225 $7,342 $7,323 $7,648
Long Term Care (incl. Home Care) $5,403 $5,644 $5,740 $5,937 $6,016
Prescription Drugs $3,469 $3,687 $3,451 $3,280 $3,423
Dental $1,385 $1,290 $1,246 $1,263 $1,290
Other Professional Services $1,151 $1,218 $1,105 $1,245 $1,359
Chemical/Mental Health $824 $918 $947 $966 $1,007
Other Medical Spending $2,720 $2,901 $3,084 $3,263 $3,263
Other non-Medical Spending $1,726 $1,906 $2,027 $2,067 $1,938
Total $35,500 $36,963 $37,554 $38,301 $39,823
Growth from previous year 4.8% 4.1% 1.6% 2.0% 4.0%
Note: Revisions to historic time series may lead to slight variation from previously published estimates. Source: MDH Health Economics Program
13
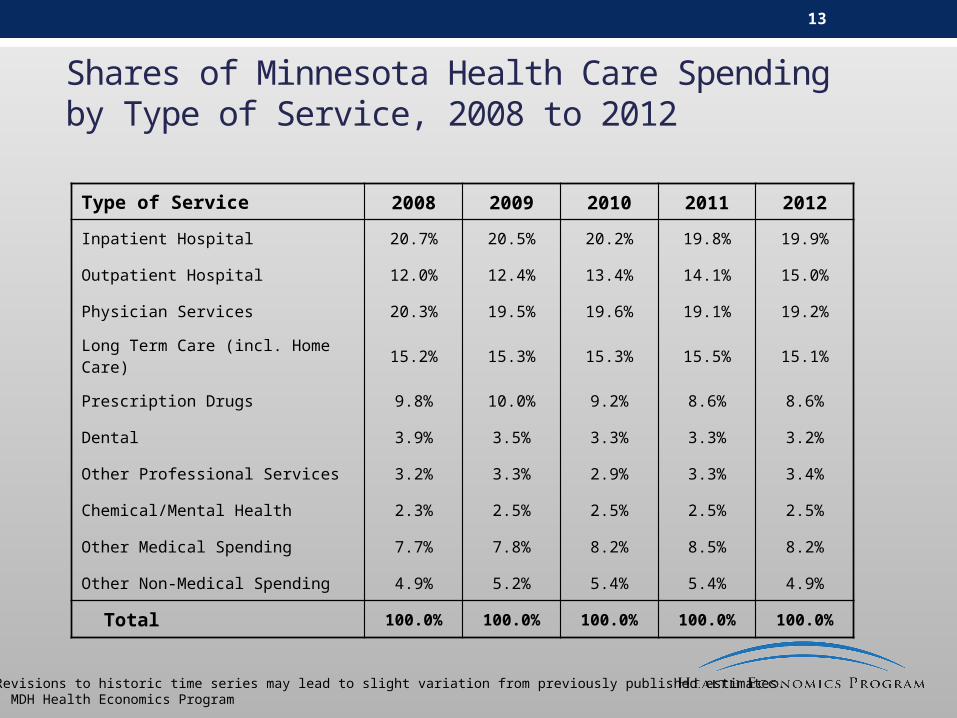
Shares of Minnesota Health Care Spending by Type of Service, 2008 to 2012
Type of Service 2008 2009 2010 2011 2012
Inpatient Hospital 20.7% 20.5% 20.2% 19.8% 19.9%
Outpatient Hospital 12.0% 12.4% 13.4% 14.1% 15.0%
Physician Services 20.3% 19.5% 19.6% 19.1% 19.2%
Long Term Care (incl. Home Care) 15.2% 15.3% 15.3% 15.5% 15.1%
Prescription Drugs 9.8% 10.0% 9.2% 8.6% 8.6%
Dental 3.9% 3.5% 3.3% 3.3% 3.2%
Other Professional Services 3.2% 3.3% 2.9% 3.3% 3.4%
Chemical/Mental Health 2.3% 2.5% 2.5% 2.5% 2.5%
Other Medical Spending 7.7% 7.8% 8.2% 8.5% 8.2%
Other Non-Medical Spending 4.9% 5.2% 5.4% 5.4% 4.9%
Total 100.0% 100.0% 100.0% 100.0% 100.0%
Note: Revisions to historic time series may lead to slight variation from previously published estimates. Source: MDH Health Economics Program
14
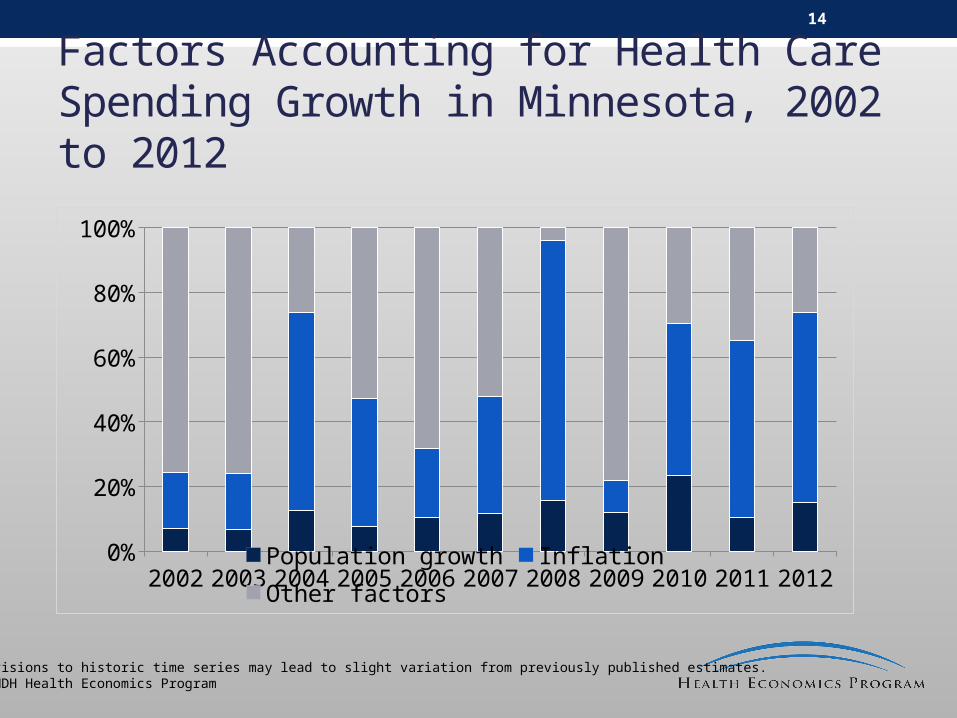
Factors Accounting for Health Care Spending Growth in Minnesota, 2002 to 2012
2002 2003 2004 2005 2006 2007 2008 2009 2010 2011 20120%
10%20%30%40%50%60%70%80%90%
100%
Population growth Inflation Other factors
Note: Revisions to historic time series may lead to slight variation from previously published estimates. Source: MDH Health Economics Program
MINNESOTA/U.S. HEALTH CARE SPENDING COMPARISONS
16
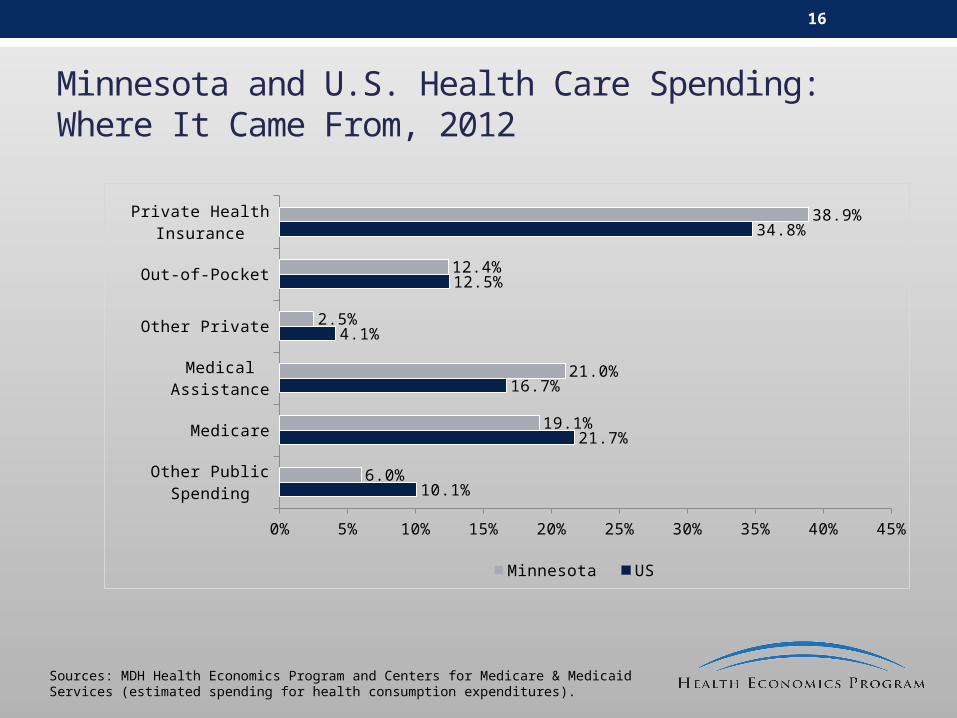
Minnesota and U.S. Health Care Spending:Where It Came From, 2012
Other Public Spending
Medicare
Medical Assistance
Other Private
Out-of-Pocket
Private Health Insurance
0% 5% 10% 15% 20% 25% 30% 35% 40% 45%
10.1%
21.7%
16.7%
4.1%
12.5%
34.8%
6.0%
19.1%
21.0%
2.5%
12.4%
38.9%
Minnesota US
Sources: MDH Health Economics Program and Centers for Medicare & Medicaid Services (estimated spending for health consumption expenditures).
17
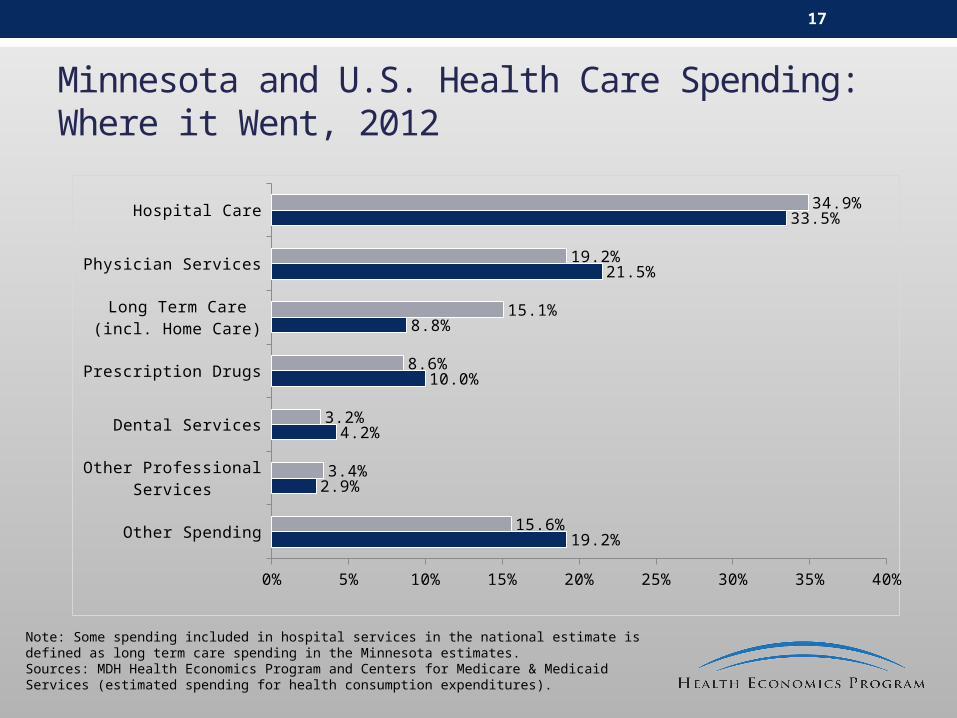
Minnesota and U.S. Health Care Spending: Where it Went, 2012
Other Spending
Other Professional Services
Dental Services
Prescription Drugs
Long Term Care (incl. Home Care)
Physician Services
Hospital Care
0% 5% 10% 15% 20% 25% 30% 35% 40%
19.2%
2.9%
4.2%
10.0%
8.8%
21.5%
33.5%
15.6%
3.4%
3.2%
8.6%
15.1%
19.2%
34.9%
Minnesota U.S.
Note: Some spending included in hospital services in the national estimate is defined as long term care spending in the Minnesota estimates.Sources: MDH Health Economics Program and Centers for Medicare & Medicaid Services (estimated spending for health consumption expenditures).
18
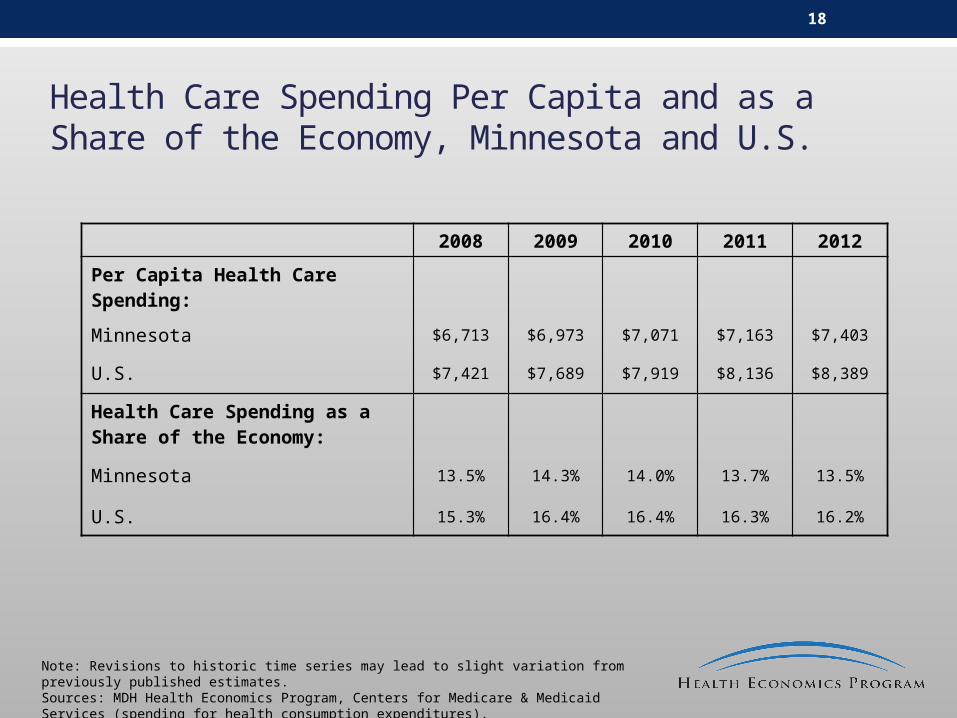
Health Care Spending Per Capita and as a Share of the Economy, Minnesota and U.S.
2008 2009 2010 2011 2012
Per Capita Health Care Spending:
Minnesota $6,713 $6,973 $7,071 $7,163 $7,403
U.S. $7,421 $7,689 $7,919 $8,136 $8,389
Health Care Spending as a Share of the Economy:
Minnesota 13.5% 14.3% 14.0% 13.7% 13.5%
U.S. 15.3% 16.4% 16.4% 16.3% 16.2%
Note: Revisions to historic time series may lead to slight variation from previously published estimates. Sources: MDH Health Economics Program, Centers for Medicare & Medicaid Services (spending for health consumption expenditures).

MINNESOTA PRIVATE MARKET TRENDS: PREMIUMS, SPENDING, AND COST DRIVERS
20
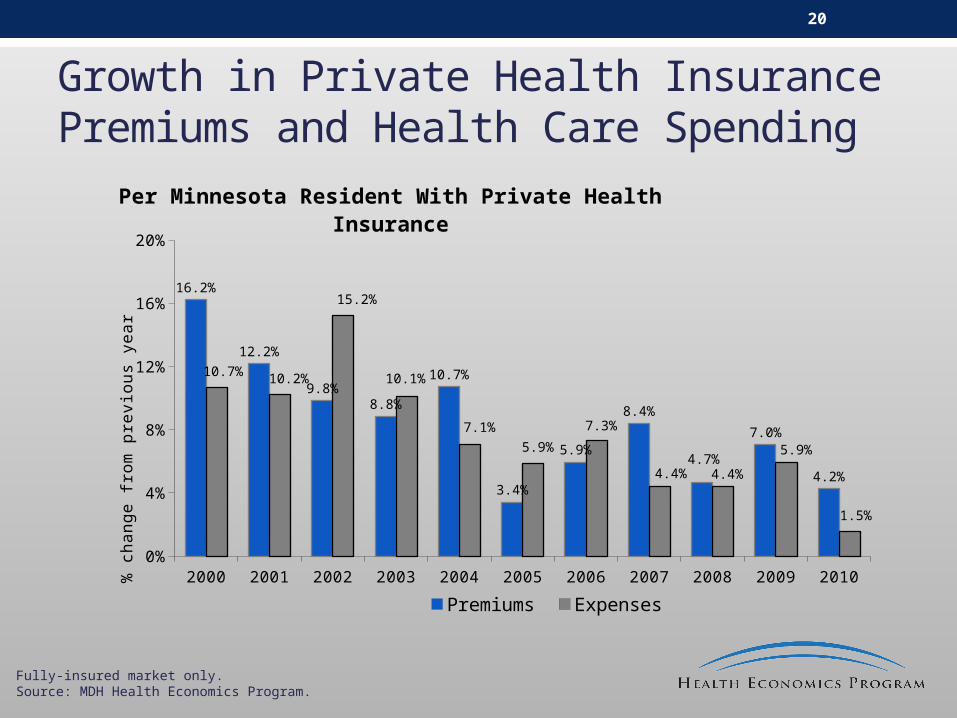
Growth in Private Health Insurance Premiums and Health Care Spending
2000 2001 2002 2003 2004 2005 2006 2007 2008 2009 20100%
4%
8%
12%
16%
20%
16.2%
12.2%
9.8%8.8%
10.7%
3.4%
5.9%
8.4%
4.7%
7.0%
4.2%
10.7% 10.2%
15.2%
10.1%
7.1%
5.9%
7.3%
4.4% 4.4%
5.9%
1.5%
Per Minnesota Resident With Private Health Insurance
Premiums Expenses
% c
ha
ng
e fr
om
pre
vio
us
yea
r
Fully-insured market only.Source: MDH Health Economics Program.
21
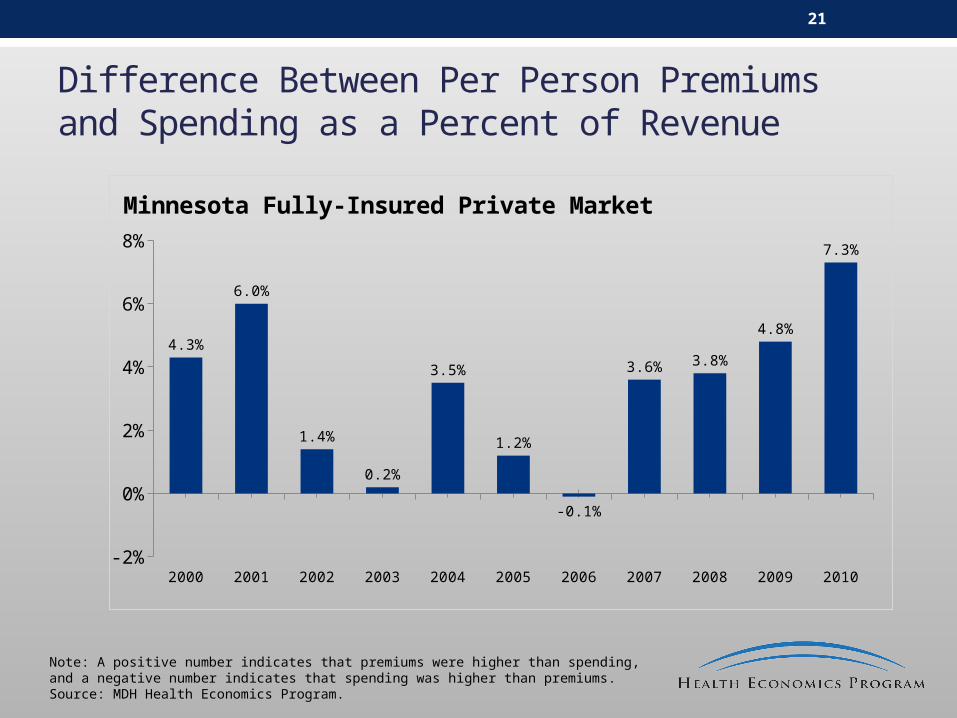
Difference Between Per Person Premiums and Spending as a Percent of Revenue
2000 2001 2002 2003 2004 2005 2006 2007 2008 2009 2010-2%
0%
2%
4%
6%
8%
4.3%
6.0%
1.4%
0.2%
3.5%
1.2%
-0.1%
3.6% 3.8%
4.8%
7.3%
Minnesota Fully-Insured Private Market
Note: A positive number indicates that premiums were higher than spending, and a negative number indicates that spending was higher than premiums.Source: MDH Health Economics Program.
22
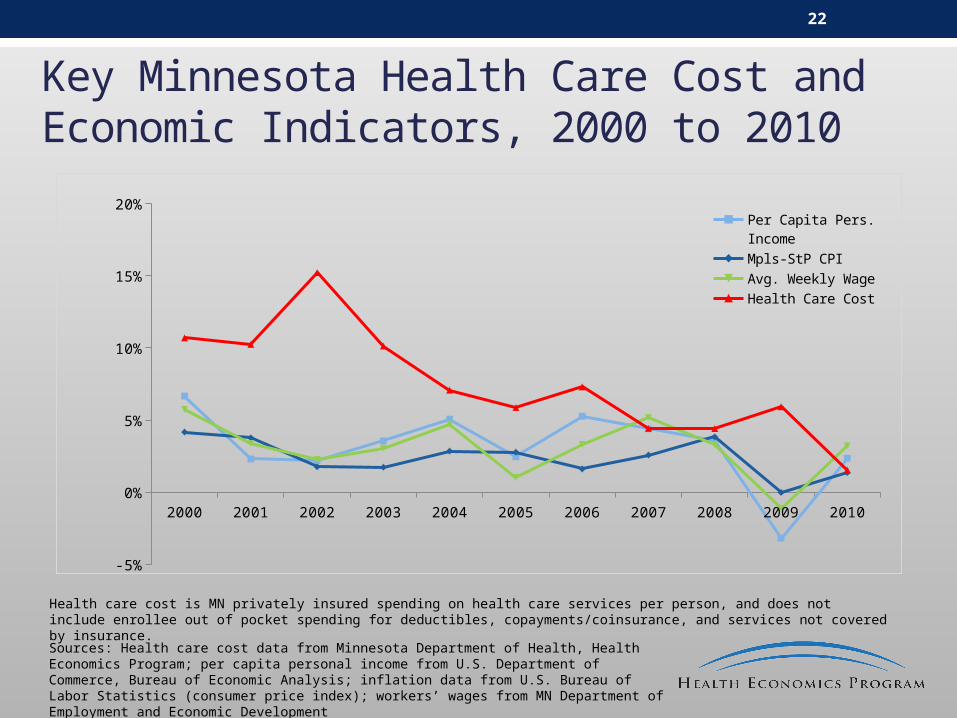
Key Minnesota Health Care Cost and Economic Indicators, 2000 to 2010
2000 2001 2002 2003 2004 2005 2006 2007 2008 2009 2010
-5%
0%
5%
10%
15%
20%Per Capita Pers. Income
Mpls-StP CPI
Avg. Weekly Wage
Health Care Cost
Health care cost is MN privately insured spending on health care services per person, and does not include enrollee out of pocket spending for deductibles, copayments/coinsurance, and services not covered by insurance.
Sources: Health care cost data from Minnesota Department of Health, Health Economics Program; per capita personal income from U.S. Department of Commerce, Bureau of Economic Analysis; inflation data from U.S. Bureau of Labor Statistics (consumer price index); workers’ wages from MN Department of Employment and Economic Development
23
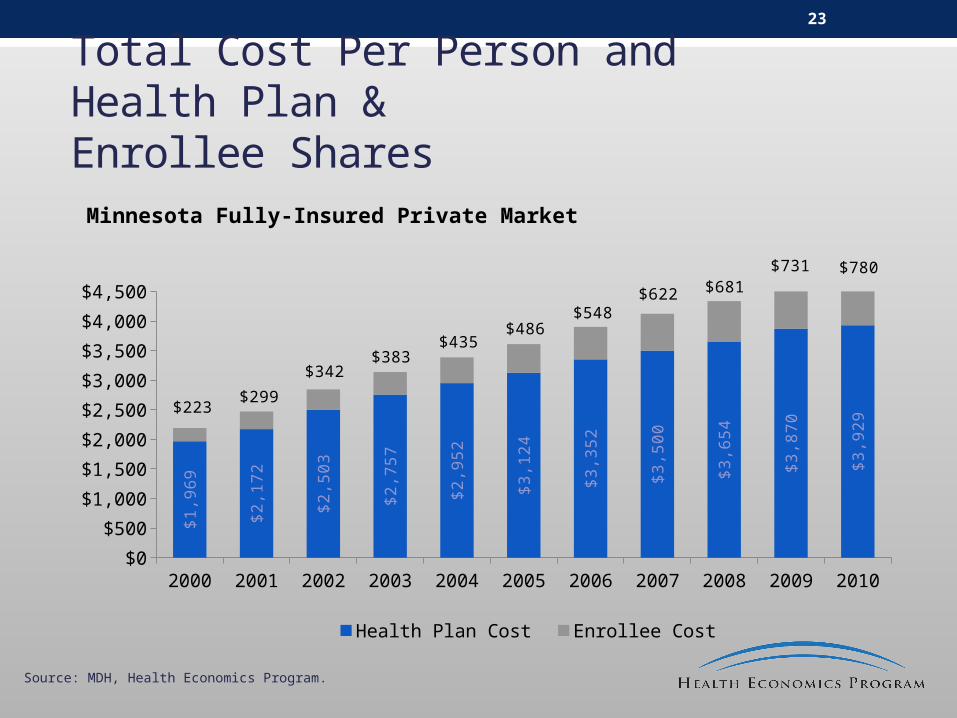
Total Cost Per Person and Health Plan & Enrollee Shares
2000 2001 2002 2003 2004 2005 2006 2007 2008 2009 2010$0
$500
$1,000
$1,500
$2,000
$2,500
$3,000
$3,500
$4,000
$4,500
$1
,96
9
$2
,17
2
$2
,50
3
$2
,75
7
$2
,95
2
$3
,12
4
$3
,35
2
$3
,50
0
$3
,65
4
$3
,87
0
$3
,92
9
$223$299
$342$383
$435$486
$548$622 $681
$731 $780
Minnesota Fully-Insured Private Market
Health Plan Cost Enrollee Cost
Source: MDH, Health Economics Program.
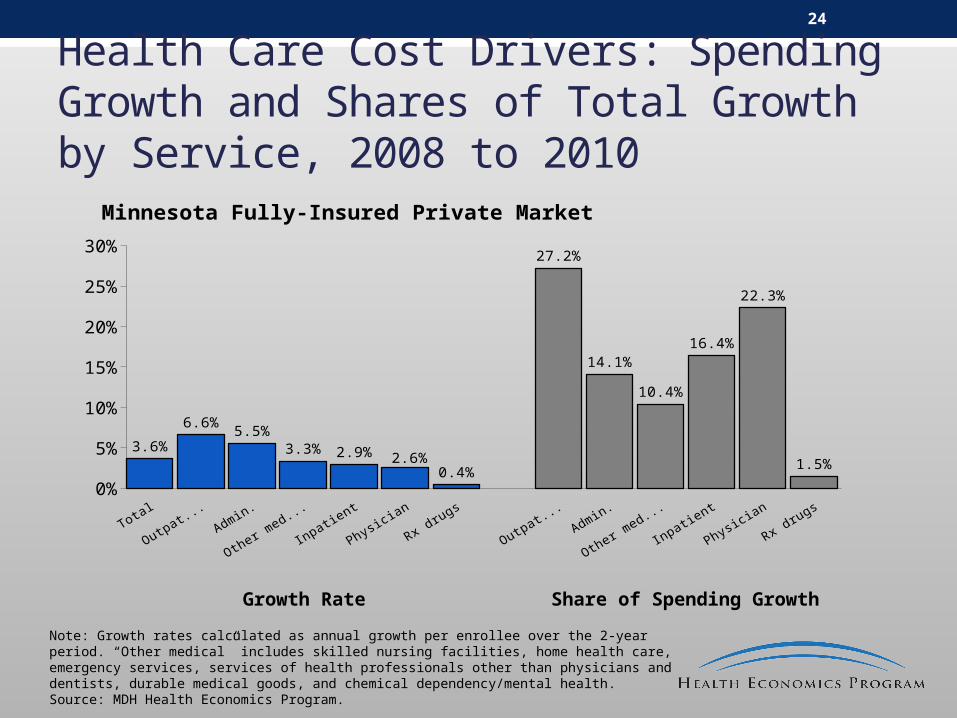
24
Health Care Cost Drivers: Spending Growth and Shares of Total Growth by Service, 2008 to 2010
0%
5%
10%
15%
20%
25%
30%
3.6%
6.6%5.5%
3.3% 2.9% 2.6%0.4%
27.2%
14.1%
10.4%
16.4%
22.3%
1.5%
Minnesota Fully-Insured Private Market
Growth Rate Share of Spending Growth
Note: Growth rates calculated as annual growth per enrollee over the 2-year period. “Other medical” includes skilled nursing facilities, home health care, emergency services, services of health professionals other than physicians and dentists, durable medical goods, and chemical dependency/mental health.Source: MDH Health Economics Program.
Additional Information from the Health Economics Program Available Online
• Health Economics Program Home Page• www.health.state.mn.us/divs/hpsc/hep/index.html
• Publications• http://www.health.state.mn.us/divs/hpsc/hep/publications/index.html
• Health Care Market Statistics (Presentation Slide Decks)• www.health.state.mn.us/divs/hpsc/hep/chartbook/index.html
• Interactive Health Insurance Statistics• https://pqc.health.state.mn.us/mnha/Welcome.action