Embed Size (px)
Citation preview

1
SIM5102 Software Evaluation
Fundamental of Software Measurement

2
The Basic Of Measurements (1)
How much must we know about an attribute before it is reasonable to consider measuring it? For example; do we know enough about ‘size’ of web sites to be able to measure it? Or ‘complexity’ of programs?
How do we know if we have really measured the attribute we wanted to measure? For example; does the count of the number of ‘broken links’ found on a web sites during integration testing measure the quality of the site? If not, what does the count tell us?

3
The Basics Of Measurement (2)
Using measurement, what meaningful statements can we make about an attribute and the entities that process it? For example; is it meaningful to talk about doubling a design’s quality? If not, how do we compare different designs?
What meaningful operations can we perform on measures? For example; does it make sense to calculate the average productivity for a group of developers, or the average quality of a set of web sites?

4
The Basics Of Measurement
To answer these questions, we must establish the basics of a theory of measurement? Measurement Theory
Tells us the rules to be applied
Why Rules? To be consistent in our measurement To provide a basis for interpreting data
The measurement theory we’ll use is the Representational Theory of Measurement

5
The Representational Theory
Aims to formalize our intuition about how the world works
Obtained data must represent attributes of the entities we observe
Manipulation of the data must preserve observed relationships among entities
Intuition is the starting point for all measurement

6
Real, Empirical, and Formal World
Real worl
d
Empirica
lWorld
FormalWor
ld
Intuition andObservation
MappingModeling &Verification

7
Real, Empirical, and Formal World
Entity AEntity B
4233
M(A)>
M(B)
Intuition andObservation
MappingModeling &Verification

8
Number System Real World
50 Tree AM
Tree B45 M
Tree C35 M
M(Tree A) > M(Tree B)M(Tree A) > M(Tree C)M(Tree B) > M(Tree C)
Tree A taller than Tree BTree A taller than Tree CTree B taller than Tree C
Empirical relation preserved under M as Numerical relation

9
Empirical and Numerical Relations
Empirical relation Numerical Relation
•“ taller than”•“ is tall”•“ much taller than”
• x > y• x > 70• x > y + 15
• A is taller than B if and only if M(A) > M(B)• A is tall if and only if M(A) > 70• A is much taller than B if and only if M(A) > M(B) + 15

10
Representation Condition
Required Rules for mapping
the data we obtain as MEASURES should represent attributes of the entities we observe
Manipulation of the data should preserve relationships that we observe among the entities

11
Key Steps of Formal Measurement
1. Identify attribute for some real world entity
2. Identify empirical relations for attribute
3. Identify numerical relations corresponding to each empirical relation
4. Define the model for the mapping from real world entities to numbers
5. Check that numerical relations preserve and are preserved by empirical relation
12
McCabe’s cyclomatic complexity
If G is the control graph for a program P.G has e edges (arcs) and n nodes.
V(G) = e –n + 2
e = 16, n = 13, V(G) = 5
V(G) is the number of linearlyindependent paths in G

13
Cyclomatic Number
What is the entity?What is the attribute?What is the empirical relation?What is the numerical relation?What is the model for the mapping?

14
Cyclomatic Number
Given two programs P1 and P2Cyclomatic number for P1 = 4 and cyclomatic
number for P2 = 9Does that mean that P2 is more complex than
P2

15
Some measures used in SE
Completed project
Rate of occurrence of failure in CPU timeReliabilityProgram code
Number of faults found per KLOCEfficiencyTester
Number of faults found per KLOCRate at which faults are found
Integration testing process
Hours from start to finishDurationIntegration testing process
Number of executable statementsLengthProgram code
Number line of code (LOC)LengthProgram code
Days from start to finishDurationCompleted project
Months from start to finishDuration
MeasuresAttributesEntity

16
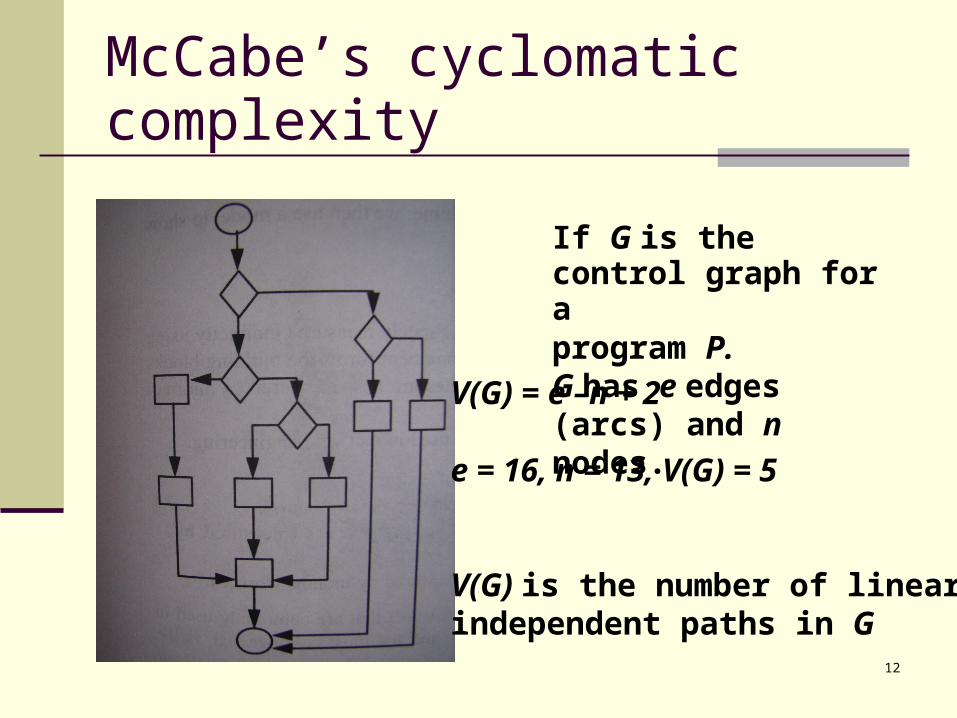
Direct & Indirect Measurement
Direct measurement of an attribute of an entity involves no other attribute or entity Length of source code (measured by LOC) Duration of testing process (measured by
elapsed time in hours) Number of defects discovered during the
testing process (measured by counting defects)
Time a programmer spends on a project (measured by weeks works)
17
Programmer productivity
Module defect density
Indirect Measurement
Defect detection efficiency
LOC producedPerson month of effort
Number of defects module size
Number of defect detected total number of defects
Requirement stability
Test effectiveness ratio
System Spoilage
number of initial requirementTotal number of requirementNumber of items coveredTotal number of items
Effort spent fixing faults total project effort

18
Measurement Scales
Purpose of performing mapping M is to be able to manipulate data in the numerical system and use the results to draw conclusions about the attribute in the empirical system.
Not all mappings are the same and the differences among the mappings can restrict the type of analysis one can do
The measurement mapping M, together with the empirical and numerical systems are a measurement scale.

19
Scale Types
Five major types Nominal Ordinal Interval Ratio Absolute
Knowing the characteristics of each type helps us to interpret the measures
20
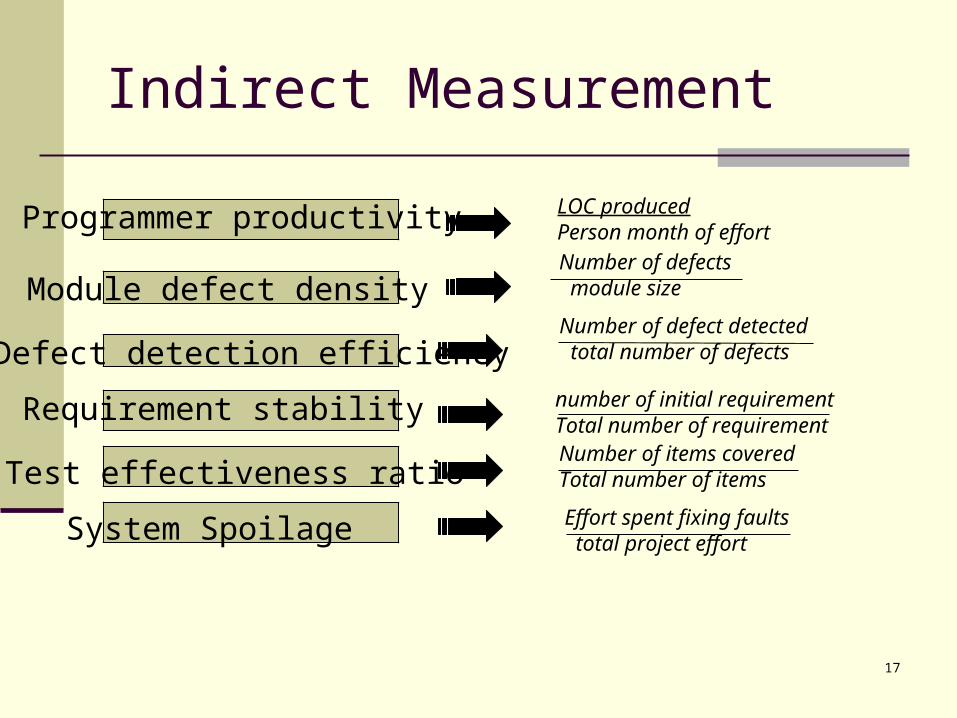
Nominal Scale
The most primitive form of measurement Defines classes or categories, and places
entities in a particular class or category, based on the value of the attribute
Characteristics• The empirical relation system consists only of different class• No notion of ordering• Any numbering or symbolic representation of the classes is
acceptable, but there is no notion of magnitude associated with the numbers or symbols
21
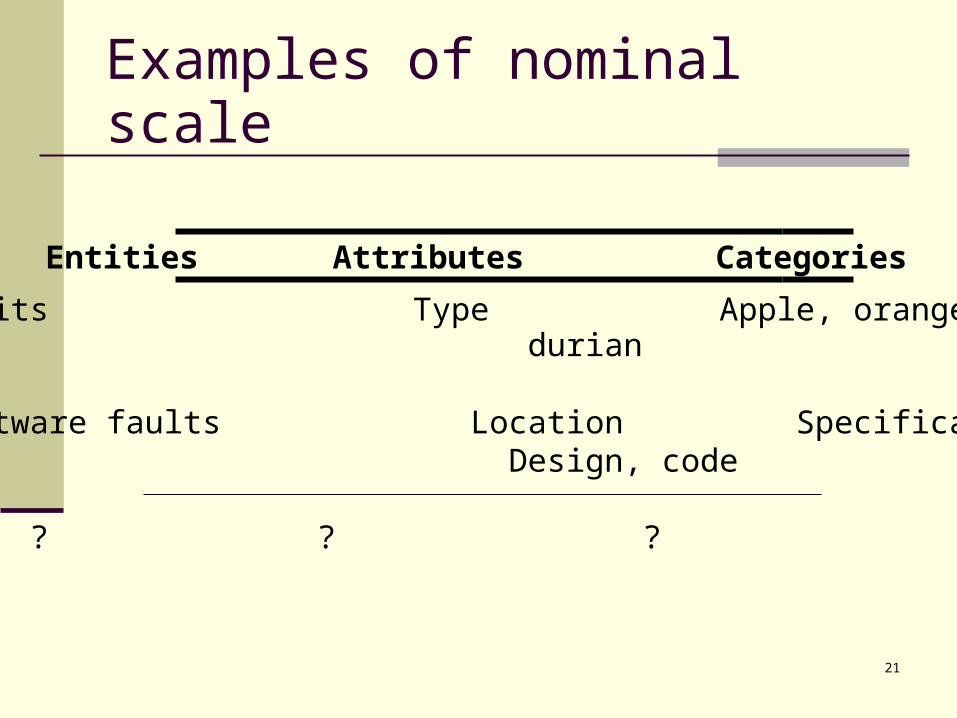
Examples of nominal scale
Entities Attributes Categories
Fruits Type Apple, orange, durian
Software faults Location Specification,Design, code
? ? ?

22
Ordinal Scale
Often useful to augment the nominal scale with information about an ordering of classes or categories
Characteristics The empirical relation system consists of classes that are
ordered with respect to the attribute Any mapping that preserve the ordering is acceptable The numbers represent ranking only, so addition,
subtraction, and any other arithmetic operations have no meaning

23
Examples of ordinal scale
Entities Attributes Categories
Software complexity trivial, simple, moderate,Module complex,
incomprehensible
Academics title tutor, lecturer, senior lecturer,Associate Prof., Prof
? ? ?

24
Interval Scale
Useful to augment the ordinal scale with information about the size of the intervals that separates the classes
Characteristics Preserve order Preserve differences but not ratios. That is we know the
difference between any two of the ordered classes in the range of the mapping, but computing the ratio of the two classes in the range does not make sense
Addition and subtraction are acceptable operations, but not multiplication and division

25
Examples of interval scale
Entities Attributes Categories
Project Time relative to number of daysstart of project
Method complexity very low, low,average, high,very high
? ? ?

26
Ratio Scale
The most useful scale of measurement, common in the physical science
Characteristics Preserving ordering, the size of interval between entities,
and ratios between entities There is a zero element, representing total lack of the
attribute Mapping must start at zero and increase at equal interval,
known as units All arithmetic can be meaningfully applied to the classes in
the range of mapping

27
Examples of ratio scale
Entities Attributes Categories
Source code Length LOC
Web Site size number of web pages
? ? ?

28
Absolute Scale
This is the most restrictive scale Characteristics
The measurement for an absolute scale is made simply by counting the number of elements in the entity set
The attribute always takes the form “number of occurrences of x in the entity”
There is only one possible measurement mapping, namely the actual count
All arithmetic analysis of the resulting counting is meaningful

29
Examples of absolute scale
Entities Attributes CategoriesSource code number of LOC number of LOC
Web Site number of HTML files number of HTML files
? ? ?

30
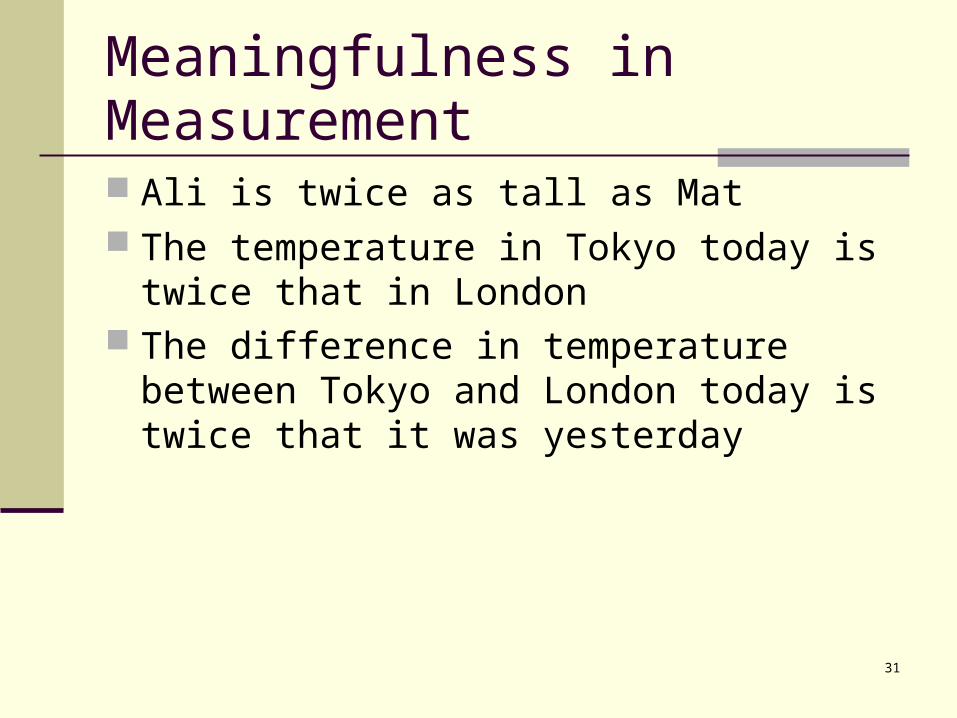
Meaningfulness in Measurement
“ We say that a statement involving measurement is meaningful if its truth value is invariant of transformations of allowable scales”
31
Meaningfulness in Measurement
Ali is twice as tall as Mat The temperature in Tokyo today is twice that
in London The difference in temperature between Tokyo
and London today is twice that it was yesterday

32
Meaningfulness in Measurement
Ali is twice as tall as Mat Ali is 180 cm tall Mat is 90 cm tall
same as
Ali is 5.9 feet tall Mat is 2.95 feet tall
Feet= centimeters/30.48
M(Ali) = 2 * M(Mat)
M(Ali) = 2 * M(Mat)

33
Meaningfulness in Measurement
The temperature in Tokyo today is twice that in London Tokyo temperature = 40 C London temperature = 20 C
same as
Tokyo temperature = 104 F London temperature = 68 F
F = 9/5 * C + 32
M(Tokyo) = 2 * M(London)
M(Tokyo) = 2 * M(London)

34
Meaningfulness in Measurement
Yesterday Tokyo = 35 C London = 25 C
Same as Tokyo = 95 F London = 77 F
Today Tokyo = 40 C London = 20 C
Same as Tokyo = 104 F London = 68 F
10
18
20
36
|M(TokyoT) – M(LondonT)| = 2 * |M(TokyoY) – M(LondonY)|
35
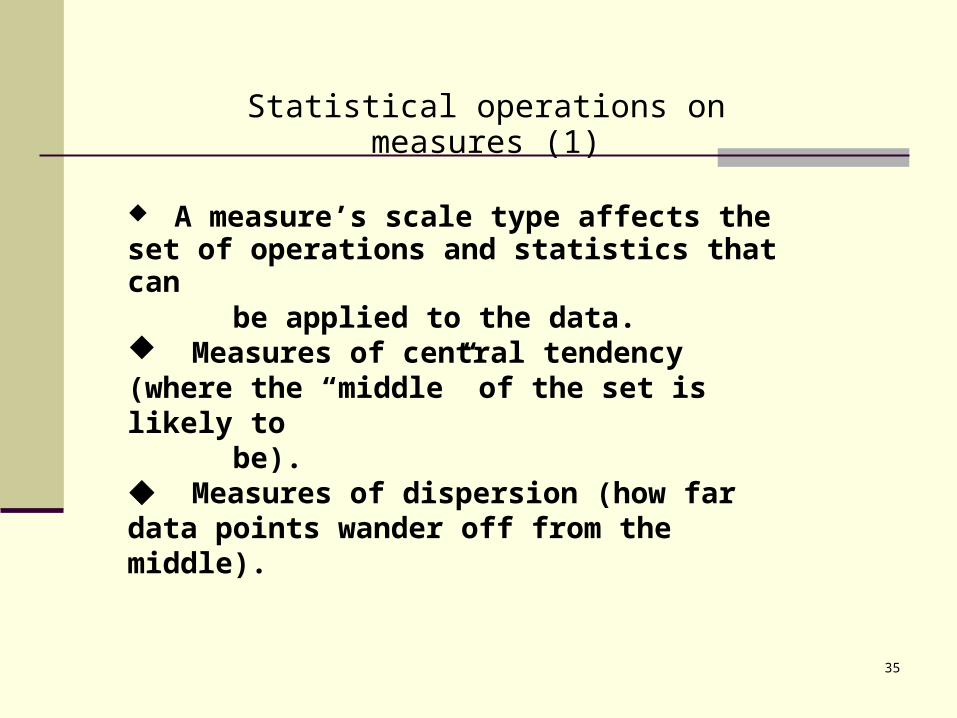
Statistical operations on measures (1)
A measure’s scale type affects the set of operations and statistics that can be applied to the data. Measures of central tendency (where the “middle” of the set is likely to be). Measures of dispersion (how far data points wander off from the middle).

36
Measures of central tendency
# Web pages
202025262735454546678990
100100100123
Mean 59.9Median 45.5Mode 100.0Sum 958.0
Mean = sum divided by number of itemsMedian = value of the middle-ranked itemMode = value of the most commonly occurring itemSum = sum of values for all items

37
Measures of dispersion
Minimum = smallest valueMaximum = largest valueStandard deviation = indication of the spread of observations about the mean.
Minimum 20.0Maximum 123.0Std deviation 35.1

38
Important!
Mean and standard deviation cannot be computed on nominal and ordinal measures!!!!
Nominal and ordinal measures do not allow arithmetic operations such as addition, subtraction, multiplication and division.

39
Summary of measurement scales and statistics relevant to each1
Non-parametric
Parametric
Mean
Pearson correlation
Equivalence
Greater than
Known ratio of any
Intervals
Known ratio of any two
Scale values
Ratio
Non-parametric
Parametric
Mean
Standard deviation
Pearson correlation
Equivalence
Greater than
Known ratio of any
Intervals
Interval
Non-parametricMedian
Spearman r
Kendal t
Kendall W
Equivalence
Greater than
Ordinal
Non-parametricMode
Frequency
EquivalenceNominal
Appropriate
Statistical tests
Examples of appropriate statistics
Defining RelationsScale
Type
1 Fenton and Pfleeger
40
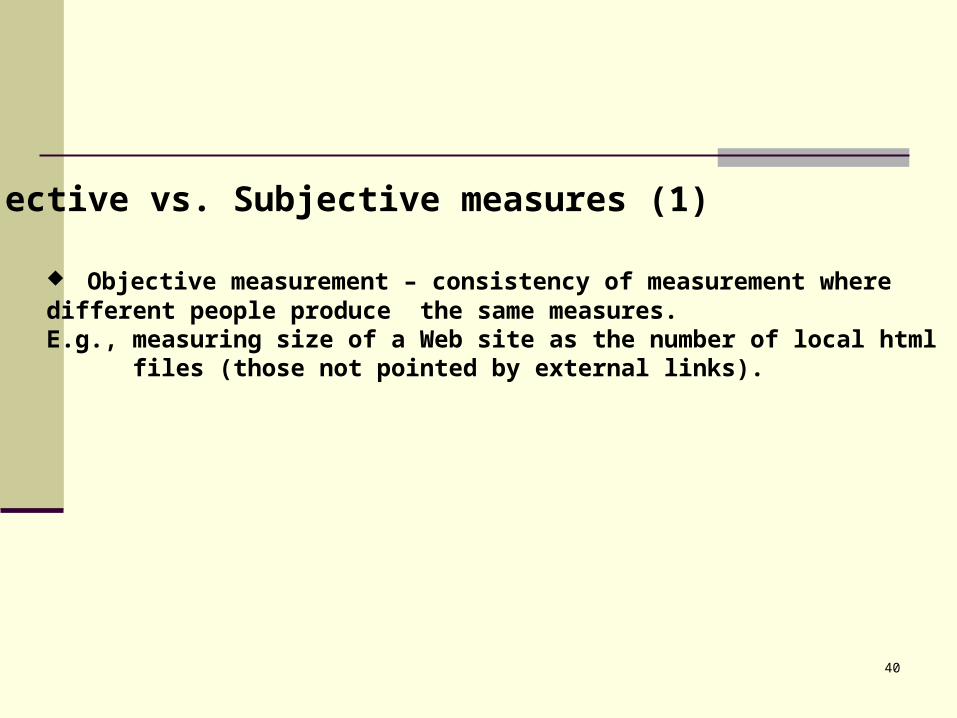
Objective vs. Subjective measures (1)
Objective measurement – consistency of measurement where different people produce the same measures. E.g., measuring size of a Web site as the number of local html files (those not pointed by external links).

41
Objective vs. Subjective measures (2)
Subjective measurement – measures that depend on the environment in which they are made.
Can vary with the person measuring, and they can reflect the judgement of the measurer. E.g. measuring interface design, understandability of requirements etc.

42
Reading
Chapter 2 Fenton and Pfleeger book.


![Managing software process measurement: A …...Software measurement plays a fundamental role in Software Engineering [8]. Measurement can help to address some critical issues in software](https://img.pdfslide.net/doc/110x75/5fcc31a12d50f40a8d0747d0/managing-software-process-measurement-a-software-measurement-plays-a-fundamental.jpg)