Embed Size (px)
Citation preview

1
Soil NO inventory from large scale Soil NO inventory from large scale farming in France: impact on farming in France: impact on
atmospheric NO2 and O3 atmospheric NO2 and O3 concentrationsconcentrations
Achieved during 2 national French projectsAchieved during 2 national French projectsGICC et PNCAGICC et PNCA In Collaboration with : In Collaboration with : INRA (Grignon) : P. Laville, B. Gabrielle, A. L. INRA (Grignon) : P. Laville, B. Gabrielle, A. L. PalluisPalluisLA (Toulouse): D. Serça, J. CortinovisLA (Toulouse): D. Serça, J. CortinovisSA (Paris) : M. Beekmann, F. Ravetta SA (Paris) : M. Beekmann, F. Ravetta INRA (Dijon) : C. HénaultINRA (Dijon) : C. Hénault
2
Grignon
Auradé
Dijon
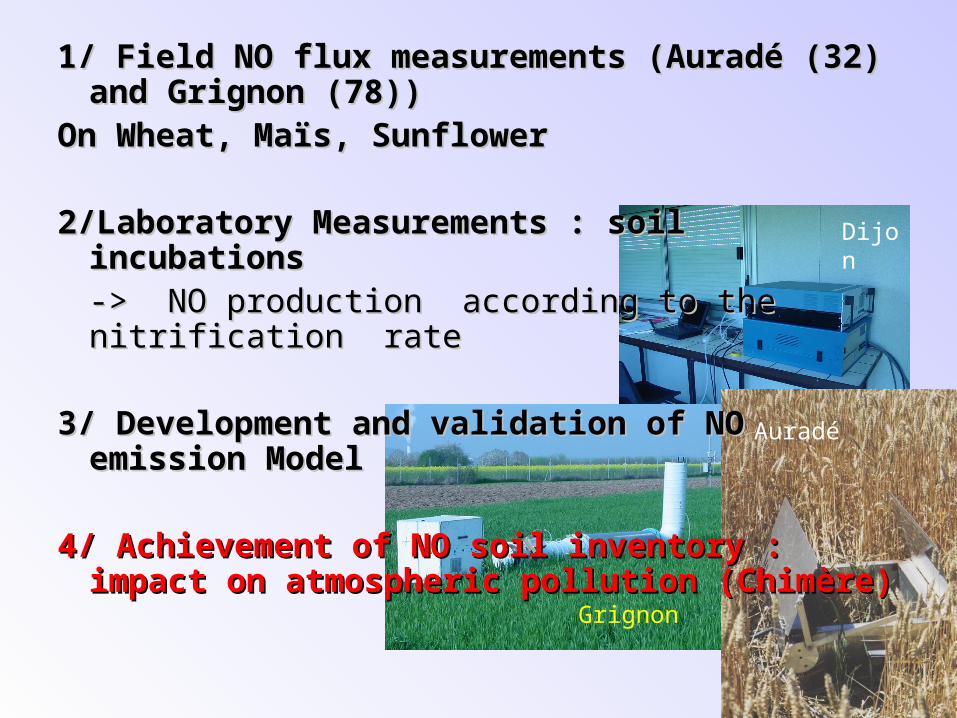
1/1/ Field NO flux measurements (Auradé Field NO flux measurements (Auradé (32) and Grignon (78))(32) and Grignon (78))
On Wheat, Maïs, SunflowerOn Wheat, Maïs, Sunflower
2/Laboratory Measurements : soil 2/Laboratory Measurements : soil incubationsincubations-> NO production according to the -> NO production according to the nitrification ratenitrification rate
3/ Development and validation of NO 3/ Development and validation of NO
emission Modelemission Model
4/ Achievement of NO soil inventory : 4/ Achievement of NO soil inventory : impact on atmospheric pollution impact on atmospheric pollution (Chimère)(Chimère)

3
Examples of In Situ Measurements : Auradé (Midi Pyrenees), Grignon (Ile de France)
Blé
0
5
10
15
20
25
30
35
40
45
50
Flu
x N
O (
ng
N/m
²/s)
plu
ie (
mm
)
Pluie
FNO chambre
apport blé NH4
apport blé NO3
Moy. mobile sur 2 pér.(FNO chambre)
maïs
0
30
60
90
120
150
180
210
240
270
17/4 1/5 15/5 29/5 12/6 26/6 10/7 24/7 7/8 21/8 4/9 18/9 2/10
Jour 2002
Flu
x N
O (
ng
N/m
²/s)
0
5
10
15
20
25
30
35
Plu
ie (
mm
)P lu ie moy FNO ma is
a p po rt ma ïs NH4 a p port ma ïs NO 3
Auradé 2003, blé
0
5
10
15
20
25
Date
Flu
x N
O (
g N
ha
-1 j-1
)
précipitations
flux de NO
Engrais
EngraisEngrais
Annual Variations of NO flux :Annual Variations of NO flux :- Outside nitrogen input periods A background level ~ 1 à 3 gN-NO/ha/d- After nitrogen inputs largest NO emissions during 3 to 4 weeks
-Largely dependent on :Largely dependent on :temperature- humidity – ammonia concentration of the soils
Grignon

NO3- NO2
- NH4+
N2O,NON2
Dénitrification (anaerobie)
Nitrification (aerobie)
Biological processes involved on N2O et NO productions
K1(t)
K3(t
)
K2(t)
N2O(t) = K1(t) + K2(t) - K3(t)NO(t) = K’2(t)
NO
K’2(t)
5
0
2
4
6
8
10
12
14
16
18
0 5 10 15 20 25 30 35
Humidité ponderale Wc (%)
FW
0
0.1
0.2
0.3
0.4
0.5
0.6
0.7
0.8
0.9
0 50 100 150 200
concentration en substratN- NH4 (ppm)
FN
0
0.02
0.04
0.06
0.08
0.1
0.12
0 1 2 3 4 5 6
VN : vitesse de nitrifiaction (mgN/kgsol/jour)
FN
O :
vit
ess
e d
e p
rod
ucti
on
du
NO
(mgN
/kg
sol/
jou
r)
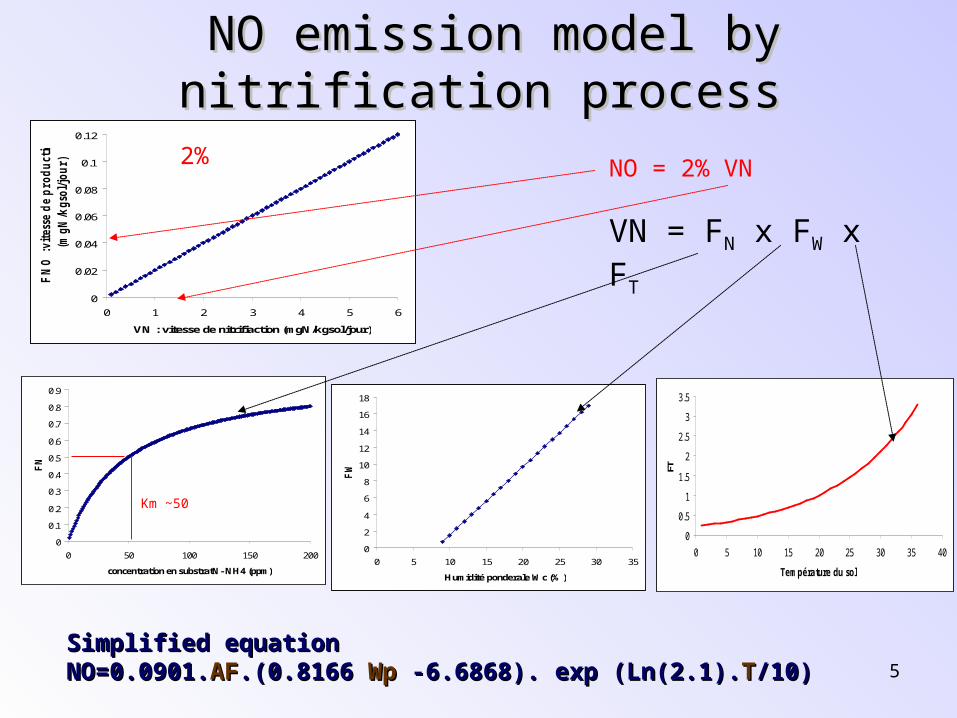
NO emission model by nitrification NO emission model by nitrification processprocess
0
0.5
1
1.5
2
2.5
3
3.5
0 5 10 15 20 25 30 35 40
Température du sol
FT
NO = 2% VN
VN = FN x FW x FT
Simplified equation Simplified equation NO=0.0901.NO=0.0901.AFAF.(0.8166 .(0.8166 Wp Wp -6.6868). exp (Ln(2.1).-6.6868). exp (Ln(2.1).TT/10)/10)
2%
Km ~50
6
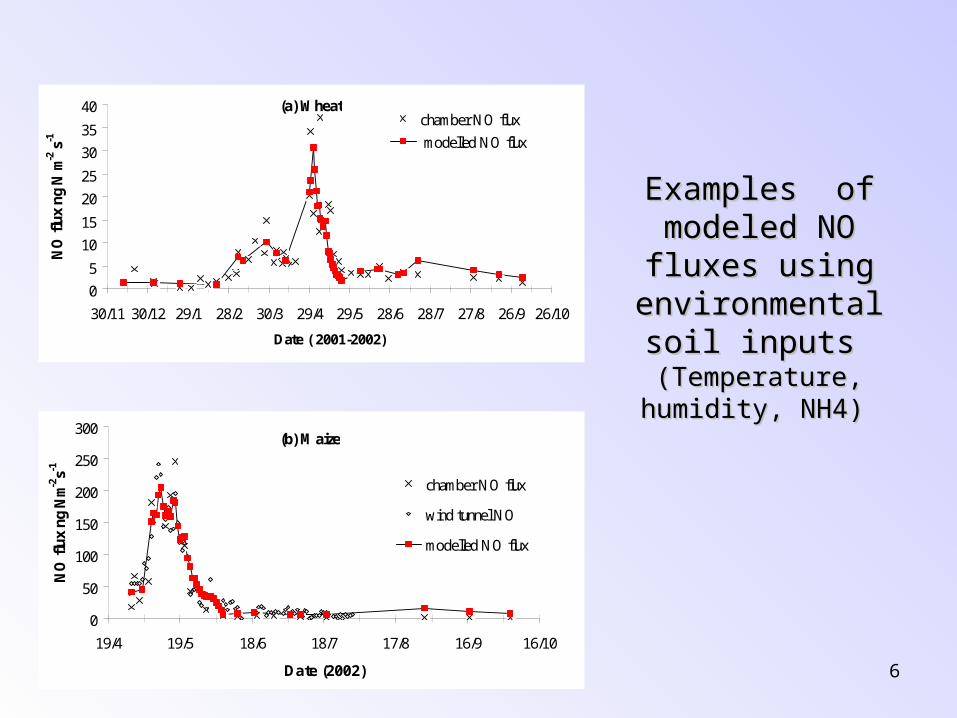
Examples of Examples of modeled NO modeled NO fluxes using fluxes using
environmental environmental soil inputs soil inputs
(Temperature, (Temperature, humidity, NH4)humidity, NH4)
(a) Wheat
0
5
10
15
20
25
30
35
40
30/11 30/12 29/1 28/2 30/3 29/4 29/5 28/6 28/7 27/8 26/9 26/10
Date ( 2001-2002)
NO
flu
x n
g N
m-2
s-1
chamber NO flux
modelled NO flux
(b) Maize
0
50
100
150
200
250
300
19/4 19/5 18/6 18/7 17/8 16/9 16/10
Date (2002)
NO
flu
x n
g N
m-2
s-1
chamber NO flux
wind tunnel NO
modelled NO flux
7
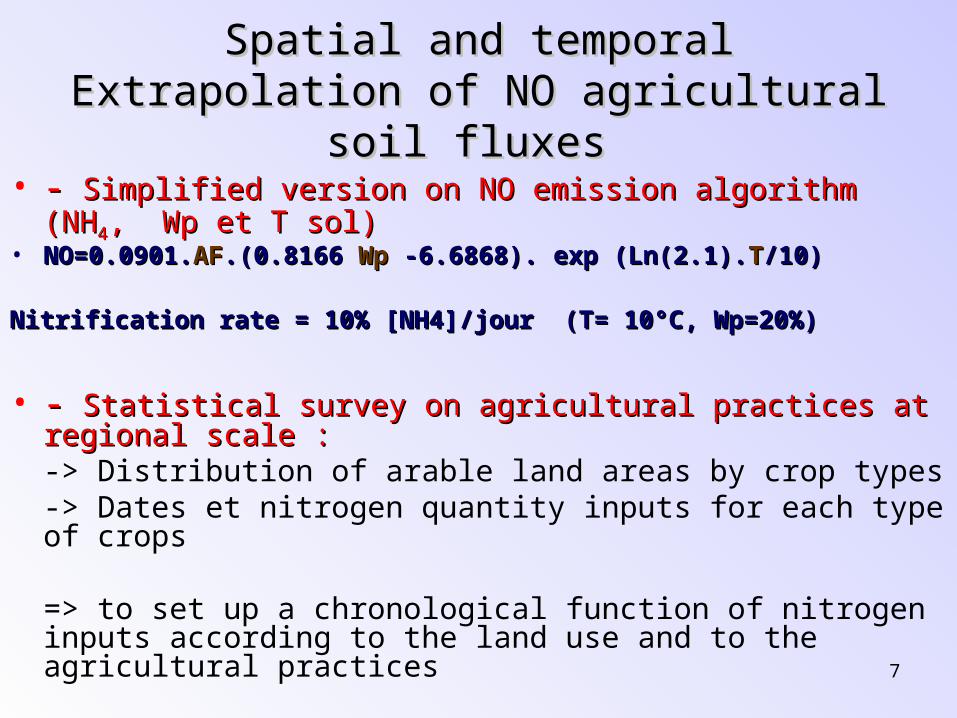
Spatial and temporal Extrapolation of Spatial and temporal Extrapolation of NO agricultural soil fluxes NO agricultural soil fluxes
• -- Simplified version on NO emission algorithm (NH Simplified version on NO emission algorithm (NH44, Wp , Wp et T sol)et T sol)
• NO=0.0901.NO=0.0901.AFAF.(0.8166 .(0.8166 Wp Wp -6.6868). exp (Ln(2.1).-6.6868). exp (Ln(2.1).TT/10)/10)
Nitrification rate = 10% [NH4]/jour (T= 10°C, Wp=20%)Nitrification rate = 10% [NH4]/jour (T= 10°C, Wp=20%)
• -- Statistical survey on agricultural practices at regional Statistical survey on agricultural practices at regional scale :scale :
-> Distribution of arable land areas by crop types -> Dates et nitrogen quantity inputs for each type
of crops
=> to set up a chronological function of nitrogen inputs according to the land use and to the agricultural practices

8
Survey on nitrogen use by crop and by Survey on nitrogen use by crop and by regionregion
TAS
57% SAUITK_Ile de France ITK_Ile de France 11
Crop idf
MoyB N MoyB A crop ha Oats 100.0 2.0 35.0 65.0 0.0 09-29/02 11-31/03 0.0 1 554
Hard wheat 203.0 3.0 60.0 83.0 60.0 09-29/02 05-25/03 10-30/04 1 855
Soft wheat 200.0 3.0 66.0 80.0 54.0 09-29/02 05-25/03 10-30/04 256 217
Maïze 167.0 2.0 80.0 87.0 0.0 10-30/04 (20-09)/05-06 0.0 41 721
Barley 133.0 2.0 91.0 42.0 0.0 01-21/02 05-25/03 0.0 60 350
Rye 110.0 2.0 40.0 70.0 0.0 09-29/02 11-31/03 0.0 687
Sorghum. 100.0 2.0 45.0 55.0 0.0 01-20/05 09-29/06 0.0 27
Triticale 110.0 2.0 40.0 70.0 0.0 09-29/02 11-31/03 0.0 428
Others cereals 125.0 2.0 50.0 75.0 0.0 01-21/02 01-21/03 0.0 126
Beet 133.0 2.0 107.0 26.0 0.0 11-31/03 10-30/04 0.0 41 989
Rape 182.0 2.0 82.0 100.0 0.0 01-21/02 05-25/03 0.0 52 307
Sunflower 55.0 1.0 55.0 0.0 0.0 (15-05)/04-05 0.0 0.0 3 812
Others oleaginous 120.0 2.0 50.0 70.0 0.0 01-21/03 01-21/04 0.0 718
Fodder (total) 60 1 60 0 0 01-20/04 0 0 6 625
Area SAL 468 416
Rice 60 1 60 0 0 01-30/04 0 0 0
industrial crops 50 1 50 0 0 01-31/03 0 1 797
Patato 160 2 130 30 0 01-29/02 01-30/04 3 503
green vegetable 80 2 40 40 0 01-29/02 01-29/08 5 778
Superficie TAns 11 078
Fallow 0 0 0 0 0 0 0 0 38 928
Soja 0 0 0 0 0 0 0 0 69
Leguminous 0 0 0 0 0 0 0 0 43 404
Superficie Tasans 82 401
horticulture 100 2 50 50 0 01-29/02 01-30/04 478
Orchards 100 2 50 50 0 01-29/02 01-30/04 1 207
Vines 56 1 56 0 0 01-20/06 27
others permanent crops 70 2 35 35 0 01-20/03 01-20/04 1 249
Superficie CP 2 961
Grasslands 80 2 40 40 0 01-20/03 01-20/04 0 16 358
Superficie P&PP 16 358
SAU tot 581 214
non selected arableland
Arable landwhitout nitrogen
inputs
Perennial andhorticultural crops
MoyB N/A MoyB
Selected ArableLand (SAL)
TAS
9
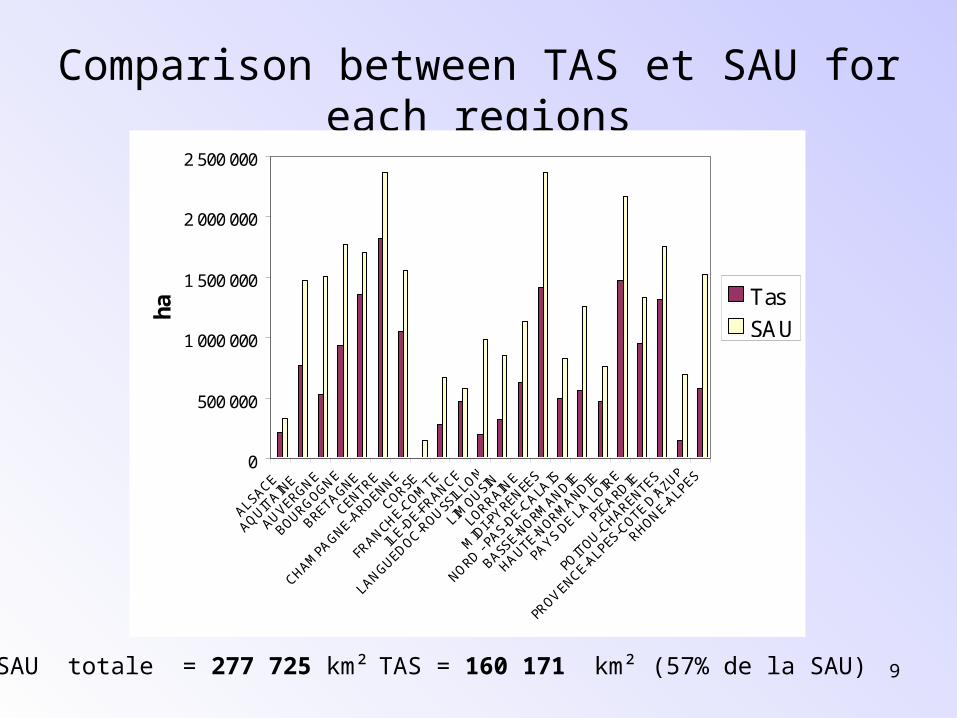
Comparison between TAS et SAU for each regions
SAU totale = 277 725 km² TAS = 160 171 km² (57% de la SAU)
0
500 000
1 000 000
1 500 000
2 000 000
2 500 000
ALSACE
AQUITAIN
E
AUVERGNE
BOURGOGNE
BRETAGNE
CENTRE
CHAMPAGNE-A
RDENNE
CORSE
FRANCHE-COM
TE
ILE-D
E-FRANCE
LANGUEDOC-ROUSSIL
LON
LIMOUSIN
LORRAINE
MID
I-PYRENEES
NORD - PAS-D
E-CALAIS
BASSE-NORM
ANDIE
HAUTE-NORM
ANDIE
PAYS DE L
A LOIR
E
PICARDIE
POITOU-C
HARENTES
PROVENCE-ALPES-C
OTE D'A
ZUR
RHONE-ALPES
ha Tas
SAU

10
0
50 000 000
100 000 000
150 000 000
200 000 000
250 000 000
300 000 000k
gN UNIFA
qté Tas
Comparison between synthesis nitrogen deliveries (UNIFA) Comparison between synthesis nitrogen deliveries (UNIFA) And the amounts estimated according to our surveyAnd the amounts estimated according to our survey
qté TAS = qté TAS =
N = 0.147 millions tonnes (7%) TAS =57% de la SAU
-2.4 millions tonnes of synthesis nitrogen fertilizers/year(65% in ammonia form) -1.4 millions tonnes of nitrogen manure /year
ii
i NS .
11
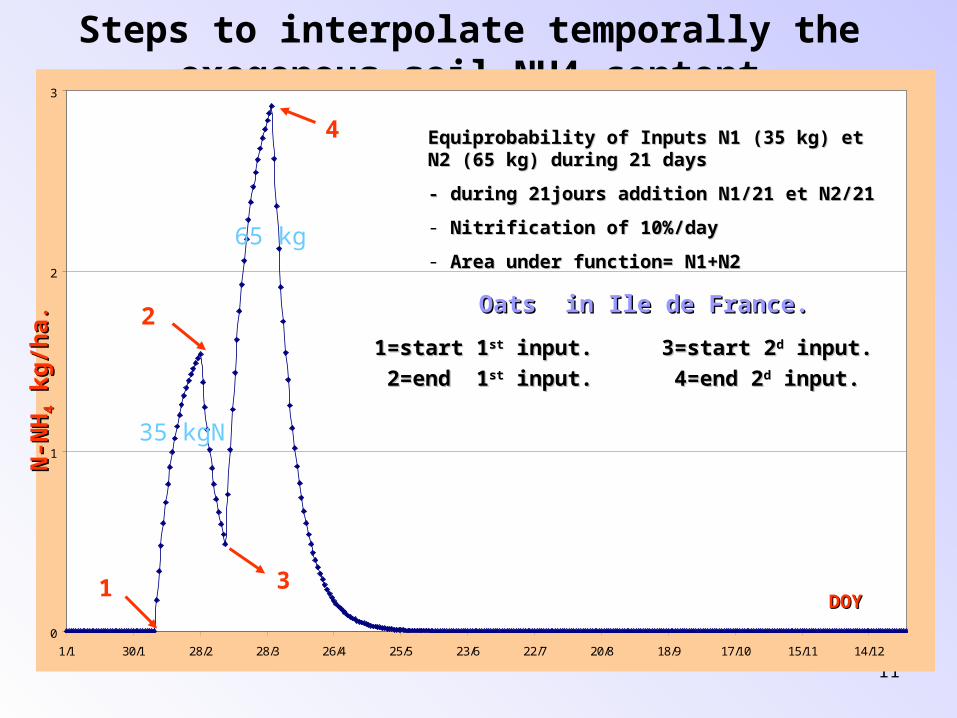
Steps to interpolate temporally the exogenous soil NH4 content
0
1
2
3
1/1 30/1 28/2 28/3 26/4 25/5 23/6 22/7 20/8 18/9 17/10 15/11 14/12
1
2
4
N-N
HN
-NH
44 k
g/h
a k
g/h
a.. Oats in Ile de France.Oats in Ile de France.
3
1=start 11=start 1stst input. input. 3=start 23=start 2dd input. input.
2=end 12=end 1stst input. input. 4=end 24=end 2dd input input..
DOY DOY
Equiprobability of Inputs N1 (35 kg) et N2 Equiprobability of Inputs N1 (35 kg) et N2 (65 kg) during 21 days(65 kg) during 21 days
- during 21jours addition N1/21 et N2/21- during 21jours addition N1/21 et N2/21
- Nitrification of 10%/dayNitrification of 10%/day
- Area under function= N1+N2Area under function= N1+N2
35 kgN
65 kg

12
Chronology nitrogen inputs => time series of NH4 Chronology nitrogen inputs => time series of NH4 content in regioncontent in region
A background level of 0.9 kg N-NH4/ha
0
200000
400000
600000
800000
1000000
1200000
1400000
1600000
1800000
1/1 1/3 30/4 29/6 28/8 27/10 26/12
Date
N-N
H4
kgN
Ile de FranceMidi Pyrénées
0
0.5
1
1.5
2
2.5
3
3.5
1/1 1/3 30/4 29/6 28/8 27/10 26/12
Date
NH
4 kg
N/h
a
Ile de France
Midi Pyrénées
115 kg/ha
exogenous
endogenous
59 kg/ha
0
0.5
1
1.5
2
2.5
3
3.5
1/1 1/3 30/4 29/6 28/8 27/10 26/12 24/2
Date
NH
4 (
kg
N/h
a)
Ile de France
Alsace
Aquitaine
Auvergne
Bougogne
Bretagne
Centre
Charente
Corse
Franche Comté
Langeudoc Roussillon
Limousin
Loraine
Midi Pyrénées
Nord Pas De Calais
Basse Normandie
Haute Normandie
Pays de Loire
Picardie
Poitou Charentes
PACA
Rhone Alpes

13
Example of NO simulated fluxes obtained from the MM5 model outputs (T et Wp), and
the temporal NH4 content time series
0
1
2
3
4
5
6
7
8
9
10
10/2 11/3 10/4 10/5 9/6 9/7 8/8 7/9 7/10 6/11 6/12
DateN
O fl
ux (g
N h
a-1
d-1
)
Midi Pyrenee
Ile de France
Flux Grignon 2003
0
1
2
3
4
5
6
7
8
9
10
10/2 11/3 10/4 10/5 9/6 9/7 8/8 7/9 7/10 6/11 6/12
flu
x N
O g
/ha/
j
-10
-5
0
5
10
15
20
25
30
35
tem
per
atu
re (
°C)
Flux NO
Température 0-15 cm
0
1
2
3
4
5
6
7
8
9
10
10/2 11/3 10/4 10/5 9/6 9/7 8/8 7/9 7/10 6/11 6/12
flu
x N
O (
gN/h
a/j)
0.00
0.05
0.10
0.15
0.20
0.25
0.30
0.35
0.40
0.45
hu
mid
ité
volu
miq
ue
(m3 /m
3 )
Flux NO
Humidité volumique 0-15cm

14
Yearly Balance of NO soil emissions in France Yearly Balance of NO soil emissions in France
Région Surface Tas(ha) N-NH4 (kg/an) N-NO(t/an) N-NO/N-NH4(%) N-NO/N(%)ALSACE 212035 102 208.16 0.96 0.62AQUITAINE 767774 92 735.87 1.04 0.67AUVERGNE 527360 56 454.10 1.53 0.99BOURGOGNE 932899 94 860.56 0.98 0.64BRETAGNE 1362963 53 1156.63 1.60 1.04CENTRE 1819860 100 1712.66 0.94 0.61CHAMPAGNE-ARDENNE 1053704 103 991.99 0.92 0.60CORSE 8821 49 7.50 1.73 1.13FRANCHE-COMTE 281665 70 247.95 1.25 0.81ILE-DE-FRANCE 468416 115 453.45 0.84 0.55LANGUEDOC-ROUSSILLON 198935 75 177.93 1.19 0.78LIMOUSIN 322501 45 270.13 1.85 1.20LORRAINE 634608 75 565.45 1.19 0.78MIDI-PYRENEES 1416119 59 1229.59 1.46 0.95NORD - PAS-DE-CALAIS 500674 93 460.27 0.99 0.64BASSE-NORMANDIE 561119 65 487.86 1.33 0.86HAUTE-NORMANDIE 466938 98 433.36 0.95 0.62PAYS DE LA LOIRE 1474579 54 1253.34 1.58 1.03PICARDIE 948389 106 906.24 0.90 0.58POITOU-CHARENTES 1321158 77 1202.50 1.18 0.77PROVENCE-ALPES-COTE D'AZUR150281 77 149.38 1.29 0.84RHONE-ALPES 586349 69 565.01 1.39 0.90
Total /Moyenne* 16017147 79 14529.92 1.23 0.80

14.5 ktN-NO/year = 47.7 ktNO2/year on 57%SAUIn rough approximation soil NO flux = 84ktNO2/year ~ 11% /transport and 5% / all sources (CITEPA)
Methodology EMEP/CORINAIR=> EF = 0.7% (2.4MtN/an) =55.2ktNO2/an (Bouwman, 2002)
Annually soil NO emissionsAnnually soil NO emissions

16
Impact on atmospheric chemistry Impact on atmospheric chemistry
(modeling with CHIMERE).(modeling with CHIMERE).
Mean arable land NO emissions (June 2003) (Max 8 g N/ha/d)
Additional O3 concentration linked to arable soil NO sources : mean estimates for June 2003 (max 3 ppb)
17
Conclusions
Positive item : - Improvement in seasonal variation
on NO Fluxes=> seasonal nitrogen inputs
taken into account.
- Parameterizations on NO flux versus soil humidity

18
Conclusions insufficient Item : • No variability of emissions depending on
soil type• Only NO from nitrification is considered
and the denitrification ?• Emissions from animal manure were not
study • Variation of background [NH4] not take
account (annually balance 0.5 ppm =>80% of fluxes) =>Simulate net mineralization
• And the other ecosystems or arable lands?