Embed Size (px)
Citation preview
1
Some Observations on Current Trends in Public
Policy & Budgeting
Barry AndersonDeputy Director
National Governors [email protected]
March 13, 2012
1
2
My Goal TodayDiscuss a series of observations
on current trends in public policy and budgeting
These observations are not intended to be definitive or all inclusive, but I hope they will be thought-provoking, or at least entertaining
2
Some Observations The period of American economic dominance may be
ending—but so what? And it is not at all clear that State Capitalism will dominate
in the long run. Adaptability may be our most valuable asset. Our inherent ability to think strategically, which may be a
product of our political system(!), is also an asset. Speaking of our political system, some good news: more
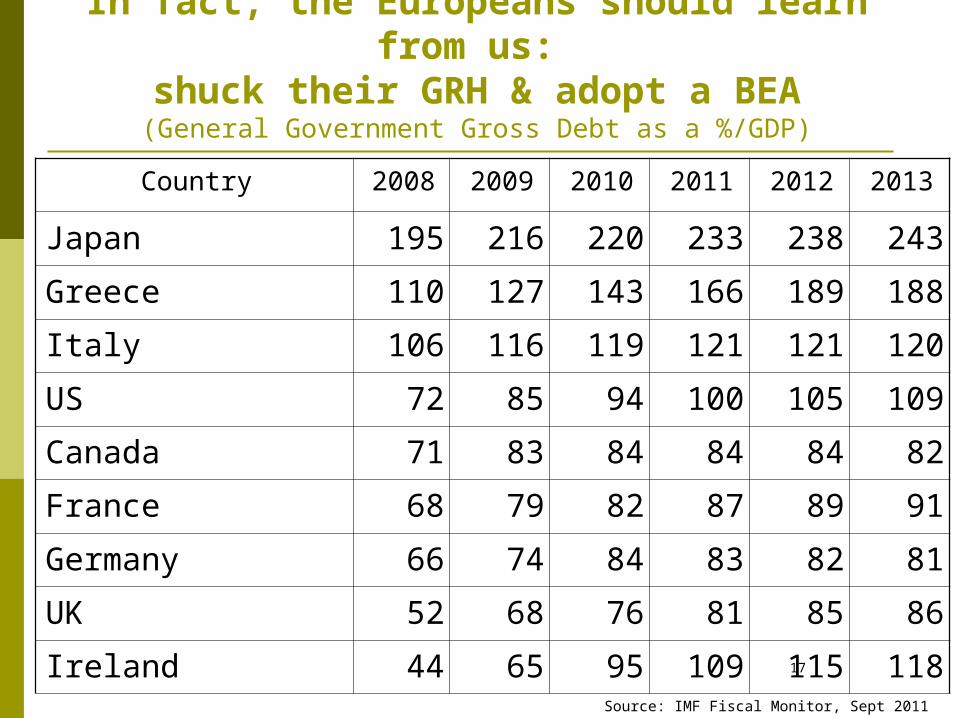
competitive House races. A positive budget trend: long-term budget projections. As to the budget caps: what’s wrong with what works? In fact, the Europeans should learn from us: shuck their GRH
& adopt a BEA. With respect to tax reform, could there be agreement on
“broaden the base & lower the rates”? But isn’t the budget process broken beyond repair? A final word on What We Will See in the Year Ahead.3
4
About Me—Experience
30+ Years in Federal Budgeting GAO OMB: Senior Career Civil Servant CBO: Acting & Deputy Director
FASAB
IMF in WashingtonOECD in ParisIndependent ConsultantNational Governors Ass’n
4

5
About Me—Personal
Not an ‘R’ or a ‘D’, but an SOB! An “Card-Carrying Middle of the Roader”
5
6
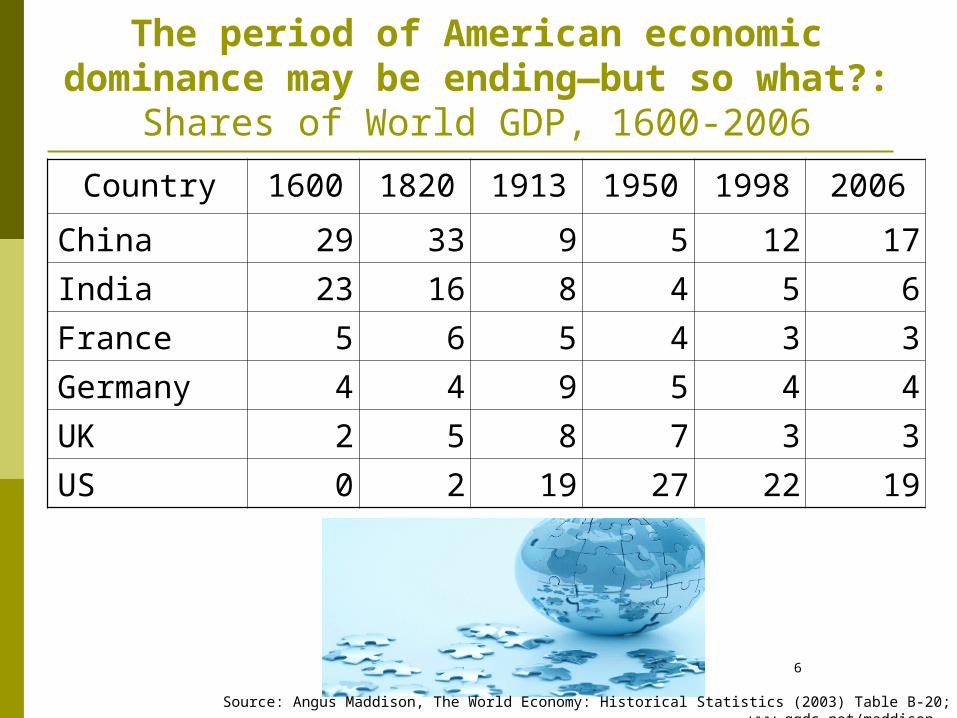
The period of American economic dominance may be ending—but so
what?:Shares of World GDP, 1600-2006
Country 1600 1820 1913 1950 1998 2006
China 29 33 9 5 12 17
India 23 16 8 4 5 6
France 5 6 5 4 3 3
Germany 4 4 9 5 4 4
UK 2 5 8 7 3 3
US 0 2 19 27 22 19
Source: Angus Maddison, The World Economy: Historical Statistics (2003) Table B-20; www.ggdc.net/maddison
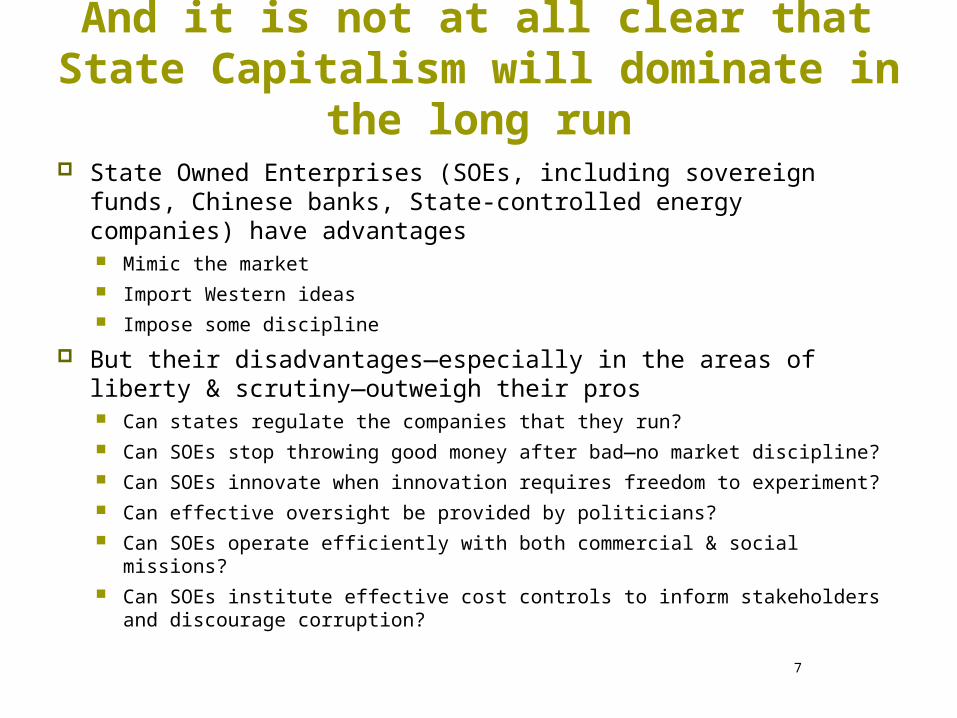
And it is not at all clear that State Capitalism will dominate in the
long run State Owned Enterprises (SOEs, including sovereign funds,
Chinese banks, State-controlled energy companies) have advantages Mimic the market Import Western ideas Impose some discipline
But their disadvantages—especially in the areas of liberty & scrutiny—outweigh their pros Can states regulate the companies that they run? Can SOEs stop throwing good money after bad—no market discipline? Can SOEs innovate when innovation requires freedom to experiment? Can effective oversight be provided by politicians? Can SOEs operate efficiently with both commercial & social missions? Can SOEs institute effective cost controls to inform stakeholders and
discourage corruption?7

Adaptability may be our most valuable asset—the view from
Sacre Couer
8
Our inherent ability to think strategically, which may be a
product of our political system(!), is also an asset
9
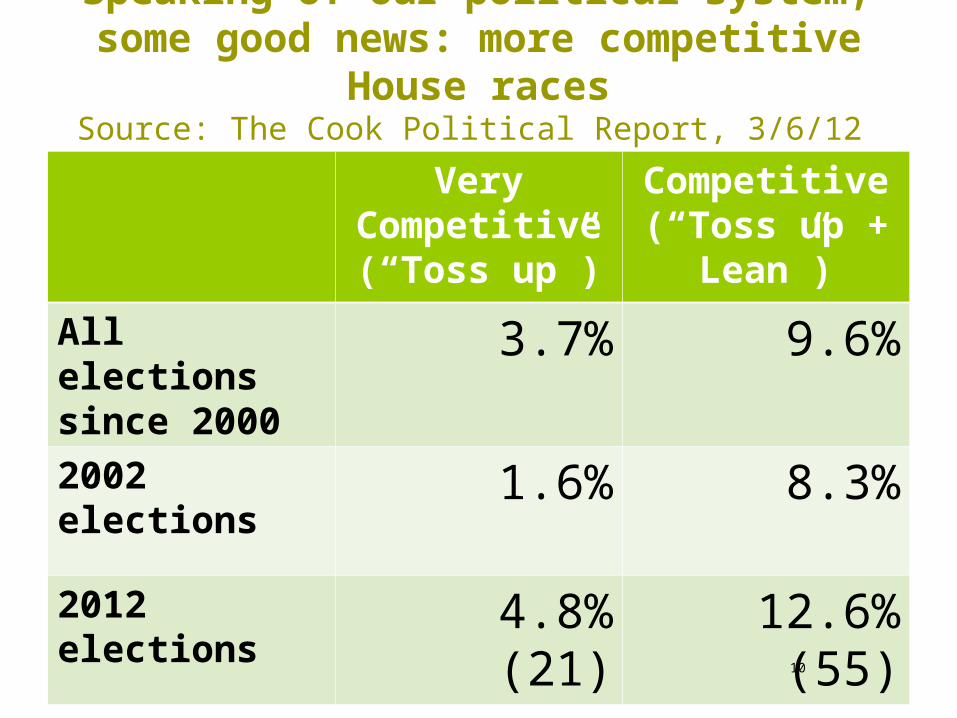
Speaking of our political system, some good news: more competitive
House racesSource: The Cook Political Report, 3/6/12
Very Competitive(“Toss up”)
Competitive(“Toss up +
Lean”)
All elections since 2000
3.7% 9.6%
2002 elections
1.6% 8.3%
2012 elections
4.8%(21)
12.6%(55)10
11
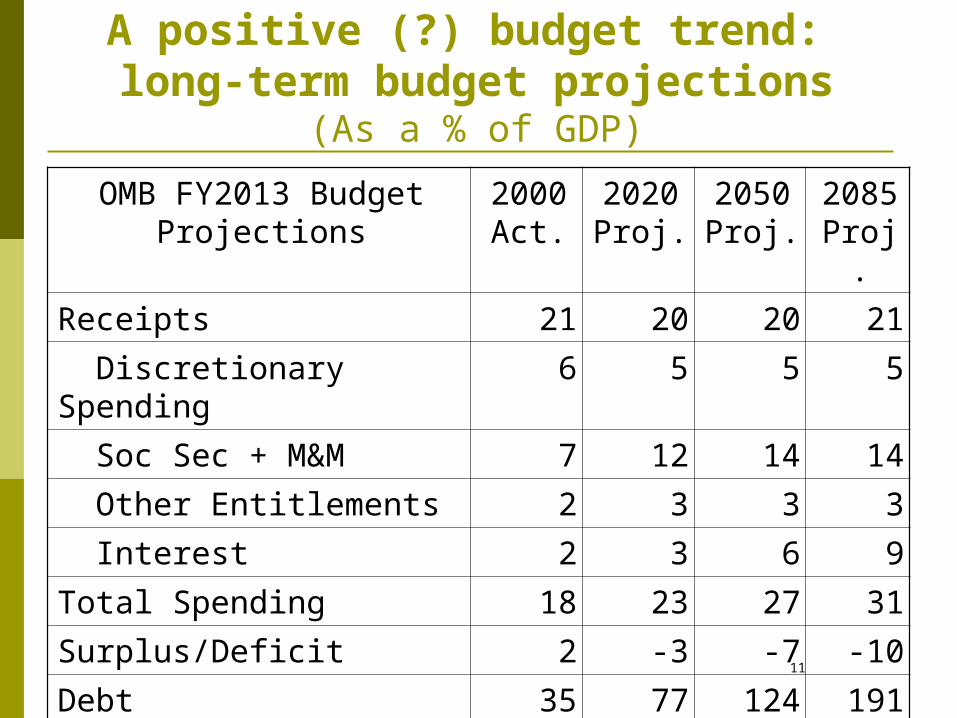
A positive (?) budget trend: long-term budget projections
(As a % of GDP)
OMB FY2013 Budget Projections
2000 Act.
2020 Proj.
2050 Proj.
2085 Proj.
Receipts 21 20 20 21
Discretionary Spending 6 5 5 5
Soc Sec + M&M 7 12 14 14
Other Entitlements 2 3 3 3
Interest 2 3 6 9
Total Spending 18 23 27 31
Surplus/Deficit 2 -3 -7 -10
Debt 35 77 124 191
12
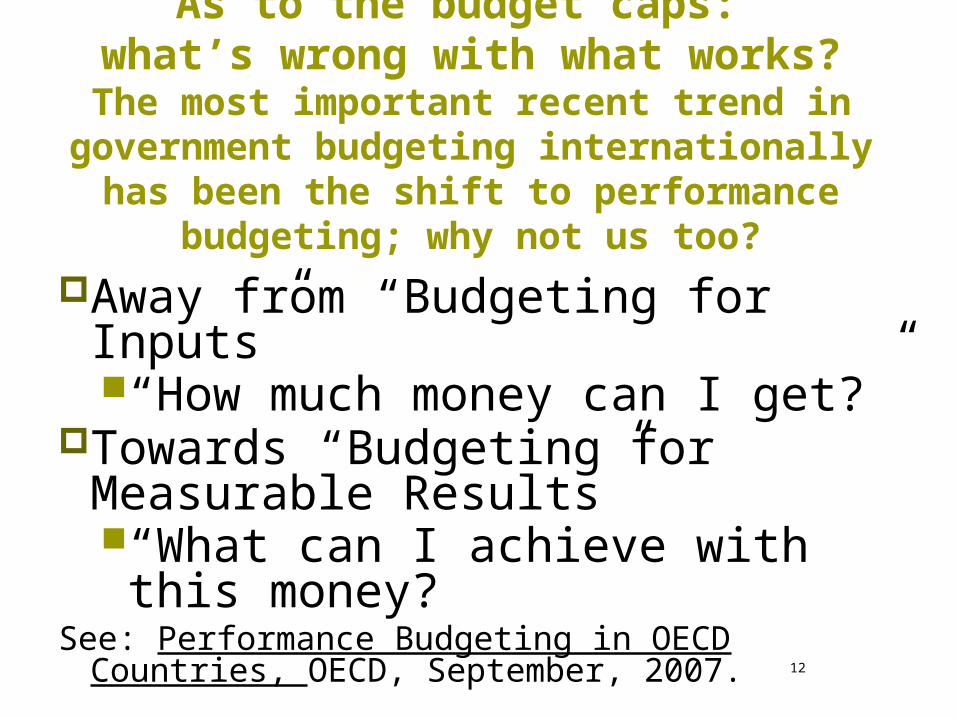
As to the budget caps: what’s wrong with what works?The most important recent trend in
government budgeting internationally has been the shift to performance
budgeting; why not us too?
Away from “Budgeting for Inputs” “How much money can I get?”
Towards “Budgeting for Measurable Results”“What can I achieve with this
money?See: Performance Budgeting in OECD Countries, OECD,
September, 2007.
13
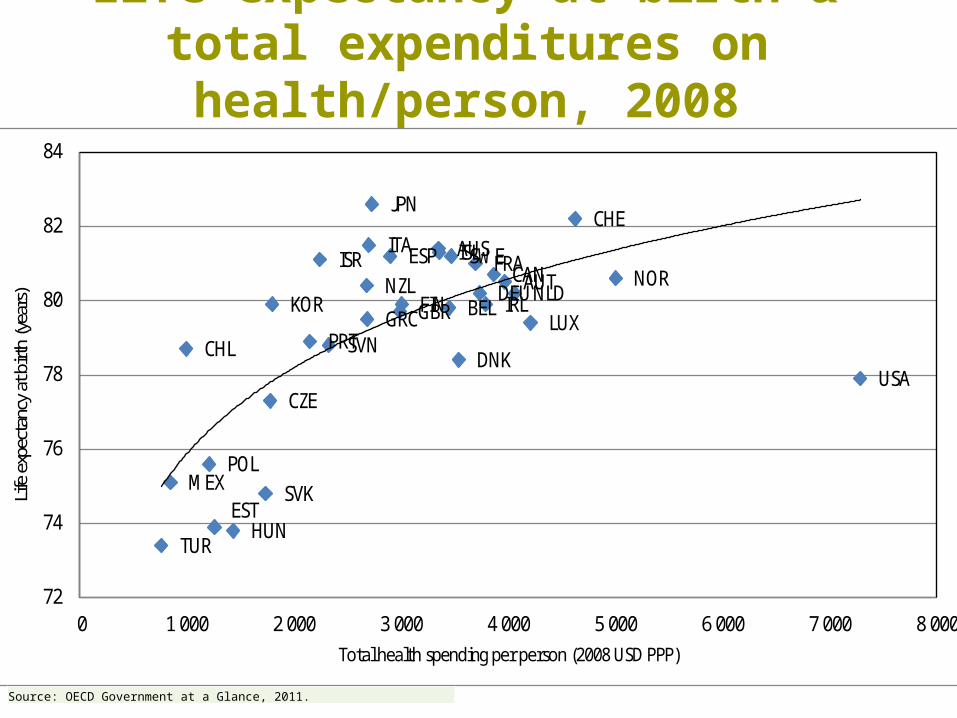
Life expectancy at birth & total expenditures on health/person,
2008
14
AUS
AUTBEL
CAN
CHL
CZE
DNK
EST
FIN
FRADEU
GRC
HUN
ISL
IRL
ISRITA
JPN
KORLUX
MEX
NLDNZL NOR
POL
PRT
SVK
SVN
ESP SWE
CHE
TUR
GBR
USA
72
74
76
78
80
82
84
0 1 000 2 000 3 000 4 000 5 000 6 000 7 000 8 000
Life
expe
ctan
cy a
t birt
h (y
ears
)
Total health spending per person (2008 USD PPP)
Source: OECD Government at a Glance, 2011.
15
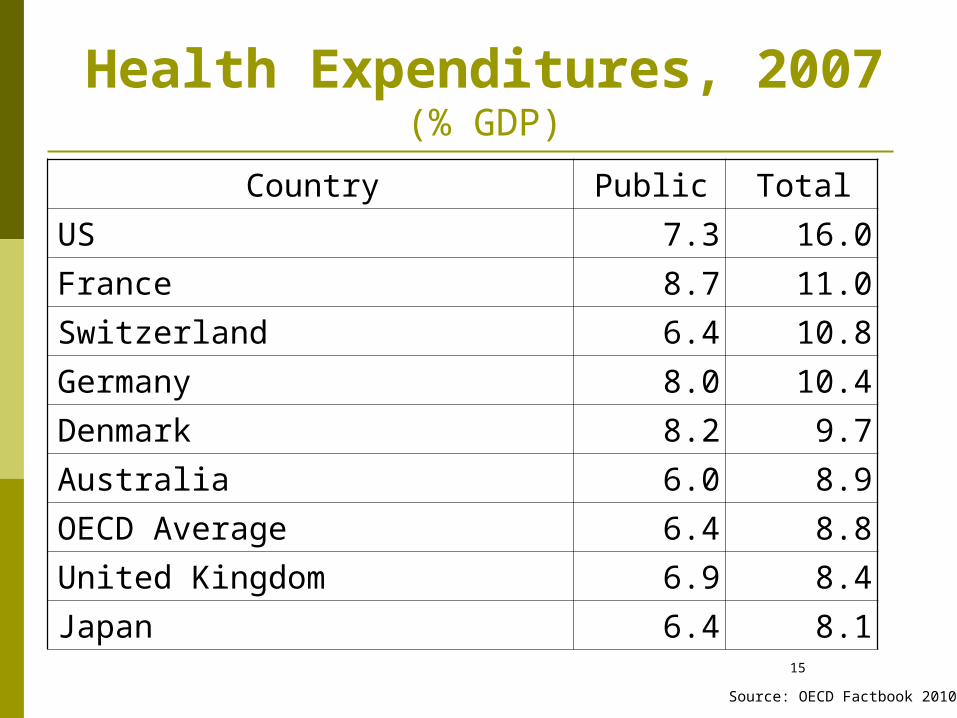
Health Expenditures, 2007(% GDP)
Country Public Total
US 7.3 16.0
France 8.7 11.0
Switzerland 6.4 10.8
Germany 8.0 10.4
Denmark 8.2 9.7
Australia 6.0 8.9
OECD Average 6.4 8.8
United Kingdom 6.9 8.4
Japan 6.4 8.1
Source: OECD Factbook 2010
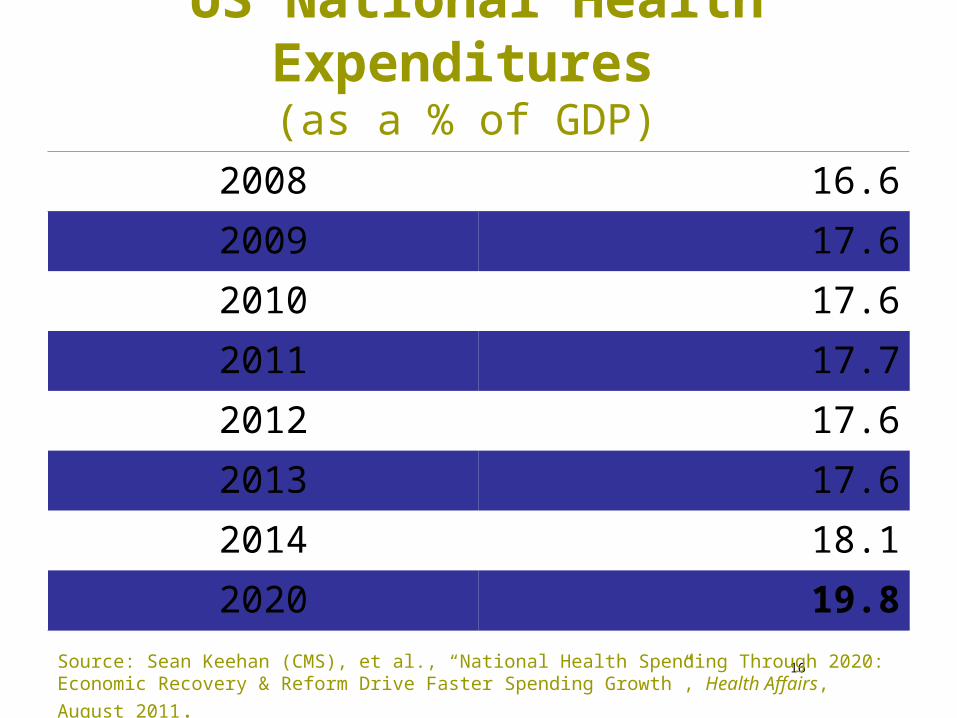
US National Health Expenditures
(as a % of GDP) 2008 16.6
2009 17.6
2010 17.6
2011 17.7
2012 17.6
2013 17.6
2014 18.1
2020 19.8
16Source: Sean Keehan (CMS), et al., “National Health Spending Through 2020: Economic
Recovery & Reform Drive Faster Spending Growth”, Health Affairs, August 2011.
17
In fact, the Europeans should learn from us:
shuck their GRH & adopt a BEA(General Government Gross Debt as a %/GDP)
Country 2008 2009 2010 2011 2012 2013
Japan 195 216 220 233 238 243
Greece 110 127 143 166 189 188
Italy 106 116 119 121 121 120
US 72 85 94 100 105 109
Canada 71 83 84 84 84 82
France 68 79 82 87 89 91
Germany 66 74 84 83 82 81
UK 52 68 76 81 85 86
Ireland 44 65 95 109 115 118Source: IMF Fiscal Monitor, Sept 2011
17
18
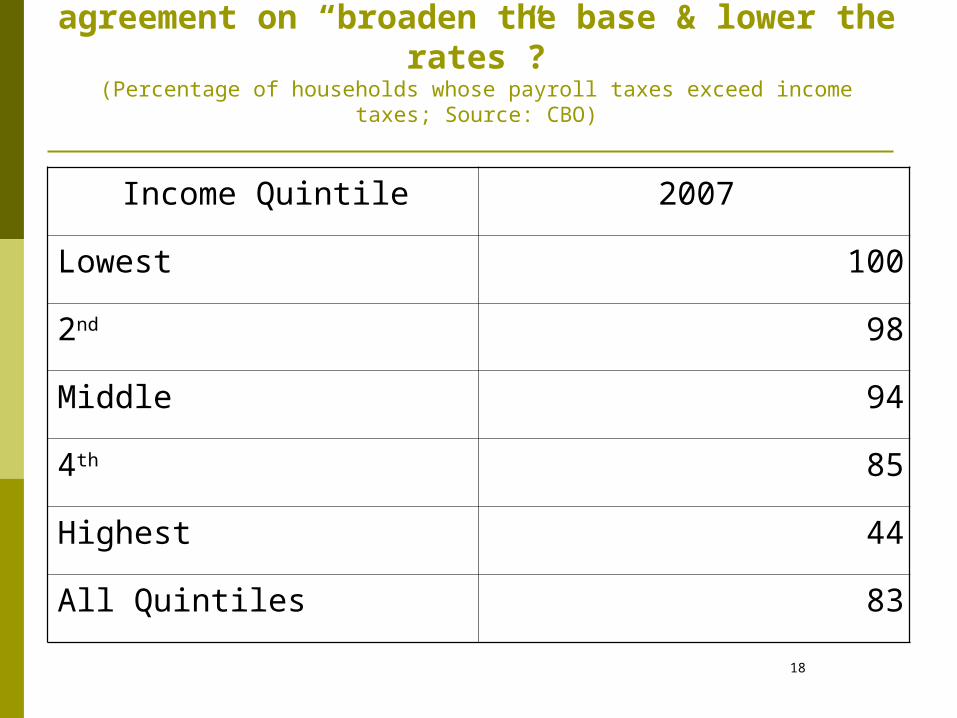
With respect to tax reform, could there be agreement on “broaden the base & lower
the rates”?(Percentage of households whose payroll taxes exceed income taxes; Source:
CBO)
Income Quintile 2007
Lowest 100
2nd 98
Middle 94
4th 85
Highest 44
All Quintiles 83
19
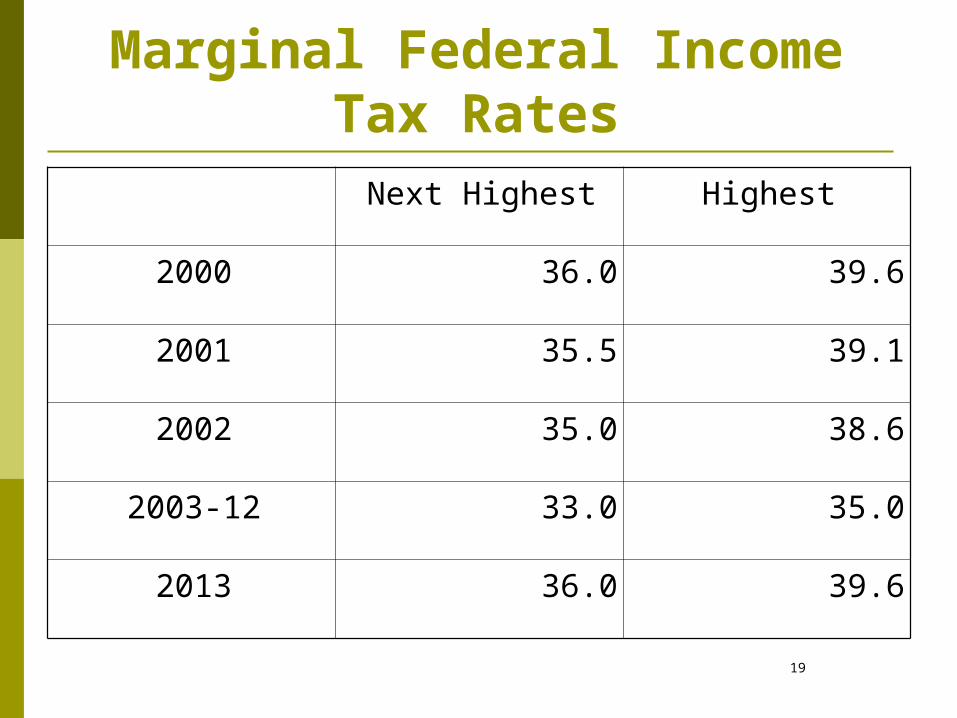
Marginal Federal Income Tax Rates
Next Highest Highest
2000 36.0 39.6
2001 35.5 39.1
2002 35.0 38.6
2003-12 33.0 35.0
2013 36.0 39.6
20
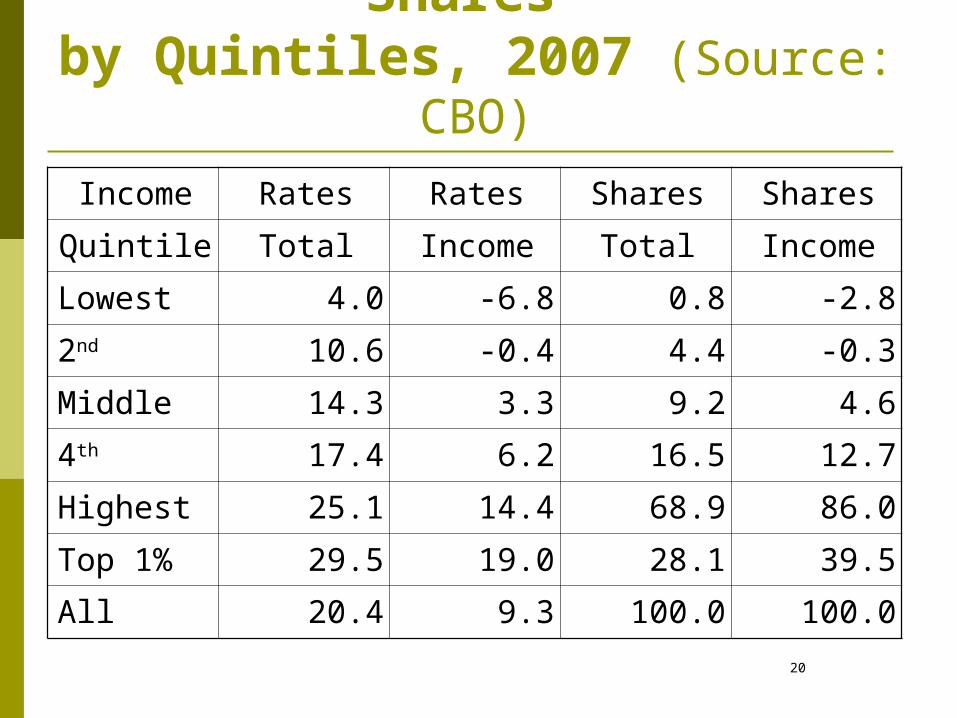
Effective Tax Rates & Shares
by Quintiles, 2007 (Source: CBO)
Income Rates Rates Shares Shares
Quintile Total Income Total Income
Lowest 4.0 -6.8 0.8 -2.8
2nd 10.6 -0.4 4.4 -0.3
Middle 14.3 3.3 9.2 4.6
4th 17.4 6.2 16.5 12.7
Highest 25.1 14.4 68.9 86.0
Top 1% 29.5 19.0 28.1 39.5
All 20.4 9.3 100.0 100.0
21
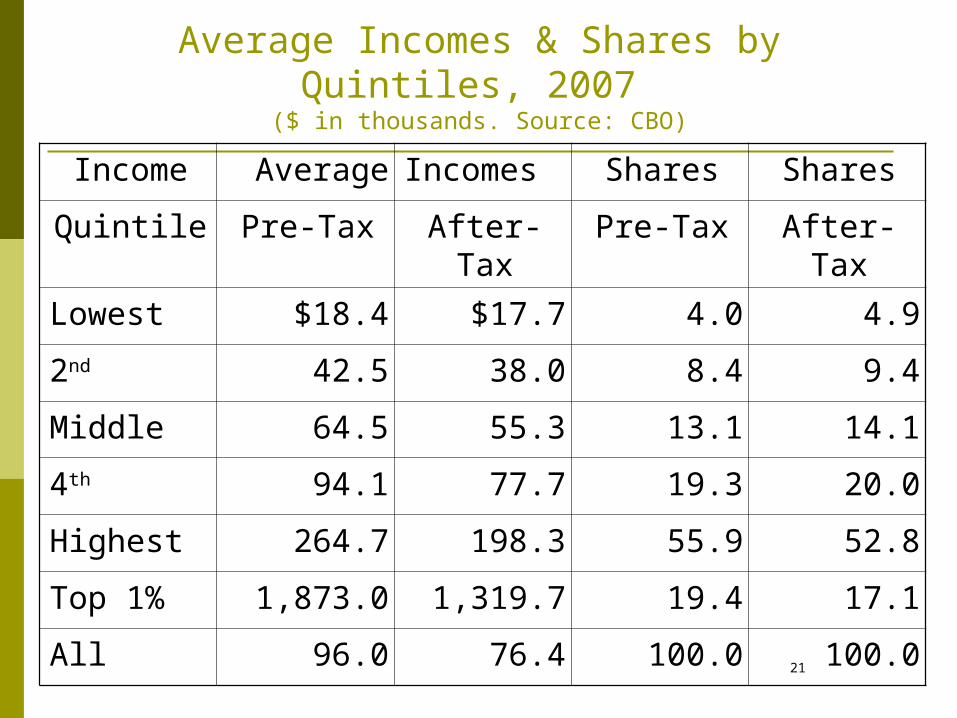
Income Average Incomes Shares Shares
Quintile Pre-Tax After-Tax Pre-Tax After-Tax
Lowest $18.4 $17.7 4.0 4.9
2nd 42.5 38.0 8.4 9.4
Middle 64.5 55.3 13.1 14.1
4th 94.1 77.7 19.3 20.0
Highest 264.7 198.3 55.9 52.8
Top 1% 1,873.0 1,319.7 19.4 17.1
All 96.0 76.4 100.0 100.0
Average Incomes & Shares by Quintiles, 2007
($ in thousands. Source: CBO)
22
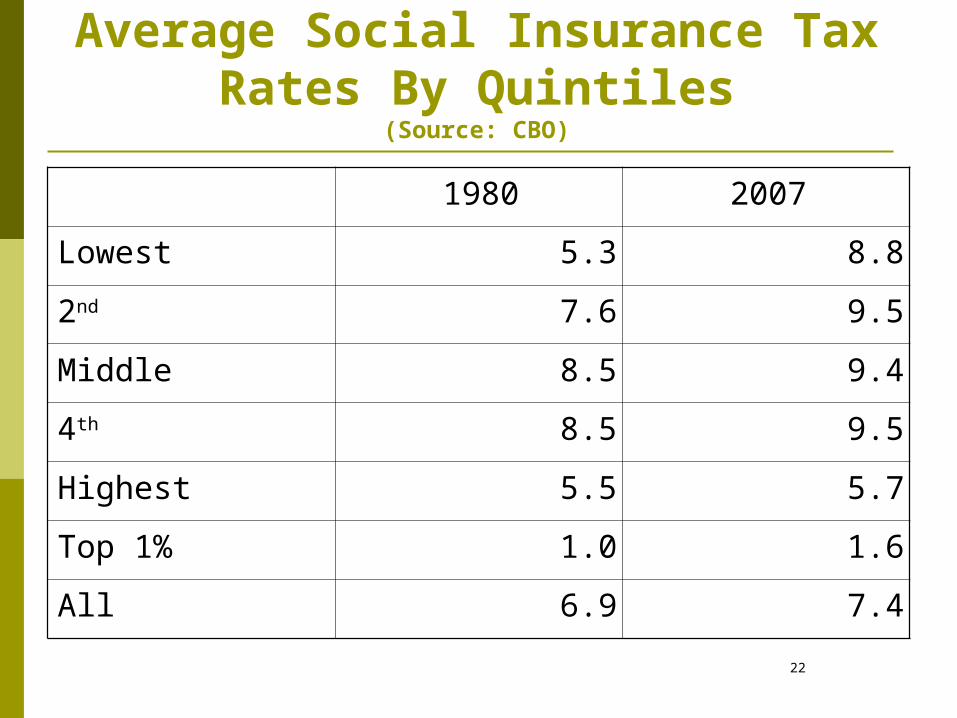
Average Social Insurance Tax Rates By Quintiles
(Source: CBO)
1980 2007
Lowest 5.3 8.8
2nd 7.6 9.5
Middle 8.5 9.4
4th 8.5 9.5
Highest 5.5 5.7
Top 1% 1.0 1.6
All 6.9 7.4
23
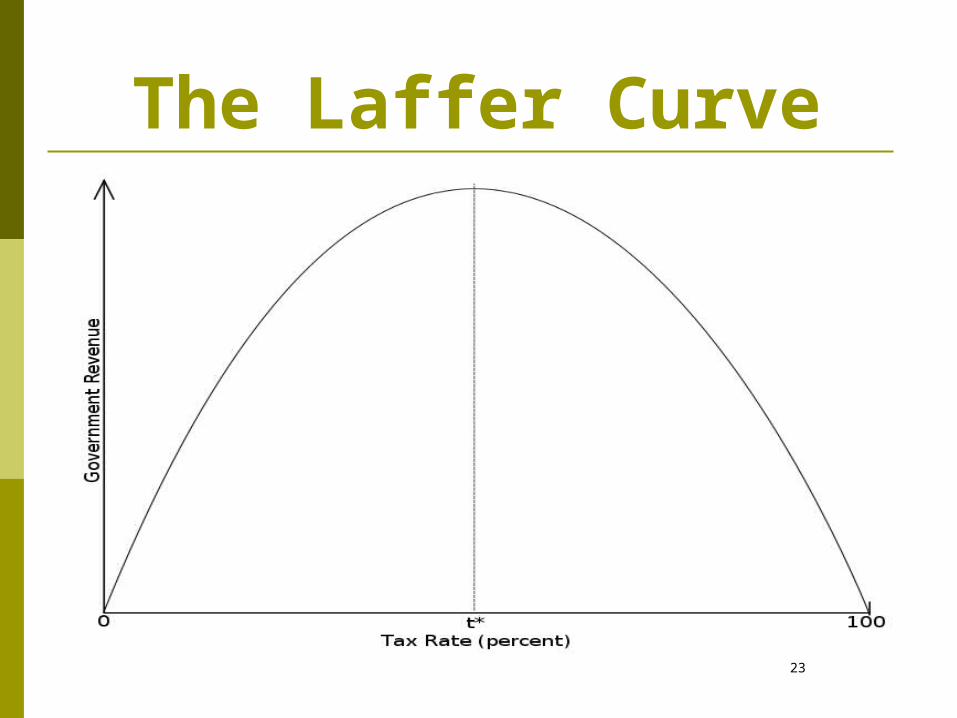
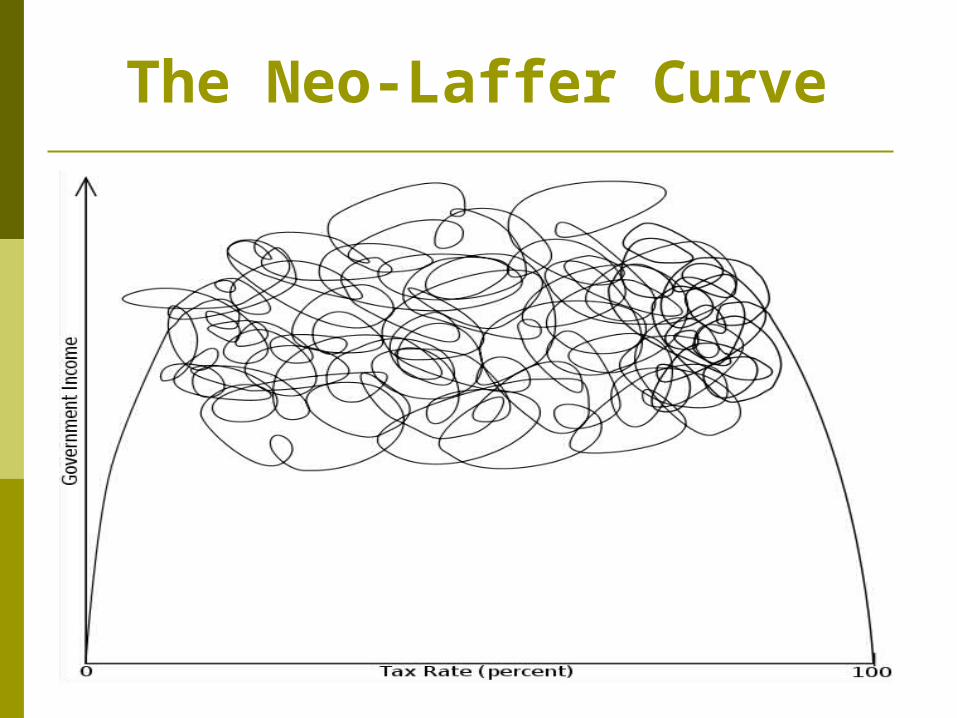
The Laffer Curve
24
The Neo-Laffer Curve
24
But Isn’t the Budget Process Broken Beyond
Repair? Long-term sustainability is the major issue, not short-
term borrowing ability—see payroll holiday pay-fors Improvements can be made
BRAC More and better credit reform
Insurance programs Administrative costs Market rates
But not: Line Item veto [Enhanced recession better] Biennial budgeting
But in sum, the process is not the problem; the problem is the problem 25
A Final Word on What We Will See in the Year Ahead
A Budgetary Perfect Storm at the end of the year: Expiration of tax cuts & payroll tax holiday Expiration of additional unemployment benefits;
TANF; R&E & other tax expenditures Then there is the sequester, debt limit, & CR
The states will be in a Big Squeeze
And finally there’s China
26

27
In conclusion, in the future—even more than in the past—it is good to
remember:
“Sunshine is the bestdisinfectant.”
Supreme Court Justice Louis Brandeis (1856-1941) 27